
Paul Tuon
3 days ago
HARNESS RACING FEVER, ANYONE?
I DO -- BIG TIME!!!
The Meadowlands Pace is a couple of weeks away -- July 12, to be precise -- but the entries for the 2025 Meadowlands Pace were taken early today (July 1, 2025) and exactly 10 3-year-old pacing colts had been entered with no morning line or post position assigned.
The morning line and post position will be assigned early in the week of July 12, 2025.
The horses entered in alphabetical order are:
CAPTAIN OPTIMISTIC
FALLOUT
JOEL AND THE JETS
KNOCKOUT ROUND
LOUPRINT
MADDEN OAKS
MANOLETE
PAPIS PISTOL
PAPI'S ROCKET
PRINCE HAL HANOVER
One horse stands out from that list is LOUPRINT who just won the $1 million North America Cup at Woodbine Mohawk on June 14,2025.
So LOUPRINT should be a very short-price favorite comes Saturday July 12, 2025.
Stay tuned!
I DO -- BIG TIME!!!
The Meadowlands Pace is a couple of weeks away -- July 12, to be precise -- but the entries for the 2025 Meadowlands Pace were taken early today (July 1, 2025) and exactly 10 3-year-old pacing colts had been entered with no morning line or post position assigned.
The morning line and post position will be assigned early in the week of July 12, 2025.
The horses entered in alphabetical order are:
CAPTAIN OPTIMISTIC
FALLOUT
JOEL AND THE JETS
KNOCKOUT ROUND
LOUPRINT
MADDEN OAKS
MANOLETE
PAPIS PISTOL
PAPI'S ROCKET
PRINCE HAL HANOVER
One horse stands out from that list is LOUPRINT who just won the $1 million North America Cup at Woodbine Mohawk on June 14,2025.
So LOUPRINT should be a very short-price favorite comes Saturday July 12, 2025.
Stay tuned!

3 days ago
Paul Tuon
5 days ago
TWO-YEAR-OLD COLT CAUGHT MY EYES!
A STAR IN THE MAKING DAZZLED ON DEBUT!
On the closing day of Churchill Downs's spring meet -- Sunday June 29, 2025 -- a 2yo colt named Dazzle d'Oro dazzled the six-furlong proceeding in a dazzling performance, covering the distance in a "dazzling" swift 1:08.65 on a fast Churchill Downs main track while beating a stellar group of 10 2yo colts.
Dazzle d'Oro (Bolt d'Oro - Sunnysammi, by First Defense) was a $250,000 KEESEP24 yearling purchase and he is trained by Tom Amoss.
Dazzle d'Oro had seven workouts listed on his DRF past performance with the first on May 6 (2025) working at Keenland at 3 furlongs on a fast track in 37 3/5 seconds (35/64) and his most recent workout was at Churchill Downs on June 18 (2025) when he did it on a fast track at 5 furlongs in 59 3/5 seconds (7/23).
Prior to that last workout he had another five-furlong at Churchill Downs (fast track) on June 11 when he went in 59 4/5 (2/10) and the rest are at Keenland with all works at four furlongs with two of them were bullit works in 46 3/5 and 46 4/5 with the other two were 48 and change.
So Dazzle d'Oro showed brilliance in the morning and he showed that brilliance in his debut race.
Dazzle d'Oro was off among the three quickest from the gate while exiting from post position 4, and he contested the pace with other two fleeted foot rivals for much of the first three furlongs.
The trio, with Dazzle d'Oro being sandwhiched by his two fleeted foot rivals, continued to go at each other while setting very fast fractions of 21.33 seconds, 44.47 seconds, 56.23 seconds, to complete the six-furlong race in 1:08.65.
Very fast for a two-year-old this time of the year.
Sent off as the 9/5 favorite off fast seven workouts, Dazzle d'Oro pulled away from the other two fleeted foot rivals at the top of the stretch while continued strongly to the wire to win by five lengths with the third horse finished 8 lengths further back behind the second place finisher and the rest were one or two lengths in a bunched group behind the third horse.
To put that into perspective, a maiden special weight race for 3yo fillies going one mile on the main track running 22.59 seconds, 45.20 seconds, 1:09.38, 1:21.49, finished in 1:34.03 for the mile race.
This race's fractions were set by a 3yo filly California shipper named Margarita Girl who had three prior race that were very fast running lines, setting very fast fractions in all three of her prior races with 21 and change and 44 and change.
Margarita Girl once again showed her brilliance early speed to make all of the fractions only to fade to next to last in this race.
The point is, without Margarita Girl making all those fractions, the pace of this race would have been much slower, and perhaps the final time as well.
For a better comparison, consider the Bashford Manor Stakes an hour later for two-year-old colts running six furlongs with the fractions of 21.39 seconds, 44.39 seconds, 56.21 seconds, and the finish time of 1:08.61.
The Bashford Manor Stakes won by an 8-1 odd in the betting Romeo with a 5-2 second choice in the betting Comfort finishing second and the 6-5 favorite Password finishing third.
Another better comparison is a race run one and a half hour later in the Debutante Stakes for 2yo fillies at six furlongs with the fractions of 21.29 seconds, 44.82 seconds, 56.88 seconds, and the finish time of 1:09.71.
The Debutante Stakes won by a 3-1 third choice in the betting Percy's Bar with a 43-1 Jaboss in second and a 5-1 fifth choice in third, while the 5/2 favorite Americathegreat finished fourth.
The Bashford Manor race is for horses of the same sex as the race that Dazzle d'Oro race and the finish times are identical for both races with Dazzle d'Oro's time of 1:08.65 while the finish time of the Bashford Manor of 1:08.61 -- exactly the same!
However, the Bashford Manor field contains winners with the winner of that race came out of a stakes race at Saratoga on June 5 (2025) in the (5 1/2 furlongs) Tremont Stakes ($145k) while the race Dazzle d'Oro ran was a maiden special weight race.
Looking at the field of the Bashford Manor I see fast horses particularly the winner (Romeo) who went 22 1/5, 44 4/5, 57 seconds flat in the Tremont Stakes but only to fade to finish third, beaten 11 1/4 lengths.
Romeo, I think, will be a very good horse but maybe suited to sprinting while Dazzle d'Oro will be suited to longer races, in my opinion.
The way he pulled away from his two early speed rivals and at the same time maintained and even increased his margin of victory from other rivals was very impressive.
Here's an excerpt of the article taken from the DRF:
Off impressive debut, Dazzle d'Oro targeting Saratoga Special
The 2-year-old colt Dazzle d'Oro sent his trainer, Tom Amoss, traveling back in time. Amoss thought about when he first came to Churchill Downs in the early 1990s, and a conversation with the late Kentucky Derby-winning trainer Lynn Whiting.
"He told me if you ever have a horse work five-eighths from the gate in under a minute, you've got a runner," Amoss said.
Dazzle d'Oro, who had breezed through the spring at Keeneland, moved to Churchill and had his first work there June 11, going five-eighths from the gate in 59.80. And, yes, he is a runner.
Dazzle d'Oro ran to his work and his 9-5 favoritism, beating 10 maidens while making his debut June 29 at Churchill. Going straight to the lead under Jose Ortiz, Dazzle d'Oro never had an anxious moment, winning by three over Blackout Time, who had almost eight lengths on the third-place finisher. He clocked 1:08.65 for six furlongs, which yielded a strong 84 Beyer Speed Figure.
"So often with first-time starters you have a horse make a mistake at the gate. We just wanted a clean break and a fair shot, and he performed well," said Amoss, who thinks Dazzle d'Oro can run farther and rate off the pace. "We never entertained the idea, he was just speedy. He's got a great mind. As Jose says, he listens really well."
A $250,000 yearling purchase, Dazzle d'Oro, by Bolt d'Oro, campaigns for Robert Delaney Jr.'s Late Night Stables, and connections have designs on the Aug. 2 Saratoga Special. Dazzle d'Oro will join Amoss's Saratoga string sometime next week.
********************
I'm very excited about this 2yo colt and I can't wait to see him races next, which I think will be the Ellis Juvenile at Ellis Park on August 10 at seven furlongs.
Or he may end up at Saratoga in races like the Saratoga Special on August 2 and/or Hopeful Stakes in September.
Knowing Tom Amoss is a native of Kentucky and based his horses at Ellis Park I think he will send Dazzle d'Oro to the Ellis Juvenile instead -- that is the most likely race for Dazzle d'Oro.
Stay tuned!
P.S.
This past weekend we got to see Hambletonian prep races when Super Chapter trots away in Friday's $300,000 Grade 2 MGM Yonkers Trot from well off-the-pace but still having plenty in reserve to secure a 1:54.3 victory as the 1/9 favorite.
Lookout for Super Chapter in the Hambletonian and he will be a force to be reckoned with in that race comes August 2, 2025.
Another dangerous horse and a force to be reckoned with (in the Hambletonian) is Gap Kronos S who won his Hambletonian prep race, the Frank Reynolds Memorial at The Meadowlands this weekend (June 28), pulling away from a very good field of 10 horses.
The most impressive thing about Gap Kronos S in this weekend's race is that, he seemed to have no shot at being in the money at all after breaking from post position 9 and being hung very wide -- about five wide -- in the first turn and continued to be wide on the backstretch when his rivals left no room for him to insert himself in the line.
So the best way for his driver to do was to stay wide and try to hustle to the front before the far turn to avoid being hung three or more wide because other horses were already moving outside to pass the leaders.
Gap Kronos S' driver did just that by hustling his mount very fast approaching the far turn, using a lot of energy in doing so, because the horses to his inside were not going to let anybody go by and cut in front of them -- and rightfully so.
In the end, Gap Kronos S was able to go past the leaders and cut in front of them and continued thereafer willingly while the rest give chase but to no avail as Gap Kronos S had plenty left at the end to win by almost three lengths as the 9/5 favorite.
Very impressive considering the circumstance of the race coming from post 9 and they didn't make it any easier for him to race at all.
A better post position in the Hambletonian and he'll be a force to be reckoned with -- no doubt! -- a live longshot!
He won't be among the favorites but he'll be somewhere at 12-1 or longer in the betting, in my opinion!
Meanwhile, Emoticon Legacy is scheduled to run next in the Zweig on July 3 (2025) at Vernon Downs (NY), running against -- who else? -- last year's (2024) two-year-old champion Maryland.
ENJOY HARNESS RACING THIS WEEKEND EVERYBODY!
A STAR IN THE MAKING DAZZLED ON DEBUT!
On the closing day of Churchill Downs's spring meet -- Sunday June 29, 2025 -- a 2yo colt named Dazzle d'Oro dazzled the six-furlong proceeding in a dazzling performance, covering the distance in a "dazzling" swift 1:08.65 on a fast Churchill Downs main track while beating a stellar group of 10 2yo colts.
Dazzle d'Oro (Bolt d'Oro - Sunnysammi, by First Defense) was a $250,000 KEESEP24 yearling purchase and he is trained by Tom Amoss.
Dazzle d'Oro had seven workouts listed on his DRF past performance with the first on May 6 (2025) working at Keenland at 3 furlongs on a fast track in 37 3/5 seconds (35/64) and his most recent workout was at Churchill Downs on June 18 (2025) when he did it on a fast track at 5 furlongs in 59 3/5 seconds (7/23).
Prior to that last workout he had another five-furlong at Churchill Downs (fast track) on June 11 when he went in 59 4/5 (2/10) and the rest are at Keenland with all works at four furlongs with two of them were bullit works in 46 3/5 and 46 4/5 with the other two were 48 and change.
So Dazzle d'Oro showed brilliance in the morning and he showed that brilliance in his debut race.
Dazzle d'Oro was off among the three quickest from the gate while exiting from post position 4, and he contested the pace with other two fleeted foot rivals for much of the first three furlongs.
The trio, with Dazzle d'Oro being sandwhiched by his two fleeted foot rivals, continued to go at each other while setting very fast fractions of 21.33 seconds, 44.47 seconds, 56.23 seconds, to complete the six-furlong race in 1:08.65.
Very fast for a two-year-old this time of the year.
Sent off as the 9/5 favorite off fast seven workouts, Dazzle d'Oro pulled away from the other two fleeted foot rivals at the top of the stretch while continued strongly to the wire to win by five lengths with the third horse finished 8 lengths further back behind the second place finisher and the rest were one or two lengths in a bunched group behind the third horse.
To put that into perspective, a maiden special weight race for 3yo fillies going one mile on the main track running 22.59 seconds, 45.20 seconds, 1:09.38, 1:21.49, finished in 1:34.03 for the mile race.
This race's fractions were set by a 3yo filly California shipper named Margarita Girl who had three prior race that were very fast running lines, setting very fast fractions in all three of her prior races with 21 and change and 44 and change.
Margarita Girl once again showed her brilliance early speed to make all of the fractions only to fade to next to last in this race.
The point is, without Margarita Girl making all those fractions, the pace of this race would have been much slower, and perhaps the final time as well.
For a better comparison, consider the Bashford Manor Stakes an hour later for two-year-old colts running six furlongs with the fractions of 21.39 seconds, 44.39 seconds, 56.21 seconds, and the finish time of 1:08.61.
The Bashford Manor Stakes won by an 8-1 odd in the betting Romeo with a 5-2 second choice in the betting Comfort finishing second and the 6-5 favorite Password finishing third.
Another better comparison is a race run one and a half hour later in the Debutante Stakes for 2yo fillies at six furlongs with the fractions of 21.29 seconds, 44.82 seconds, 56.88 seconds, and the finish time of 1:09.71.
The Debutante Stakes won by a 3-1 third choice in the betting Percy's Bar with a 43-1 Jaboss in second and a 5-1 fifth choice in third, while the 5/2 favorite Americathegreat finished fourth.
The Bashford Manor race is for horses of the same sex as the race that Dazzle d'Oro race and the finish times are identical for both races with Dazzle d'Oro's time of 1:08.65 while the finish time of the Bashford Manor of 1:08.61 -- exactly the same!
However, the Bashford Manor field contains winners with the winner of that race came out of a stakes race at Saratoga on June 5 (2025) in the (5 1/2 furlongs) Tremont Stakes ($145k) while the race Dazzle d'Oro ran was a maiden special weight race.
Looking at the field of the Bashford Manor I see fast horses particularly the winner (Romeo) who went 22 1/5, 44 4/5, 57 seconds flat in the Tremont Stakes but only to fade to finish third, beaten 11 1/4 lengths.
Romeo, I think, will be a very good horse but maybe suited to sprinting while Dazzle d'Oro will be suited to longer races, in my opinion.
The way he pulled away from his two early speed rivals and at the same time maintained and even increased his margin of victory from other rivals was very impressive.
Here's an excerpt of the article taken from the DRF:
Off impressive debut, Dazzle d'Oro targeting Saratoga Special
The 2-year-old colt Dazzle d'Oro sent his trainer, Tom Amoss, traveling back in time. Amoss thought about when he first came to Churchill Downs in the early 1990s, and a conversation with the late Kentucky Derby-winning trainer Lynn Whiting.
"He told me if you ever have a horse work five-eighths from the gate in under a minute, you've got a runner," Amoss said.
Dazzle d'Oro, who had breezed through the spring at Keeneland, moved to Churchill and had his first work there June 11, going five-eighths from the gate in 59.80. And, yes, he is a runner.
Dazzle d'Oro ran to his work and his 9-5 favoritism, beating 10 maidens while making his debut June 29 at Churchill. Going straight to the lead under Jose Ortiz, Dazzle d'Oro never had an anxious moment, winning by three over Blackout Time, who had almost eight lengths on the third-place finisher. He clocked 1:08.65 for six furlongs, which yielded a strong 84 Beyer Speed Figure.
"So often with first-time starters you have a horse make a mistake at the gate. We just wanted a clean break and a fair shot, and he performed well," said Amoss, who thinks Dazzle d'Oro can run farther and rate off the pace. "We never entertained the idea, he was just speedy. He's got a great mind. As Jose says, he listens really well."
A $250,000 yearling purchase, Dazzle d'Oro, by Bolt d'Oro, campaigns for Robert Delaney Jr.'s Late Night Stables, and connections have designs on the Aug. 2 Saratoga Special. Dazzle d'Oro will join Amoss's Saratoga string sometime next week.
********************
I'm very excited about this 2yo colt and I can't wait to see him races next, which I think will be the Ellis Juvenile at Ellis Park on August 10 at seven furlongs.
Or he may end up at Saratoga in races like the Saratoga Special on August 2 and/or Hopeful Stakes in September.
Knowing Tom Amoss is a native of Kentucky and based his horses at Ellis Park I think he will send Dazzle d'Oro to the Ellis Juvenile instead -- that is the most likely race for Dazzle d'Oro.
Stay tuned!
P.S.
This past weekend we got to see Hambletonian prep races when Super Chapter trots away in Friday's $300,000 Grade 2 MGM Yonkers Trot from well off-the-pace but still having plenty in reserve to secure a 1:54.3 victory as the 1/9 favorite.
Lookout for Super Chapter in the Hambletonian and he will be a force to be reckoned with in that race comes August 2, 2025.
Another dangerous horse and a force to be reckoned with (in the Hambletonian) is Gap Kronos S who won his Hambletonian prep race, the Frank Reynolds Memorial at The Meadowlands this weekend (June 28), pulling away from a very good field of 10 horses.
The most impressive thing about Gap Kronos S in this weekend's race is that, he seemed to have no shot at being in the money at all after breaking from post position 9 and being hung very wide -- about five wide -- in the first turn and continued to be wide on the backstretch when his rivals left no room for him to insert himself in the line.
So the best way for his driver to do was to stay wide and try to hustle to the front before the far turn to avoid being hung three or more wide because other horses were already moving outside to pass the leaders.
Gap Kronos S' driver did just that by hustling his mount very fast approaching the far turn, using a lot of energy in doing so, because the horses to his inside were not going to let anybody go by and cut in front of them -- and rightfully so.
In the end, Gap Kronos S was able to go past the leaders and cut in front of them and continued thereafer willingly while the rest give chase but to no avail as Gap Kronos S had plenty left at the end to win by almost three lengths as the 9/5 favorite.
Very impressive considering the circumstance of the race coming from post 9 and they didn't make it any easier for him to race at all.
A better post position in the Hambletonian and he'll be a force to be reckoned with -- no doubt! -- a live longshot!
He won't be among the favorites but he'll be somewhere at 12-1 or longer in the betting, in my opinion!
Meanwhile, Emoticon Legacy is scheduled to run next in the Zweig on July 3 (2025) at Vernon Downs (NY), running against -- who else? -- last year's (2024) two-year-old champion Maryland.
ENJOY HARNESS RACING THIS WEEKEND EVERYBODY!
5 days ago
Paul Tuon
1 week ago
ANYONE GOT A HARNESS RACING FEVER LATELY?
I DO -- BIG TIME!!!
MARYLAND'S UP AND COMING 3YO SENSATION STABLE MATE SUPER CHAPTER IS PREPPING FOR THE HAMBLETONIAN!
One of the biggest programs of the year at MGM Yonkers Raceway is this weekend Friday (June 27), led by the Grade 2 $300,000 MGM Yonkers Trot and the Grade 2 $200,000 MGM Grand Messenger Stakes finals for 3-year-old colts and geldings, the first legs of the Trotting and Pacing Triple Crowns.
Super Chapter (post one, Dexter Dunn listed to drive for Marcus Melander) heads the MGM Yonkers Trot, which will go as race seven on the card.
Super Chapter is two-for-two so far this year, having won his division of the New York Sire Stakes and Empire Breeders Classic, both at Vernon Downs.
Stablemate Variegated (post three, Scott Zeron) also won in the NYSS at Vernon and was the sire stakes champion a year ago, while Chat Room (post four, Tyler Buter listed to drive for John Butenschoen) was another EBC victor at Vernon.
Hard Seven (post five, Todd McCarthy listed to drive for trainer Nancy Takter) captured the 2025 Dexter Cup at the Meadowlands.
The full field is as follows:
Post-Horse-Listed Driver-Trainer
1-Super Chapter-Dexter Dunn-Marcus Melander
2-Happy Jack B-Ake Svanstedt-Ake Svanstedt
3-Variegated-Scott Zeron-Marcus Melander
4-Chat Room-Tyler Buter-John Butenschoen
5-Hard Seven-Todd McCarthy-Nancy Takter
Super Chapter with post one is the 'lock of the night!'
Go all in on Super Chapter!
MGM Grand Messenger Stakes elimination winners Twisted Destiny (Dunn listed to drive for Chris Ryder) and Odds On No Limit (Matt Kakaley listed to drive for trainer Travis Alexander) had differing luck in the open draw for the final as Twisted Destiny got post three while Odds On No Limit landed the eight-hole.
Ryder also has another entrant in the field in World Of Wishes, who will start from post two with Joe Bongiorno listed.
The MGM Grand Messenger Stakes final is race eight on the program.
Here's a full look at the MGM Grand Messenger Stakes draw:
Post-Horse-Listed Driver-Trainer
1-Manolete-Scott Zeron-Bruce Saunders
2-World Of Wishes-Joe Bongiorno-Chris Ryder
3-Twisted Destiny-Dexter Dunn-Chris Ryder
4-Fast Choice-Doug McNair-Jared Bako
5-Dandy Ideal-Jason Bartlett-Hunter Oakes
6-Banderas-Jordan Stratton-Tony Alagna
7-Papi's Rocket-Yannick Gingras-Ron Burke
8-Odds On No Limit-Matt Kakaley-Travis Alexander
AE-Jon I Love Dat
Additionally, there will be a pair of Grade 3 $50,000 Park MGM Pace divisions (races two and four) and two Grade 3 $50,000 New York New York Mile splits (races three and six) for fillies on the docket.
The opening Park MGM Pace tilt features New York Sire Stakes and Grand Circuit star The Last Martini (post three, Doug McNair listed to drive for Jared Bako), and Please Be You (post one, Scott Zeron listed to drive for Linda Toscano), coming off a victory in the New Jersey Sire Stakes Standardbred Development Fund final at the Meadowlands, goes for another stakes title in the second.
In the New York New York Mile, Royal Mission (post one, Scott Zeron listed to drive to for Marcus Melander), last year's NYSS champion, takes on 2024 Pennsylvania champion Shes A Shoe In (post two, trainer Ray Schnittker listed to drive) in the first section, and O'Brien Award winner Monalishi (post five, Yannick Gingras listed to drive for trainer Blake Macintosh) comes south from Canada to take on the undefeated-in-2025 EL Nightwish (post three, Dexter Dunn listed to drive for trainer Lucas Wallin) in the other grouping.
ENJOY HARNESS RACING THIS WEEKEND EVERYBODY!
I DO -- BIG TIME!!!
MARYLAND'S UP AND COMING 3YO SENSATION STABLE MATE SUPER CHAPTER IS PREPPING FOR THE HAMBLETONIAN!
One of the biggest programs of the year at MGM Yonkers Raceway is this weekend Friday (June 27), led by the Grade 2 $300,000 MGM Yonkers Trot and the Grade 2 $200,000 MGM Grand Messenger Stakes finals for 3-year-old colts and geldings, the first legs of the Trotting and Pacing Triple Crowns.
Super Chapter (post one, Dexter Dunn listed to drive for Marcus Melander) heads the MGM Yonkers Trot, which will go as race seven on the card.
Super Chapter is two-for-two so far this year, having won his division of the New York Sire Stakes and Empire Breeders Classic, both at Vernon Downs.
Stablemate Variegated (post three, Scott Zeron) also won in the NYSS at Vernon and was the sire stakes champion a year ago, while Chat Room (post four, Tyler Buter listed to drive for John Butenschoen) was another EBC victor at Vernon.
Hard Seven (post five, Todd McCarthy listed to drive for trainer Nancy Takter) captured the 2025 Dexter Cup at the Meadowlands.
The full field is as follows:
Post-Horse-Listed Driver-Trainer
1-Super Chapter-Dexter Dunn-Marcus Melander
2-Happy Jack B-Ake Svanstedt-Ake Svanstedt
3-Variegated-Scott Zeron-Marcus Melander
4-Chat Room-Tyler Buter-John Butenschoen
5-Hard Seven-Todd McCarthy-Nancy Takter
Super Chapter with post one is the 'lock of the night!'
Go all in on Super Chapter!
MGM Grand Messenger Stakes elimination winners Twisted Destiny (Dunn listed to drive for Chris Ryder) and Odds On No Limit (Matt Kakaley listed to drive for trainer Travis Alexander) had differing luck in the open draw for the final as Twisted Destiny got post three while Odds On No Limit landed the eight-hole.
Ryder also has another entrant in the field in World Of Wishes, who will start from post two with Joe Bongiorno listed.
The MGM Grand Messenger Stakes final is race eight on the program.
Here's a full look at the MGM Grand Messenger Stakes draw:
Post-Horse-Listed Driver-Trainer
1-Manolete-Scott Zeron-Bruce Saunders
2-World Of Wishes-Joe Bongiorno-Chris Ryder
3-Twisted Destiny-Dexter Dunn-Chris Ryder
4-Fast Choice-Doug McNair-Jared Bako
5-Dandy Ideal-Jason Bartlett-Hunter Oakes
6-Banderas-Jordan Stratton-Tony Alagna
7-Papi's Rocket-Yannick Gingras-Ron Burke
8-Odds On No Limit-Matt Kakaley-Travis Alexander
AE-Jon I Love Dat
Additionally, there will be a pair of Grade 3 $50,000 Park MGM Pace divisions (races two and four) and two Grade 3 $50,000 New York New York Mile splits (races three and six) for fillies on the docket.
The opening Park MGM Pace tilt features New York Sire Stakes and Grand Circuit star The Last Martini (post three, Doug McNair listed to drive for Jared Bako), and Please Be You (post one, Scott Zeron listed to drive for Linda Toscano), coming off a victory in the New Jersey Sire Stakes Standardbred Development Fund final at the Meadowlands, goes for another stakes title in the second.
In the New York New York Mile, Royal Mission (post one, Scott Zeron listed to drive to for Marcus Melander), last year's NYSS champion, takes on 2024 Pennsylvania champion Shes A Shoe In (post two, trainer Ray Schnittker listed to drive) in the first section, and O'Brien Award winner Monalishi (post five, Yannick Gingras listed to drive for trainer Blake Macintosh) comes south from Canada to take on the undefeated-in-2025 EL Nightwish (post three, Dexter Dunn listed to drive for trainer Lucas Wallin) in the other grouping.
ENJOY HARNESS RACING THIS WEEKEND EVERYBODY!
1 week ago
Paul Tuon
1 week ago
HARNESS RACING FEVER, ANYONE?
A FULL DOSE OF HARNESS RACING STARTING THIS WEEKEND TO AUG 2!
MEANWHILE HERE IS A HARNESS RACING LEADERBOARD STANDING!
The Hambletonian Society/Breeders Crown poll, which will continue weekly on Wednesdays through the Grand Circuit season.
[The Grand Circuit season in 2025 refers to a series of premier harness racing events held at various locations throughout the year. ]
The polls are based on votes by the members of the U.S. Harness Writers Association to determine leaders of the divisions.
As of this week, Louprint, who just won the $1 million North American Cup at Woodbine Mohawk on June 14, 2025, is the leader with Twin B Joe Fresh in second and a 3yo pacing filly Miki And Minnie in third place in the standing.
Hambletonian Society/Breeders Crown Standardbred Poll: Week 2 – 6/25/2025.
3cp = 3yo male pacer
mp = male pacer
mt = male trotter
fp = filly pacer
ct = colt trotter
hp = horse pacer
g = gelding
In harness racing, the letter "H" typically indicates that a horse is a "horse" which, in the context of racing programs and Thoroughbred racing, specifically refers to an unaltered male horse (a stallion) that is 5 years old or older -- hence, an hp is a horse pacer.
Rank Name Age/Sex
1. Louprint (3cp)
2. Twin B Joe Fresh (5mp)
3. Miki And Minnie (3fp)
4. Emoticon Legacy (3ct)
5. Ken Hanover (5hp - or 5yo horse pacer)
6. Dial Square S (5mt)
7. Brue Hanover (5gp)
8. Chantilly (3fp)
9. Mossdale Ben N (7gp)
10. Nijinsky (4hp)
FOLLOW BY (in that order): Smooth Dream, Aardie B Miki N, Super Chapter, Private Access, Bythemissal, Captain Albano, Madden Oaks, up to Maryland in 28th place -- yes, that is right: my former Hambletonian horse watch prospect dropped all the way to 28th.
My newly Hambletonian watch horse Emoticon Legacy made the list in fourth behind the 'no surprise' leaders Louprint and Twin B Joe Fresh.
But the BIG surprise, for me, is the 3yo pacing filly Miki And Minnie in third ahead of Emoticon Legacy -- that is a huge surprise!
Anyhow, I'll take Emoticon Legacy in fourth place with a lot of momentum and confidence heading to August 2.
Stay tuned!
A FULL DOSE OF HARNESS RACING STARTING THIS WEEKEND TO AUG 2!
MEANWHILE HERE IS A HARNESS RACING LEADERBOARD STANDING!
The Hambletonian Society/Breeders Crown poll, which will continue weekly on Wednesdays through the Grand Circuit season.
[The Grand Circuit season in 2025 refers to a series of premier harness racing events held at various locations throughout the year. ]
The polls are based on votes by the members of the U.S. Harness Writers Association to determine leaders of the divisions.
As of this week, Louprint, who just won the $1 million North American Cup at Woodbine Mohawk on June 14, 2025, is the leader with Twin B Joe Fresh in second and a 3yo pacing filly Miki And Minnie in third place in the standing.
Hambletonian Society/Breeders Crown Standardbred Poll: Week 2 – 6/25/2025.
3cp = 3yo male pacer
mp = male pacer
mt = male trotter
fp = filly pacer
ct = colt trotter
hp = horse pacer
g = gelding
In harness racing, the letter "H" typically indicates that a horse is a "horse" which, in the context of racing programs and Thoroughbred racing, specifically refers to an unaltered male horse (a stallion) that is 5 years old or older -- hence, an hp is a horse pacer.
Rank Name Age/Sex
1. Louprint (3cp)
2. Twin B Joe Fresh (5mp)
3. Miki And Minnie (3fp)
4. Emoticon Legacy (3ct)
5. Ken Hanover (5hp - or 5yo horse pacer)
6. Dial Square S (5mt)
7. Brue Hanover (5gp)
8. Chantilly (3fp)
9. Mossdale Ben N (7gp)
10. Nijinsky (4hp)
FOLLOW BY (in that order): Smooth Dream, Aardie B Miki N, Super Chapter, Private Access, Bythemissal, Captain Albano, Madden Oaks, up to Maryland in 28th place -- yes, that is right: my former Hambletonian horse watch prospect dropped all the way to 28th.
My newly Hambletonian watch horse Emoticon Legacy made the list in fourth behind the 'no surprise' leaders Louprint and Twin B Joe Fresh.
But the BIG surprise, for me, is the 3yo pacing filly Miki And Minnie in third ahead of Emoticon Legacy -- that is a huge surprise!
Anyhow, I'll take Emoticon Legacy in fourth place with a lot of momentum and confidence heading to August 2.
Stay tuned!
1 week ago
Paul Tuon
1 week ago
"HOT" "HOT" HAMBLETONIAN TRAIL!
THE TRAIL IS SO HOT THAT I AM ALREADY HAVING A HAMBLETONIAN FEVER!
It all started what amounted to a simmering chill the weekend of June 13 (2025) when a Hambletonian prep race took place featuring Maryland versus his up and coming 3yo sensation stable mate Super Chapter -- and now, it turns into a full blown Hambletonian fever.
The symptom?
Here it is:
HARNESS RACING: HAMBLETONIAN IMPLICATION!
MARYLAND VS SUPER CHAPTER
A field of 10 Hambletonian-eligible trotters will go behind the starting gate Friday (June 13, 2025) in the $225,000 New Jersey Sire Stakes championship for 3-year-old male trotters at The Meadowlands.
[Please check out The Meadowlands' entries for the Friday card.]
ENJOY FRIDAY NIGHT OF HARNESS RACING AT THE MEADOWLANDS EVERYBODY!
The lineup includes three of this season's four fastest sophomore boys: Mr Walner Fashion, Mountcastle and Onajetplane.
The morning-line favorite, Mr Walner Fashion at 3-1, heads to the race 2-for-2 this year and is coming off a 1:51 2/5 score in a $25,000 second-round NJSS division June 6 (2025) at The Big M.
The mark is tied for the season's best; Mountcastle also trotted 1:51 2/5 in his NJSS prelim later that same night. Both horses won by a head.
However, on the same day (Friday June 13) my eyes are on Maryland running against his stablemate Super Chapter at Vernon Downs (NY), race 8, in the EMPIRE BREEDERS CLASSIC Three-Year-Old Colts & Geldings.
A small field of five -- it looks to be a two-horse race between Maryland (ML 9-5) and his stablemate Super Chapter (ML 8-5) in what looks like a preview of the Hambletonian Civil War battle.
Super Chapter is the race's favorite (ML 8/5) and he has post position 3, while Maryland is the second choice and he will break from the outside post 5.
Advantage to Super Chapter in this race but he will have to earn it with Maryland in the same race.
Easy exacta!
MY PLAY OF THE NIGHT: HIGHLAND KISMET
Race 12 (The Meadowlands): $50K Graduate 2nd leg for 4YO Trotters
HIGHLAND KISMET has unlimited potential and Nancy Takter has been charged with trying to get the most out of him. The first qualifier two weeks ago seemed to be going along smoothly when he made what looked like a speed break to me -- HIGHLAND KISMET broke strides.
Nancy Takter, his trainer, said she thought maybe the miscue was because his hobbles were too tight.
So for this race I think she plans to correct the hobbles so they will be a little loose.
Bet HIGHLAND KISMET to win, place using double down!
ON THE SAME NIGHT [JUNE 14] AT WOODBINE MOHAWK THERE ARE STAKES RACES AND ONE IN PARTICULAR IS THE $1,000,000 NORTH AMERICA CUP
The Woodbine Mohawk race card is full of good betting races headlined by the North America Cup, race 11, in which, I like the 7/5 morning line favorite Louprint (post 4) in a full field of 10.
It's a $1 million race and a prep for the Meadowlands Pace (July 12) and as such anything can happen in a full field of 12.
Having said that, the likely winner is the 7/5 morning line favorite Louprint.
He is the best horse in the field and likely to go down in odd -- 4/5 or even money is my guess.
Also in the card, race 10, a cinch horse in Chantilly.
Bet Chantilly (ML 1-1) to win and put a lot of money on her because she is going to win this race at a very short price.
This is the easiest money you'll ever going to get on any card for this Saturday June 14, 2025.
Chantilly crowned Canada's Horse of the Year for 2024
Chantilly, the 2-Year-Old Pacing Filly of the Year (2024) was also named the Somebeachsomewhere Horse of the Year (2024).
She became just the fifth 2-year-old - and only the third pacing filly - to be named Canada's Horse of the Year, joining the likes of Emilie Cas El, Whenuwishuponastar, Somebeachsomewhere and JK She'salady.
Chantilly, Canada's reigning Horse of the Year, set a career best 1:49.4 mark while easily besting a field of 10 in the lone $140,000 Ontario Sires Stakes (OSS) Gold Series event for three-year-old pacing fillies on Saturday, May 24 (2025) at Woodbine Mohawk Park. It was the first OSS Gold event of 2025.
Millar Farms' homebred daughter of Big Jim out of Shiraz Seelster, who was sent off at 1/9, is now undefeated through all 11 career starts. It was her second pari-mutuel win of 2025 and pushed her career earnings to $897,756.
Starting from the rail, driver James MacDonald positioned Chantilly fourth in the early going. The pair took the lead with a strong brush before reaching the half in :55. They opened up on the field from there through the three-quarters in 1:21.4 and came home in :28 to win by 4-1/2 lengths over Wickedpace (Jody Jamieson) on a cold, windy night. Perfectly Chic (Bob McClure) was third.
"[Chantilly's] high gear is just something else, MacDonald told Woodbine Mohawk Park's Chad Rozema. "I was able to clear the lead pretty, pretty easily. And then she's just one of those horses -- and I've only driven a few of them in my life -- where you feel like you're absolutely crawling ...
You've got to be careful with her, because she's just got unbelievable speed.
"She's just a special horse. She's passed every test with flying colours. I would have liked to go :52 with the brakes on, but she's got other plans.
Sometimes when you put her in top gear she's just relentless with her speed. Hopefully, she keeps carrying on to bigger and better things.
Whether that means Chantilly will be entered against the boys in the $1 million Pepsi North America Cup or the Fan Hanover for sophomore fillies -- both have their finals on June 14 at Woodbine Mohawk Park -- will be up to her owner George Millar, said Chantilly's trainer Nick Gallucci.
"It's going to be George Millar's call, said Gallucci, indicating she'll get next week off. "We'll just see what happens, and I'm good with whatever decision he makes."
[End of Symptom]
The symptom is going to get worse when the up and coming 3yo sensation Go Dog Go tunes up for the Hambletonian in a race this weekend (June 28, 2025) in the Reynolds Memorial at The Meadowlands against Mr Walner Fashion, Gap Kronos S, and Maximus Mearas S -- all are Hambletonian-bound.
Also this weekend, Super Chapter, a Kentucky champion from 2024 and a stable mate of Maryland, is scheduled to take on just four rivals – Hard Seven, Happy Jack B, Chat Room and Variegated – at Yonkers Raceway on Friday night June 27, 2025.
If you read the "symptom" above you know that Super Chapter was the morning line favorite over his stable mate -- two-year-old champion Maryland -- in the Friday June 13 (2025) race.
If you didn't catch that race, Super Chapter reeled off a 1:50 4/5 Empire Breeders Classic win at Vernon Downs that night over his fancy stable mate Maryland to improve his 2025 record to two-for-two.
In that race Super Chapter went wire to wire in 1:50 4/5, just one-fifth off all-age track record.
Yes, that is right: 1/5 off the track record.
THAT WILL CATCH MY ATTENTION QUICKLY!!!
He did it against last year's (2024) two-year-old champion Maryland while beating his fancy stable mate almost by two lengths with Hard Seven in a further distance third in a small field of five.
SPEAKING OF TRACK RECORD, ANOTHER HAMBLETONIAN-BOUND DID JUST THAT!
Emoticon Legacy absolutely crushed his foes by more than three lengths in the Goodtimes at Woodbine Mohawk Park (June 14, 2025) in a Canadian record 1:50 2/5, a mark he now shares with three older horses – Alrajah One It, Atlanta and Gaines Hanover.
At the end of the mile he was clearly pulling away from a good horse Gap Kronos S (who runs this weekend against Go Dog Go).
Trainer Luc Blais after the Goodtimes win: "I know he has lots of speed. He just has to control his emotions."
Emoticon Legacy is scheduled to run next in the Zweig on July 3 (2025) at Vernon Downs (NY), running against -- who else? -- last year's (2024) two-year-old champion Maryland.
DID I SAY I AM HAVING A FEVER?
OH, BOY! -- DO I EVER?
THE WEEKEND COULDN'T COME SOON ENOUGH!
THE JULY 3RD COULDN'T COME SOON ENOUGH!
THAT IS NOT TO SAY AUGUST 2!
HOW AM I GOING TO SURVIVE UNTIL AUGUST 2?
UNTIL THEN IT IS GOING TO BE A VERY VERY EXTRA EXTRA FULL BLOWN FEVER!
OH, MY!!!
DID I SAY THAT I'M A HORSE RACING JUNKIE?
MEANWHILE THE FEVER RAGES ON!
Also scheduled to join Emoticon Legacy in running against last year's (2024) two-year-old champion Maryland are Monserrate, Hidalgo, and Onajetplane -- all are Hambletonian-bound.
AS I STATED ABOVE THAT ... ANY HORSE ... CAME CLOSE TO OR BREAKING A TRACK RECORD WILL CATCH MY ATTENTION QUICKLY!!!
OH, BOY! -- DOES IT EVER?
Emoticon Legacy absolutely catches my attention big time!
He tied a Canadian track record of 1:50 2/5, a mark he now shares with three older horses -- yes, this 3yo is now in the company of his elders.
That says a lot!
If you follow me all along this past spring about the Kentucky Derby trail, in which, I swore my Derby horse allegiance to Cornucopian [as my Derby horse].
And then, all of a sudden, a horse named American Promise broke a track record winning the Virginia Derby and I quickly switched my Derby horse allegiance prospect from Cornucopian to American Promise.
The same thing happens here: I just switched my Hambletonian horse allegiance prospect from Maryland to Emoticon Legacy after he tied the Canadian track record of 1:50 2/5.
IT'S A NO-BRAINER!!!
So from now on, I swear my Hambletonian horse allegiance prospect to Emoticon Legacy.
MARK YOUR CALENDAR: July 3 (2025) at Vernon Downs (NY).
I CAN'T WAIT!!!
MEANWHILE, ENJOY FRIDAY NIGHT AND SATURDAY NIGHT OF HARNESS RACING THIS WEEKEND, EVERYBODY!
THE TRAIL IS SO HOT THAT I AM ALREADY HAVING A HAMBLETONIAN FEVER!
It all started what amounted to a simmering chill the weekend of June 13 (2025) when a Hambletonian prep race took place featuring Maryland versus his up and coming 3yo sensation stable mate Super Chapter -- and now, it turns into a full blown Hambletonian fever.
The symptom?
Here it is:
HARNESS RACING: HAMBLETONIAN IMPLICATION!
MARYLAND VS SUPER CHAPTER
A field of 10 Hambletonian-eligible trotters will go behind the starting gate Friday (June 13, 2025) in the $225,000 New Jersey Sire Stakes championship for 3-year-old male trotters at The Meadowlands.
[Please check out The Meadowlands' entries for the Friday card.]
ENJOY FRIDAY NIGHT OF HARNESS RACING AT THE MEADOWLANDS EVERYBODY!
The lineup includes three of this season's four fastest sophomore boys: Mr Walner Fashion, Mountcastle and Onajetplane.
The morning-line favorite, Mr Walner Fashion at 3-1, heads to the race 2-for-2 this year and is coming off a 1:51 2/5 score in a $25,000 second-round NJSS division June 6 (2025) at The Big M.
The mark is tied for the season's best; Mountcastle also trotted 1:51 2/5 in his NJSS prelim later that same night. Both horses won by a head.
However, on the same day (Friday June 13) my eyes are on Maryland running against his stablemate Super Chapter at Vernon Downs (NY), race 8, in the EMPIRE BREEDERS CLASSIC Three-Year-Old Colts & Geldings.
A small field of five -- it looks to be a two-horse race between Maryland (ML 9-5) and his stablemate Super Chapter (ML 8-5) in what looks like a preview of the Hambletonian Civil War battle.
Super Chapter is the race's favorite (ML 8/5) and he has post position 3, while Maryland is the second choice and he will break from the outside post 5.
Advantage to Super Chapter in this race but he will have to earn it with Maryland in the same race.
Easy exacta!
MY PLAY OF THE NIGHT: HIGHLAND KISMET
Race 12 (The Meadowlands): $50K Graduate 2nd leg for 4YO Trotters
HIGHLAND KISMET has unlimited potential and Nancy Takter has been charged with trying to get the most out of him. The first qualifier two weeks ago seemed to be going along smoothly when he made what looked like a speed break to me -- HIGHLAND KISMET broke strides.
Nancy Takter, his trainer, said she thought maybe the miscue was because his hobbles were too tight.
So for this race I think she plans to correct the hobbles so they will be a little loose.
Bet HIGHLAND KISMET to win, place using double down!
ON THE SAME NIGHT [JUNE 14] AT WOODBINE MOHAWK THERE ARE STAKES RACES AND ONE IN PARTICULAR IS THE $1,000,000 NORTH AMERICA CUP
The Woodbine Mohawk race card is full of good betting races headlined by the North America Cup, race 11, in which, I like the 7/5 morning line favorite Louprint (post 4) in a full field of 10.
It's a $1 million race and a prep for the Meadowlands Pace (July 12) and as such anything can happen in a full field of 12.
Having said that, the likely winner is the 7/5 morning line favorite Louprint.
He is the best horse in the field and likely to go down in odd -- 4/5 or even money is my guess.
Also in the card, race 10, a cinch horse in Chantilly.
Bet Chantilly (ML 1-1) to win and put a lot of money on her because she is going to win this race at a very short price.
This is the easiest money you'll ever going to get on any card for this Saturday June 14, 2025.
Chantilly crowned Canada's Horse of the Year for 2024
Chantilly, the 2-Year-Old Pacing Filly of the Year (2024) was also named the Somebeachsomewhere Horse of the Year (2024).
She became just the fifth 2-year-old - and only the third pacing filly - to be named Canada's Horse of the Year, joining the likes of Emilie Cas El, Whenuwishuponastar, Somebeachsomewhere and JK She'salady.
Chantilly, Canada's reigning Horse of the Year, set a career best 1:49.4 mark while easily besting a field of 10 in the lone $140,000 Ontario Sires Stakes (OSS) Gold Series event for three-year-old pacing fillies on Saturday, May 24 (2025) at Woodbine Mohawk Park. It was the first OSS Gold event of 2025.
Millar Farms' homebred daughter of Big Jim out of Shiraz Seelster, who was sent off at 1/9, is now undefeated through all 11 career starts. It was her second pari-mutuel win of 2025 and pushed her career earnings to $897,756.
Starting from the rail, driver James MacDonald positioned Chantilly fourth in the early going. The pair took the lead with a strong brush before reaching the half in :55. They opened up on the field from there through the three-quarters in 1:21.4 and came home in :28 to win by 4-1/2 lengths over Wickedpace (Jody Jamieson) on a cold, windy night. Perfectly Chic (Bob McClure) was third.
"[Chantilly's] high gear is just something else, MacDonald told Woodbine Mohawk Park's Chad Rozema. "I was able to clear the lead pretty, pretty easily. And then she's just one of those horses -- and I've only driven a few of them in my life -- where you feel like you're absolutely crawling ...
You've got to be careful with her, because she's just got unbelievable speed.
"She's just a special horse. She's passed every test with flying colours. I would have liked to go :52 with the brakes on, but she's got other plans.
Sometimes when you put her in top gear she's just relentless with her speed. Hopefully, she keeps carrying on to bigger and better things.
Whether that means Chantilly will be entered against the boys in the $1 million Pepsi North America Cup or the Fan Hanover for sophomore fillies -- both have their finals on June 14 at Woodbine Mohawk Park -- will be up to her owner George Millar, said Chantilly's trainer Nick Gallucci.
"It's going to be George Millar's call, said Gallucci, indicating she'll get next week off. "We'll just see what happens, and I'm good with whatever decision he makes."
[End of Symptom]
The symptom is going to get worse when the up and coming 3yo sensation Go Dog Go tunes up for the Hambletonian in a race this weekend (June 28, 2025) in the Reynolds Memorial at The Meadowlands against Mr Walner Fashion, Gap Kronos S, and Maximus Mearas S -- all are Hambletonian-bound.
Also this weekend, Super Chapter, a Kentucky champion from 2024 and a stable mate of Maryland, is scheduled to take on just four rivals – Hard Seven, Happy Jack B, Chat Room and Variegated – at Yonkers Raceway on Friday night June 27, 2025.
If you read the "symptom" above you know that Super Chapter was the morning line favorite over his stable mate -- two-year-old champion Maryland -- in the Friday June 13 (2025) race.
If you didn't catch that race, Super Chapter reeled off a 1:50 4/5 Empire Breeders Classic win at Vernon Downs that night over his fancy stable mate Maryland to improve his 2025 record to two-for-two.
In that race Super Chapter went wire to wire in 1:50 4/5, just one-fifth off all-age track record.
Yes, that is right: 1/5 off the track record.
THAT WILL CATCH MY ATTENTION QUICKLY!!!
He did it against last year's (2024) two-year-old champion Maryland while beating his fancy stable mate almost by two lengths with Hard Seven in a further distance third in a small field of five.
SPEAKING OF TRACK RECORD, ANOTHER HAMBLETONIAN-BOUND DID JUST THAT!
Emoticon Legacy absolutely crushed his foes by more than three lengths in the Goodtimes at Woodbine Mohawk Park (June 14, 2025) in a Canadian record 1:50 2/5, a mark he now shares with three older horses – Alrajah One It, Atlanta and Gaines Hanover.
At the end of the mile he was clearly pulling away from a good horse Gap Kronos S (who runs this weekend against Go Dog Go).
Trainer Luc Blais after the Goodtimes win: "I know he has lots of speed. He just has to control his emotions."
Emoticon Legacy is scheduled to run next in the Zweig on July 3 (2025) at Vernon Downs (NY), running against -- who else? -- last year's (2024) two-year-old champion Maryland.
DID I SAY I AM HAVING A FEVER?
OH, BOY! -- DO I EVER?
THE WEEKEND COULDN'T COME SOON ENOUGH!
THE JULY 3RD COULDN'T COME SOON ENOUGH!
THAT IS NOT TO SAY AUGUST 2!
HOW AM I GOING TO SURVIVE UNTIL AUGUST 2?
UNTIL THEN IT IS GOING TO BE A VERY VERY EXTRA EXTRA FULL BLOWN FEVER!
OH, MY!!!
DID I SAY THAT I'M A HORSE RACING JUNKIE?
MEANWHILE THE FEVER RAGES ON!
Also scheduled to join Emoticon Legacy in running against last year's (2024) two-year-old champion Maryland are Monserrate, Hidalgo, and Onajetplane -- all are Hambletonian-bound.
AS I STATED ABOVE THAT ... ANY HORSE ... CAME CLOSE TO OR BREAKING A TRACK RECORD WILL CATCH MY ATTENTION QUICKLY!!!
OH, BOY! -- DOES IT EVER?
Emoticon Legacy absolutely catches my attention big time!
He tied a Canadian track record of 1:50 2/5, a mark he now shares with three older horses -- yes, this 3yo is now in the company of his elders.
That says a lot!
If you follow me all along this past spring about the Kentucky Derby trail, in which, I swore my Derby horse allegiance to Cornucopian [as my Derby horse].
And then, all of a sudden, a horse named American Promise broke a track record winning the Virginia Derby and I quickly switched my Derby horse allegiance prospect from Cornucopian to American Promise.
The same thing happens here: I just switched my Hambletonian horse allegiance prospect from Maryland to Emoticon Legacy after he tied the Canadian track record of 1:50 2/5.
IT'S A NO-BRAINER!!!
So from now on, I swear my Hambletonian horse allegiance prospect to Emoticon Legacy.
MARK YOUR CALENDAR: July 3 (2025) at Vernon Downs (NY).
I CAN'T WAIT!!!
MEANWHILE, ENJOY FRIDAY NIGHT AND SATURDAY NIGHT OF HARNESS RACING THIS WEEKEND, EVERYBODY!
1 week ago
Paul Tuon
2 weeks ago
LADY CANTERBURY EXCITEMENT SPECIAL!
EXCITEMENT IS IN THE AIR AS THE LADY CANTERBURY STAKES DAY IS HERE!
On this special day, the Lady Canterbury Stakes day, I will attempt to take a stab at the Lady Canterbury race itself and give you the winner of the race.
For the rest of the Canterbury card, I strongly encourage you all to follow our very own Angela Hermann -- she might give you winners meanwhile.
I also urge you all to support horse racing by betting Canterbury races through your simulcast signal at your racetrack.
Betting Canterbury races whenever you can means supporting horse racing in general -- and at the same time you may even get some enjoyment out of it.
On this special day, or on any other days for that matter, please bet on Canterbury races per Angela Hermann as your guide.
As stated above, I will only give you one winner on the entire card of the Lady Canterbury day as I'm not a specialized Canterbury horse handicapper. Hopeless not! -- Angela Hermann is your specialized Canterbury horse handicapper.
So by all means, follow her and play Canterbury races as much as you can.
The best way to play the races on this Lady Canterbury day is to use a parlay betting strategy.
However, since I'm not a specialized Canterbury horse handicapper, I could only find one winner on the entire Lady Canterbury card, and as such, I will have to find winners from other racetracks to include in the parlay scheme.
This is not a problem when using parlay betting strategy as it states that you can use races from any racetrack(s) available to you.
In other words, the parlay play doesn't have to come from the same single racetrack.
With that said, here is the Lady Canterbury Parlay Special:
1st leg:
1 1/8 Miles
The Lady Jacqueline Stakes
Fillies & Mares 3 Year Olds And Up
STAKES Purse: $250,000
Date: Saturday June 21, 2025
Track: Thistledown
Race: 11
Surface: dirt
Horse: Where's My Ring (ML 2-1 favorite)
Bet Where's My Ring to win.
2nd leg:
1 1/8 Miles
The Ohio Derby (Grade III)
3 Year Olds
STAKES Purse: $500,000
Date: Saturday June 21, 2025
Track: Thistledown
Race: 12
Surface: dirt
Horse: Clever Again (ML 9-5 favorite)
Bet Clever Again to win.
3rd leg:
1 Mile
The Lady Canterbuy Stakes
Fillies & Mares 3 Year Olds And Up
STAKES Purse: $75,000
Date: Saturday June 21, 2025
Track: Canterbury Park
Race: 5
Surface: turf
Horse: Cupids Crush (ML 5-2 favorite)
Bet Cupids Crush (ML 5-2) to win and put all of the accumulated money on Cupids Crush to win because she is going to win the Lady Canterbuy Stakes this Saturday June 21, 2025.
Cupids Crush's post time odd is likely to be 3/5 or lower (in my opinion) despite a 5/2 morning line odd.
Hey, a win is a win instead of chasing some longshots in hope of a big payoff as most horseplayers often do to no avail.
Take the easy money!
I will say this:
This is the easiest money you'll ever going to get on the Lady Canterbury card or on any other cards on Saturday June 21, 2025.
THANK YOU VERY MUCH FOR PLAYING CANTERBURY RACES!
ENJOY CANTERBURY RACES EVERYBODY!
EXCITEMENT IS IN THE AIR AS THE LADY CANTERBURY STAKES DAY IS HERE!
On this special day, the Lady Canterbury Stakes day, I will attempt to take a stab at the Lady Canterbury race itself and give you the winner of the race.
For the rest of the Canterbury card, I strongly encourage you all to follow our very own Angela Hermann -- she might give you winners meanwhile.
I also urge you all to support horse racing by betting Canterbury races through your simulcast signal at your racetrack.
Betting Canterbury races whenever you can means supporting horse racing in general -- and at the same time you may even get some enjoyment out of it.
On this special day, or on any other days for that matter, please bet on Canterbury races per Angela Hermann as your guide.
As stated above, I will only give you one winner on the entire card of the Lady Canterbury day as I'm not a specialized Canterbury horse handicapper. Hopeless not! -- Angela Hermann is your specialized Canterbury horse handicapper.
So by all means, follow her and play Canterbury races as much as you can.
The best way to play the races on this Lady Canterbury day is to use a parlay betting strategy.
However, since I'm not a specialized Canterbury horse handicapper, I could only find one winner on the entire Lady Canterbury card, and as such, I will have to find winners from other racetracks to include in the parlay scheme.
This is not a problem when using parlay betting strategy as it states that you can use races from any racetrack(s) available to you.
In other words, the parlay play doesn't have to come from the same single racetrack.
With that said, here is the Lady Canterbury Parlay Special:
1st leg:
1 1/8 Miles
The Lady Jacqueline Stakes
Fillies & Mares 3 Year Olds And Up
STAKES Purse: $250,000
Date: Saturday June 21, 2025
Track: Thistledown
Race: 11
Surface: dirt
Horse: Where's My Ring (ML 2-1 favorite)
Bet Where's My Ring to win.
2nd leg:
1 1/8 Miles
The Ohio Derby (Grade III)
3 Year Olds
STAKES Purse: $500,000
Date: Saturday June 21, 2025
Track: Thistledown
Race: 12
Surface: dirt
Horse: Clever Again (ML 9-5 favorite)
Bet Clever Again to win.
3rd leg:
1 Mile
The Lady Canterbuy Stakes
Fillies & Mares 3 Year Olds And Up
STAKES Purse: $75,000
Date: Saturday June 21, 2025
Track: Canterbury Park
Race: 5
Surface: turf
Horse: Cupids Crush (ML 5-2 favorite)
Bet Cupids Crush (ML 5-2) to win and put all of the accumulated money on Cupids Crush to win because she is going to win the Lady Canterbuy Stakes this Saturday June 21, 2025.
Cupids Crush's post time odd is likely to be 3/5 or lower (in my opinion) despite a 5/2 morning line odd.
Hey, a win is a win instead of chasing some longshots in hope of a big payoff as most horseplayers often do to no avail.
Take the easy money!
I will say this:
This is the easiest money you'll ever going to get on the Lady Canterbury card or on any other cards on Saturday June 21, 2025.
THANK YOU VERY MUCH FOR PLAYING CANTERBURY RACES!
ENJOY CANTERBURY RACES EVERYBODY!
2 weeks ago
Paul Tuon
2 weeks ago
I LOVE TWO-YEAR-OLDS: THEY'RE THE FUTURE!
I was and still am very excited about an expensive and well-bred 2yo colt making his debut race at Churchill Downs on Sunday June 1, 2025.
It was a 5-1/2-furlong race for 2yo colts on dirt and his name is Cannoneer (by Into Mischief - Catch the Moon, by Malibu Moon).
Cannoneer finished third as a 2-1 favorite in that debut race and from the look of it -- it was a good debut race despite not winning the race.
The future is bright for this 2yo colt and the sky is the limit.
He is trained by Brad Cox, and he costs $1,750,000 as a yearling.
His dam, Catch the Moon, produced FOUR graded stakes winners: Girvin, Midnight Bourbon, Cocked and Loaded, and Pirate's Punch.
AS EXCITED AS I WAS WITH CANNONEER I AM EVEN MORE EXCITED ABOUT THIS VERY EXPENSIVE TW0-YEAR-OLD COLT AS WELL!
I LOVE TWO-YEAR-OLDS: THEY'RE THE FUTURE!
At this year’s (2025) OBS March Two-Year-Olds in Training Sale, Amr Zedan's Zedan Racing went to a sale-topping $3 million to secure a gray or roan colt by Gun Runner out of the winning Liam's Map mare Tynan, a half-sister to graded stakes winners Pappacap and Boppy O.
According to Zedan, he revealed the colt had been named Brant in honor of the prominent eastern-based owner-breeder Peter Brant of White Birch Farm.
The record $3-Million OBS purchase named Brant is gearing up at Santa Anita for trainer Bob Baffert and should be ready for a debut race later this summer, if he progresses well enough.
Brant has been on a steady work regiment since mid-April for trainer Bob Baffert.
On Saturday June 14 (2025) at Santa Anita, the colt worked four furlongs in 49 seconds.
At the under-tack show prior to the sale, Brant blazed an eighth of a mile in 9.60 seconds to command top dollar.
He is out of the winning Liam's Map mare Tynan, a half-sister to graded stakes winners Pappacap and Boppy O.
Pappacap won the Best Pal (Gr II) in 2021, fourth in the Del Mar Futurity (Gr I) in 2021, 2nd in the American Pharoah and the Breeders' Cup Juvenile in 2021, fourth in the Florida Derby in 2022, second in both the Pat Day Mile and the Woody Stephens in 2022.
Works at Santa Anita:
Brant worked 4f, June 14th, in 49.00 (h) finishing 40/83
Brant worked 4f, June 9th, in 49.60 (h) finishing 45/69
Brant worked 4f, June 2nd, in 48.20 (h) finishing 15/54
Brant worked 5f, May 26th, in 1:01.40 (hg) finishing 11/18
Brant worked 3f, May 3rd, in 38.60 (h) finishing 19/22
Brant worked 3f, Apr 25th, in 37.20 (h) finishing 4/6
Brant worked 3f, Apr 18th, in 37.80 (h) finishing 7/8
Brant worked 2f, Apr 11th, in 24.20 (h) finishing 1/3
Brant worked 2f, Apr 4th, in 24.80 (h)
I'm very excited about this two-year-old and I can't wait to see him hitting the racetrack competing.
Stay tuned!
I was and still am very excited about an expensive and well-bred 2yo colt making his debut race at Churchill Downs on Sunday June 1, 2025.
It was a 5-1/2-furlong race for 2yo colts on dirt and his name is Cannoneer (by Into Mischief - Catch the Moon, by Malibu Moon).
Cannoneer finished third as a 2-1 favorite in that debut race and from the look of it -- it was a good debut race despite not winning the race.
The future is bright for this 2yo colt and the sky is the limit.
He is trained by Brad Cox, and he costs $1,750,000 as a yearling.
His dam, Catch the Moon, produced FOUR graded stakes winners: Girvin, Midnight Bourbon, Cocked and Loaded, and Pirate's Punch.
AS EXCITED AS I WAS WITH CANNONEER I AM EVEN MORE EXCITED ABOUT THIS VERY EXPENSIVE TW0-YEAR-OLD COLT AS WELL!
I LOVE TWO-YEAR-OLDS: THEY'RE THE FUTURE!
At this year’s (2025) OBS March Two-Year-Olds in Training Sale, Amr Zedan's Zedan Racing went to a sale-topping $3 million to secure a gray or roan colt by Gun Runner out of the winning Liam's Map mare Tynan, a half-sister to graded stakes winners Pappacap and Boppy O.
According to Zedan, he revealed the colt had been named Brant in honor of the prominent eastern-based owner-breeder Peter Brant of White Birch Farm.
The record $3-Million OBS purchase named Brant is gearing up at Santa Anita for trainer Bob Baffert and should be ready for a debut race later this summer, if he progresses well enough.
Brant has been on a steady work regiment since mid-April for trainer Bob Baffert.
On Saturday June 14 (2025) at Santa Anita, the colt worked four furlongs in 49 seconds.
At the under-tack show prior to the sale, Brant blazed an eighth of a mile in 9.60 seconds to command top dollar.
He is out of the winning Liam's Map mare Tynan, a half-sister to graded stakes winners Pappacap and Boppy O.
Pappacap won the Best Pal (Gr II) in 2021, fourth in the Del Mar Futurity (Gr I) in 2021, 2nd in the American Pharoah and the Breeders' Cup Juvenile in 2021, fourth in the Florida Derby in 2022, second in both the Pat Day Mile and the Woody Stephens in 2022.
Works at Santa Anita:
Brant worked 4f, June 14th, in 49.00 (h) finishing 40/83
Brant worked 4f, June 9th, in 49.60 (h) finishing 45/69
Brant worked 4f, June 2nd, in 48.20 (h) finishing 15/54
Brant worked 5f, May 26th, in 1:01.40 (hg) finishing 11/18
Brant worked 3f, May 3rd, in 38.60 (h) finishing 19/22
Brant worked 3f, Apr 25th, in 37.20 (h) finishing 4/6
Brant worked 3f, Apr 18th, in 37.80 (h) finishing 7/8
Brant worked 2f, Apr 11th, in 24.20 (h) finishing 1/3
Brant worked 2f, Apr 4th, in 24.80 (h)
I'm very excited about this two-year-old and I can't wait to see him hitting the racetrack competing.
Stay tuned!
2 weeks ago
Paul Tuon
2 weeks ago
THERAVADA'S JOURNEY: TAKE THREE RECAP!
DISAPPOINTING TENTH-PLACE FINISH!
High hopes and pent-up excitements on my part for Theravada's third-start of her young career came to a devastating disappointment -- not for her defeat but for the changing in her running style to be a closer.
ONE STEP FORWARD TEN STEPS BACKWARD -- VERY DISAPPOINTING PERFORMANCE BY THERAVADA!
Not only a ten-step backward but it is a puzzling performance as well and I was expecting to see her at least maintained her form -- if not improving on it.
The most startling and puzzling aspect of it is the way the race unfolded when -- surprisingly -- she was off evenly near the back of the field, third last of twelve, to be precise, about nine to ten lengths behind the early leaders.
We know she has speed, particularly gate and early speed as she'd shown in her second race, but for whatever the reason, in this race, she showed no gate and early speed at all -- very disappointing to see her not utilizing her abundance of gate and early speed.
My guess is that her trainer changed her running style to be like her mom's running style to be a one-dimension, one-run stretch running horse -- that is my guess!
Why was she off evenly near the back of the field and third last of twelve?
The pace was not that quick [early on] for the one-mile race on turf with the first quarter of a mile in 23.54 seconds, half-mile in 48.0 seconds, six furlongs in 1:12.02, seven furlongs in 1:24.14, and finished one mile in 1:36.74.
Why was she near the back of the field with that kind of fractions?
I don't get it!
This tells me that her trainer changed her running style to be a one-dimension, one-run stretch runner.
That is a very bad idea to change her running style to be like her mom's running style.
I don't like that approach at all!
I like her second race's running style a lot better, because as all horse racing fans know -- speed kills -- and Theravada has abundance of speed.
Now it seems that her trainer changed her running style to be a one-run closer like her mom -- and I don't like it one bit!
Speed is her greatest asset [beside her stamina], and speed combines with stamina [through her breeding], it's a recipe for success.
Why not utilize her speed?
I don't get it!
Why not train her to be a "push button" horse?
In other words, why not train her to be a stalker instead of a one-dimension, one-run closer?
I don't get it!
Her mom never had this kind of gate and early speed and most of her races were compromised by the pace upfront and she struggled mightily to close on horses that were leaders or close to the pace.
She would always made a one-sustain run on horses but usually came up short due to the pace upfront being not fast enough for her to close on them.
To see the trainer changed Theravada's running style to be like her mom's running style is very disappointing.
After her second race I was very excited about Theravada's future due to the fact that she had abundance of gate and early speed, and now my excitement is tamed quiet a lot, if not downright disappointing.
I was hoping that her connections realizing what a great asset she has in her gate and early speed and utilizing it accordingly to their advantage.
Now I'm not so sure they realize what a huge mistake it was to not utilize her speed asset.
Still, it's not too late to revert her running style back to her second race, but it has to be sooner rather than later before she accustoms and turns into a one-dimension, one-run stretch running horse.
IT HAS TO BE SOONER RATHER THAN LATER BEFORE SHE ACCUSTOMS AND TURNS INTO A ONE-DIMENSION, ONE-RUN STRETCH RUNNING HORSE!
If she accustomed and turned into a one-dimension, one-run stretch running horse, she cannot be easily turned into a speed horse, especially as she grows older and older -- that is a fact!
She is three-year-old and window of opportunity to revert her back to speed is closing every single day as she gets older and older.
I hope her connections realize that -- but I wouldn't hold my breath for her connections to realize that.
I think they are thinking that if her mom can win multiple graded stakes races with a one-dimension, one-run stretch running style, Theravada can do the same.
That is a mis-guided thinking, in my opinion.
I am very disappointing that her connections seem to feel that way, and as such, in my opinion, Theravada's future is bleak -- not a lot to look forward to!
It is fair to say that I'm not as excited nor looking forward to see her run as was after her second race.
My enthusiasm is now very tamed!
As any horse racing fan knows that a big and tall horse with a distance pedigree (like Theravada) who has abundance of speed is a dangerous horse to his/her competitors.
Case in point is East Avenue who is a big and tall horse with abundance of speed (combines with distance pedigree) and he utilized his speed to win the Keeneland Futurity in 2024 as a 2yo, beating a stellar group of 2yos.
I am not telling you anything new here, it is a universally well-understood horse racing paradym that a big and tall horse with a distance pedigree who also has abundance of speed is a "weapon" ready to fire [or a force to be reckoned with] -- and is a dangerous horse to his/her competitors.
It is the law of Physics that the bigger, taller you are the harder and slower you are to get going -- it's a true fact!
If you drive an SUV vehicle you know that it takes a while to get going, i.e., to go from zero to sixty speed readings; however, it doesn't take as long to go from zero to sixty speed readings if you drive a sedan vehicle.
This is the law of Physics at work!
The law of Physics applies to horses as well, horses like Theravada and East Avenue who are big and tall and both have speed combined with distance pedigree.
To make these horses to not utilize their deadly "weapon" or speed (like Theravada's trainer did) is just a mis-guided understanding of the law of Physics.
Leading up to last year's Breeders' Cup (2024), you may recall Marcus Hersh of the DRF writing articles about East Avenue's combination of size, height, speed, and stamina -- a rare combination that makes East Avenue a horse to beat in the Breeders' Cup Juvenile 2024.
Leading up to East Avenue's 3yo debut race in the Risen Star Stakes (2025), Marcus Hersh, again, pointed out in his article that East Avenue's combination of size, height, speed, and stamina, making East Avenue a force to be reckoned with in that race.
And sure enough, East Avenue exploded right out of the gate the fastest of twelve runners to set the pace but Magnitude had other idea when he sprinted quickly from post position 12 to take over the pace setting from East Avenue when they crossed the wire for the first time, and Magnitude continued to set the pace to win that race as a 43-1 longshot.
The winning time of 1:48.85 for the 1 1/8 mile race is the fastest time since the distance was extended in 2020.
As for East Avenue, he defied the law of Physics by showing abundance of speed and agility to almost setting the pace but relegated to chasing a smaller rival all the way to the top of the stretch and tired.
It was his first race since the Breeders' Cup Juvenile 2024 race.
Marcus Hersh didn't tell us anything new, either -- it was a universally well-understood horse racing paradym that all of horse racing fans knew all about since the existence of horse racing.
Whether they read Marcus Hersh's articles or not, they sent East Avenue off as the 2-1 post time favorite in the Breeders' Cup Juvenile race 2024.
Likewise, they sent East Avenue off as the 8-5 post time favorite in the Risen Star Stakes 2025 as well.
My point is, all horse racing fans, including trainers, know that a big and tall horse with a distance pedigree who also has abundance of speed is a "weapon" ready to fire [or a force to be reckoned with] -- and is a dangerous horse to his/her competitors.
So Theravada's connections should also know this universally well-understood horse racing paradym.
Or do they?
I hope they do -- but I wouldn't hold my breath on that either.
Looking at the totality of Theravada's race, it was a very good race containing a full field of tough group of twelve runners after a horse in post position six got scratched -- and therefore, moving Theravada one slot better to post position eleven while also drawing in a horse from the "also eligible" list horses into the race.
This race is a race for maiden special weight fillies and mares 3yo and up; however, it is only one 4yo Hello Beauty and the rest are mainly 3yo fillies.
Theravada was sent off as a 9-1 longshot behind the 3-1 post time favorite Mo Expectations (post 6) and the little over 3-1 second choice Hello Beauty (post 1) and the 4-1 third choice Bembridge Ledge (post 8), the winner of the race.
Running Game (post 2) finished second at 5-1 fourth choice in the betting, Hello Beauty finished third, while Mo Expectations, the race's favorite, finished fourth.
Theravada finished ten of 12, beaten about fifteen to eighteen lengths by Bembridge Ledge.
That is a massive defeat considering in her second race she was seventh, beaten nine and one-quarter lengths after dueling fast fractions and she was still leading inside the eight pole [in that race].
I attribute to her massive defeat in this race due to in particular in the changing of her running style, and perhaps, her competition played a role as well.
This race seems a little tougher than her previous two races but well within her ability as it should be.
In other words, she belongs with this group of tough horses and it will serve her well into the future, albeit not a very exciting one.
This is a case of one step forward ten steps backward and you are never going to get anywhere.
That is how I feel after seeing this race.
With that said, we should take some solace knowing that this race is full of future stars potential, although I have to admit that Theravada is at the very bottom of that list if the trend takes its course.
One such star potential is Mo Expectations by Uncle Mo and she is out of a Bernardini mare Havisham, making Mo Expectations a half-sister to Kentucky Oaks winner Serengeti Empress.
Mo Expectations is trained by Brad Cox.
Mo Expectations was sent off as the 3-1 favorite and finished fourth, beaten 3 3/4 lengths without any apparent excuse.
As stated earlier, the pace was not that quick [early on] for the one-mile race on turf with the first quarter of a mile in 23.54 seconds, half-mile in 48.0 seconds, six furlongs in 1:12.02, seven furlongs in 1:24.14, and finished one mile in 1:36.74.
The track record for the mile distance on turf listed as 1:32.88.
So this race was run almost four seconds slower than the track record -- however, it is an average running time for a group of this caliber of maiden special weight fillies and mares 3yo and up.
To put into more perspective, consider a race that was run two hours earlier in race four for the same one-mile distance also on turf but for a much higher and tougher condition and tougher group of horses as well.
This race is for three-level allowance, [optional claiming price $125k], purses $134k, for fillies 3yos.
This race was run somewhat slower than Theravada's race with the first quarter of a mile in 24.32 seconds, half-mile in 49.0 seconds, six furlongs in 1:13.49, seven furlongs in 1:25.14, and finished one mile in 1:37.00 -- comparatively very slow considering that these horses are stakes horses who had competed in stakes races and most of them have very good running lines.
There are tough group of seven 3yo fillies in that race but the race produced slower fractional and final times than Theravada's race.
Case in point, the 5/2 second choice in that race, a horse named Admit ran in the Ashland Stakes (Gr I) at Keeneland April 2025.
Before that race, Admit was third in the Bourbonette Oaks Stakes, a Kentucky Oaks prep race being run at Turfway Park in March 2025.
Prior to that race, Admit finished second in the Cincinati Trophy Breeders Stakes at Turfway Park in February 2025.
Another horse named Just Ruthless also ran against Admit in both the Bourbonette Oaks Stakes and the Cincinati Trophy Breeders Stakes, however, Just Ruthless didn't do as well as Admit in both of those races.
The point is, both of these two horses are good stakes horses.
One more horse named Zealous Moon also ran against Admit and Just Ruthless in the Bourbonette Oaks Stakes at Turfway Park in March 2025.
Just Ruthless had some successes with good running lines on races at Churchill Downs prior to the meeting with Admit at Turfway Park.
As a matter of fact, after breaking her maiden by six lengths on November 10 (2024), Just Ruthless battled a very fast 2yo filly named Book'Em on November 30 (2024) on the card known as the "Future Stars of Tomorrow".
Book'Em ran that mile race in 1:34.17 while earning a whopping Beyer of 94 -- the highest number for a 2yo filly at that time.
Sadly, the following year in February (2025), Book'Em broke down while training and she was euthanized as a result of the severe fracture to her leg.
As for Just Ruthless, she battled Book'Em head-to-head from start to deep stretch when she got tired to finish fifth, beaten 14 1/2 lengths by Book'Em.
Another horse named Mean Eileen finished fourth, beaten 2 1/2 lengths in the $1 million Juvenile Fillies at Kentucky Downs in September 2024.
To top it all off, a highly regarded $130k OBSMAR24 purchase 3yo filly trained by Steve Assmusen named Mila Rose who just competed in the Miss Preakness Stakes on Preakness under card four weeks ago.
She finished fifth in that tough race -- not bad!
The point is, this race is full of good 3yo fillies with future stars potential.
However, this race produced slower fractional and final times than the race Theravada ran -- albeit Theravada was not a factor in making those times.
Still, you would think that this race should produced faster times than the one Theravada was in.
The thing to take away for future handicapping purposes, Theravada not withstanding, is to judge the horses in the race that Theravada was in with positive and favorable weight than those horses in this third-level allowance race.
In other words, put more weight in horses like Mo Expectations when she runs next time because she helped produced her race to be faster than the third-level allowance race.
Well, sort of in the mix of helping -- but you get the idea!
Personally, I think Mo Expectations is a future star in the making with that impeccable breeding.
DISAPPOINTING TENTH-PLACE FINISH!
High hopes and pent-up excitements on my part for Theravada's third-start of her young career came to a devastating disappointment -- not for her defeat but for the changing in her running style to be a closer.
ONE STEP FORWARD TEN STEPS BACKWARD -- VERY DISAPPOINTING PERFORMANCE BY THERAVADA!
Not only a ten-step backward but it is a puzzling performance as well and I was expecting to see her at least maintained her form -- if not improving on it.
The most startling and puzzling aspect of it is the way the race unfolded when -- surprisingly -- she was off evenly near the back of the field, third last of twelve, to be precise, about nine to ten lengths behind the early leaders.
We know she has speed, particularly gate and early speed as she'd shown in her second race, but for whatever the reason, in this race, she showed no gate and early speed at all -- very disappointing to see her not utilizing her abundance of gate and early speed.
My guess is that her trainer changed her running style to be like her mom's running style to be a one-dimension, one-run stretch running horse -- that is my guess!
Why was she off evenly near the back of the field and third last of twelve?
The pace was not that quick [early on] for the one-mile race on turf with the first quarter of a mile in 23.54 seconds, half-mile in 48.0 seconds, six furlongs in 1:12.02, seven furlongs in 1:24.14, and finished one mile in 1:36.74.
Why was she near the back of the field with that kind of fractions?
I don't get it!
This tells me that her trainer changed her running style to be a one-dimension, one-run stretch runner.
That is a very bad idea to change her running style to be like her mom's running style.
I don't like that approach at all!
I like her second race's running style a lot better, because as all horse racing fans know -- speed kills -- and Theravada has abundance of speed.
Now it seems that her trainer changed her running style to be a one-run closer like her mom -- and I don't like it one bit!
Speed is her greatest asset [beside her stamina], and speed combines with stamina [through her breeding], it's a recipe for success.
Why not utilize her speed?
I don't get it!
Why not train her to be a "push button" horse?
In other words, why not train her to be a stalker instead of a one-dimension, one-run closer?
I don't get it!
Her mom never had this kind of gate and early speed and most of her races were compromised by the pace upfront and she struggled mightily to close on horses that were leaders or close to the pace.
She would always made a one-sustain run on horses but usually came up short due to the pace upfront being not fast enough for her to close on them.
To see the trainer changed Theravada's running style to be like her mom's running style is very disappointing.
After her second race I was very excited about Theravada's future due to the fact that she had abundance of gate and early speed, and now my excitement is tamed quiet a lot, if not downright disappointing.
I was hoping that her connections realizing what a great asset she has in her gate and early speed and utilizing it accordingly to their advantage.
Now I'm not so sure they realize what a huge mistake it was to not utilize her speed asset.
Still, it's not too late to revert her running style back to her second race, but it has to be sooner rather than later before she accustoms and turns into a one-dimension, one-run stretch running horse.
IT HAS TO BE SOONER RATHER THAN LATER BEFORE SHE ACCUSTOMS AND TURNS INTO A ONE-DIMENSION, ONE-RUN STRETCH RUNNING HORSE!
If she accustomed and turned into a one-dimension, one-run stretch running horse, she cannot be easily turned into a speed horse, especially as she grows older and older -- that is a fact!
She is three-year-old and window of opportunity to revert her back to speed is closing every single day as she gets older and older.
I hope her connections realize that -- but I wouldn't hold my breath for her connections to realize that.
I think they are thinking that if her mom can win multiple graded stakes races with a one-dimension, one-run stretch running style, Theravada can do the same.
That is a mis-guided thinking, in my opinion.
I am very disappointing that her connections seem to feel that way, and as such, in my opinion, Theravada's future is bleak -- not a lot to look forward to!
It is fair to say that I'm not as excited nor looking forward to see her run as was after her second race.
My enthusiasm is now very tamed!
As any horse racing fan knows that a big and tall horse with a distance pedigree (like Theravada) who has abundance of speed is a dangerous horse to his/her competitors.
Case in point is East Avenue who is a big and tall horse with abundance of speed (combines with distance pedigree) and he utilized his speed to win the Keeneland Futurity in 2024 as a 2yo, beating a stellar group of 2yos.
I am not telling you anything new here, it is a universally well-understood horse racing paradym that a big and tall horse with a distance pedigree who also has abundance of speed is a "weapon" ready to fire [or a force to be reckoned with] -- and is a dangerous horse to his/her competitors.
It is the law of Physics that the bigger, taller you are the harder and slower you are to get going -- it's a true fact!
If you drive an SUV vehicle you know that it takes a while to get going, i.e., to go from zero to sixty speed readings; however, it doesn't take as long to go from zero to sixty speed readings if you drive a sedan vehicle.
This is the law of Physics at work!
The law of Physics applies to horses as well, horses like Theravada and East Avenue who are big and tall and both have speed combined with distance pedigree.
To make these horses to not utilize their deadly "weapon" or speed (like Theravada's trainer did) is just a mis-guided understanding of the law of Physics.
Leading up to last year's Breeders' Cup (2024), you may recall Marcus Hersh of the DRF writing articles about East Avenue's combination of size, height, speed, and stamina -- a rare combination that makes East Avenue a horse to beat in the Breeders' Cup Juvenile 2024.
Leading up to East Avenue's 3yo debut race in the Risen Star Stakes (2025), Marcus Hersh, again, pointed out in his article that East Avenue's combination of size, height, speed, and stamina, making East Avenue a force to be reckoned with in that race.
And sure enough, East Avenue exploded right out of the gate the fastest of twelve runners to set the pace but Magnitude had other idea when he sprinted quickly from post position 12 to take over the pace setting from East Avenue when they crossed the wire for the first time, and Magnitude continued to set the pace to win that race as a 43-1 longshot.
The winning time of 1:48.85 for the 1 1/8 mile race is the fastest time since the distance was extended in 2020.
As for East Avenue, he defied the law of Physics by showing abundance of speed and agility to almost setting the pace but relegated to chasing a smaller rival all the way to the top of the stretch and tired.
It was his first race since the Breeders' Cup Juvenile 2024 race.
Marcus Hersh didn't tell us anything new, either -- it was a universally well-understood horse racing paradym that all of horse racing fans knew all about since the existence of horse racing.
Whether they read Marcus Hersh's articles or not, they sent East Avenue off as the 2-1 post time favorite in the Breeders' Cup Juvenile race 2024.
Likewise, they sent East Avenue off as the 8-5 post time favorite in the Risen Star Stakes 2025 as well.
My point is, all horse racing fans, including trainers, know that a big and tall horse with a distance pedigree who also has abundance of speed is a "weapon" ready to fire [or a force to be reckoned with] -- and is a dangerous horse to his/her competitors.
So Theravada's connections should also know this universally well-understood horse racing paradym.
Or do they?
I hope they do -- but I wouldn't hold my breath on that either.
Looking at the totality of Theravada's race, it was a very good race containing a full field of tough group of twelve runners after a horse in post position six got scratched -- and therefore, moving Theravada one slot better to post position eleven while also drawing in a horse from the "also eligible" list horses into the race.
This race is a race for maiden special weight fillies and mares 3yo and up; however, it is only one 4yo Hello Beauty and the rest are mainly 3yo fillies.
Theravada was sent off as a 9-1 longshot behind the 3-1 post time favorite Mo Expectations (post 6) and the little over 3-1 second choice Hello Beauty (post 1) and the 4-1 third choice Bembridge Ledge (post 8), the winner of the race.
Running Game (post 2) finished second at 5-1 fourth choice in the betting, Hello Beauty finished third, while Mo Expectations, the race's favorite, finished fourth.
Theravada finished ten of 12, beaten about fifteen to eighteen lengths by Bembridge Ledge.
That is a massive defeat considering in her second race she was seventh, beaten nine and one-quarter lengths after dueling fast fractions and she was still leading inside the eight pole [in that race].
I attribute to her massive defeat in this race due to in particular in the changing of her running style, and perhaps, her competition played a role as well.
This race seems a little tougher than her previous two races but well within her ability as it should be.
In other words, she belongs with this group of tough horses and it will serve her well into the future, albeit not a very exciting one.
This is a case of one step forward ten steps backward and you are never going to get anywhere.
That is how I feel after seeing this race.
With that said, we should take some solace knowing that this race is full of future stars potential, although I have to admit that Theravada is at the very bottom of that list if the trend takes its course.
One such star potential is Mo Expectations by Uncle Mo and she is out of a Bernardini mare Havisham, making Mo Expectations a half-sister to Kentucky Oaks winner Serengeti Empress.
Mo Expectations is trained by Brad Cox.
Mo Expectations was sent off as the 3-1 favorite and finished fourth, beaten 3 3/4 lengths without any apparent excuse.
As stated earlier, the pace was not that quick [early on] for the one-mile race on turf with the first quarter of a mile in 23.54 seconds, half-mile in 48.0 seconds, six furlongs in 1:12.02, seven furlongs in 1:24.14, and finished one mile in 1:36.74.
The track record for the mile distance on turf listed as 1:32.88.
So this race was run almost four seconds slower than the track record -- however, it is an average running time for a group of this caliber of maiden special weight fillies and mares 3yo and up.
To put into more perspective, consider a race that was run two hours earlier in race four for the same one-mile distance also on turf but for a much higher and tougher condition and tougher group of horses as well.
This race is for three-level allowance, [optional claiming price $125k], purses $134k, for fillies 3yos.
This race was run somewhat slower than Theravada's race with the first quarter of a mile in 24.32 seconds, half-mile in 49.0 seconds, six furlongs in 1:13.49, seven furlongs in 1:25.14, and finished one mile in 1:37.00 -- comparatively very slow considering that these horses are stakes horses who had competed in stakes races and most of them have very good running lines.
There are tough group of seven 3yo fillies in that race but the race produced slower fractional and final times than Theravada's race.
Case in point, the 5/2 second choice in that race, a horse named Admit ran in the Ashland Stakes (Gr I) at Keeneland April 2025.
Before that race, Admit was third in the Bourbonette Oaks Stakes, a Kentucky Oaks prep race being run at Turfway Park in March 2025.
Prior to that race, Admit finished second in the Cincinati Trophy Breeders Stakes at Turfway Park in February 2025.
Another horse named Just Ruthless also ran against Admit in both the Bourbonette Oaks Stakes and the Cincinati Trophy Breeders Stakes, however, Just Ruthless didn't do as well as Admit in both of those races.
The point is, both of these two horses are good stakes horses.
One more horse named Zealous Moon also ran against Admit and Just Ruthless in the Bourbonette Oaks Stakes at Turfway Park in March 2025.
Just Ruthless had some successes with good running lines on races at Churchill Downs prior to the meeting with Admit at Turfway Park.
As a matter of fact, after breaking her maiden by six lengths on November 10 (2024), Just Ruthless battled a very fast 2yo filly named Book'Em on November 30 (2024) on the card known as the "Future Stars of Tomorrow".
Book'Em ran that mile race in 1:34.17 while earning a whopping Beyer of 94 -- the highest number for a 2yo filly at that time.
Sadly, the following year in February (2025), Book'Em broke down while training and she was euthanized as a result of the severe fracture to her leg.
As for Just Ruthless, she battled Book'Em head-to-head from start to deep stretch when she got tired to finish fifth, beaten 14 1/2 lengths by Book'Em.
Another horse named Mean Eileen finished fourth, beaten 2 1/2 lengths in the $1 million Juvenile Fillies at Kentucky Downs in September 2024.
To top it all off, a highly regarded $130k OBSMAR24 purchase 3yo filly trained by Steve Assmusen named Mila Rose who just competed in the Miss Preakness Stakes on Preakness under card four weeks ago.
She finished fifth in that tough race -- not bad!
The point is, this race is full of good 3yo fillies with future stars potential.
However, this race produced slower fractional and final times than the race Theravada ran -- albeit Theravada was not a factor in making those times.
Still, you would think that this race should produced faster times than the one Theravada was in.
The thing to take away for future handicapping purposes, Theravada not withstanding, is to judge the horses in the race that Theravada was in with positive and favorable weight than those horses in this third-level allowance race.
In other words, put more weight in horses like Mo Expectations when she runs next time because she helped produced her race to be faster than the third-level allowance race.
Well, sort of in the mix of helping -- but you get the idea!
Personally, I think Mo Expectations is a future star in the making with that impeccable breeding.
2 weeks ago
Paul Tuon
3 weeks ago
HARNESS RACING: HAMBLETONIAN IMPLICATION!
MARYLAND VS SUPER CHAPTER
A field of 10 Hambletonian-eligible trotters will go behind the starting gate Friday (June 13, 2025) in the $225,000 New Jersey Sire Stakes championship for 3-year-old male trotters at The Meadowlands.
[Please check out The Meadowlands' entries for the Friday card.]
ENJOY FRIDAY NIGHT OF HARNESS RACING AT THE MEADOWLANDS EVERYBODY!
The lineup includes three of this season’s four fastest sophomore boys: Mr Walner Fashion, Mountcastle and Onajetplane.
The morning-line favorite, Mr Walner Fashion at 3-1, heads to the race 2-for-2 this year and is coming off a 1:51 2/5 score in a $25,000 second-round NJSS division June 6 (2025) at The Big M.
The mark is tied for the season’s best; Mountcastle also trotted 1:51 2/5 in his NJSS prelim later that same night. Both horses won by a head.
However, on the same day (Friday June 13) my eyes are on Maryland running against his stablemate Super Chapter at Vernon Downs (NY), race 8, in the EMPIRE BREEDERS CLASSIC Three-Year-Old Colts & Geldings.
A small field of five -- it looks to be a two-horse race between Maryland (ML 9-5) and his stablemate Super Chapter (ML 8-5) in what looks like a preview of the Hambletonian Civil War battle.
Super Chapter is the race's favorite (ML 8/5) and he has post position 3, while Maryland is the second choice and he will break from the outside post 5.
Advantage to Super Chapter in this race but he will have to earn it with Maryland in the same race.
Easy exacta!
MY PLAY OF THE NIGHT: HIGHLAND KISMET
Race 12 (The Meadowlands): $50K Graduate 2nd leg for 4YO Trotters
HIGHLAND KISMET has unlimited potential and Nancy Takter has been charged with trying to get the most out of him. The first qualifier two weeks ago seemed to be going along smoothly when he made what looked like a speed break to me -- HIGHLAND KISMET broke strides.
Nancy Takter, his trainer, said she thought maybe the miscue was because his hobbles were too tight.
So for this race I think she plans to correct the hobbles so they will be a little loose.
Bet HIGHLAND KISMET to win, place using double down!
ON THE SAME NIGHT [JUNE 14] AT WOODBINE MOHAWK THERE ARE STAKES RACES AND ONE IN PARTICULAR IS THE $1,000,000 NORTH AMERICA CUP
The Woodbine Mohawk race card is full of good betting races headlined by the North America Cup, race 11, in which, I like the 7/5 morning line favorite Louprint (post 4) in a full field of 10.
It's a $1 million race and a prep for the Meadowlands Pace (July 12) and as such anything can happen in a full field of 12.
Having said that, the likely winner is the 7/5 morning line favorite Louprint.
He is the best horse in the field and likely to go down in odd -- 4/5 or even money is my guess.
Also in the card, race 10, a cinch horse in Chantilly.
Bet Chantilly (ML 1-1) to win and put a lot of money on her because she is going to win this race at a very short price.
This is the easiest money you'll ever going to get on any card for this Saturday June 14, 2025.
Chantilly crowned Canada's Horse of the Year for 2024
Chantilly, the 2-Year-Old Pacing Filly of the Year (2024) was also named the Somebeachsomewhere Horse of the Year (2024).
She became just the fifth 2-year-old - and only the third pacing filly - to be named Canada's Horse of the Year, joining the likes of Emilie Cas El, Whenuwishuponastar, Somebeachsomewhere and JK She'salady.
Chantilly, Canada's reigning Horse of the Year, set a career best 1:49.4 mark while easily besting a field of 10 in the lone $140,000 Ontario Sires Stakes (OSS) Gold Series event for three-year-old pacing fillies on Saturday, May 24 (2025) at Woodbine Mohawk Park. It was the first OSS Gold event of 2025.
Millar Farms' homebred daughter of Big Jim out of Shiraz Seelster, who was sent off at 1/9, is now undefeated through all 11 career starts. It was her second pari-mutuel win of 2025 and pushed her career earnings to $897,756.
Starting from the rail, driver James MacDonald positioned Chantilly fourth in the early going. The pair took the lead with a strong brush before reaching the half in :55. They opened up on the field from there through the three-quarters in 1:21.4 and came home in :28 to win by 4-1/2 lengths over Wickedpace (Jody Jamieson) on a cold, windy night. Perfectly Chic (Bob McClure) was third.
"[Chantilly's] high gear is just something else, MacDonald told Woodbine Mohawk Park's Chad Rozema. "I was able to clear the lead pretty, pretty easily. And then she's just one of those horses -- and I've only driven a few of them in my life -- where you feel like you're absolutely crawling ...
You've got to be careful with her, because she's just got unbelievable speed.
"She's just a special horse. She's passed every test with flying colours. I would have liked to go :52 with the brakes on, but she's got other plans.
Sometimes when you put her in top gear she's just relentless with her speed. Hopefully, she keeps carrying on to bigger and better things.
Whether that means Chantilly will be entered against the boys in the $1 million Pepsi North America Cup or the Fan Hanover for sophomore fillies -- both have their finals on June 14 at Woodbine Mohawk Park -- will be up to her owner George Millar, said Chantilly's trainer Nick Gallucci.
"It's going to be George Millar's call, said Gallucci, indicating she'll get next week off. "We'll just see what happens, and I'm good with whatever decision he makes."
ENJOY SATURDAY NIGHT OF HARNESS RACING WITH LOTS OF STAKES RACES AT BOTH THE MEADOWLANDS AND WOODBINE MOHAWK
MEANWHILE ON SATURDAY JUNE 14 -- DON'T FORGET THERAVADA -- CD -- RACE 8
MARYLAND VS SUPER CHAPTER
A field of 10 Hambletonian-eligible trotters will go behind the starting gate Friday (June 13, 2025) in the $225,000 New Jersey Sire Stakes championship for 3-year-old male trotters at The Meadowlands.
[Please check out The Meadowlands' entries for the Friday card.]
ENJOY FRIDAY NIGHT OF HARNESS RACING AT THE MEADOWLANDS EVERYBODY!
The lineup includes three of this season’s four fastest sophomore boys: Mr Walner Fashion, Mountcastle and Onajetplane.
The morning-line favorite, Mr Walner Fashion at 3-1, heads to the race 2-for-2 this year and is coming off a 1:51 2/5 score in a $25,000 second-round NJSS division June 6 (2025) at The Big M.
The mark is tied for the season’s best; Mountcastle also trotted 1:51 2/5 in his NJSS prelim later that same night. Both horses won by a head.
However, on the same day (Friday June 13) my eyes are on Maryland running against his stablemate Super Chapter at Vernon Downs (NY), race 8, in the EMPIRE BREEDERS CLASSIC Three-Year-Old Colts & Geldings.
A small field of five -- it looks to be a two-horse race between Maryland (ML 9-5) and his stablemate Super Chapter (ML 8-5) in what looks like a preview of the Hambletonian Civil War battle.
Super Chapter is the race's favorite (ML 8/5) and he has post position 3, while Maryland is the second choice and he will break from the outside post 5.
Advantage to Super Chapter in this race but he will have to earn it with Maryland in the same race.
Easy exacta!
MY PLAY OF THE NIGHT: HIGHLAND KISMET
Race 12 (The Meadowlands): $50K Graduate 2nd leg for 4YO Trotters
HIGHLAND KISMET has unlimited potential and Nancy Takter has been charged with trying to get the most out of him. The first qualifier two weeks ago seemed to be going along smoothly when he made what looked like a speed break to me -- HIGHLAND KISMET broke strides.
Nancy Takter, his trainer, said she thought maybe the miscue was because his hobbles were too tight.
So for this race I think she plans to correct the hobbles so they will be a little loose.
Bet HIGHLAND KISMET to win, place using double down!
ON THE SAME NIGHT [JUNE 14] AT WOODBINE MOHAWK THERE ARE STAKES RACES AND ONE IN PARTICULAR IS THE $1,000,000 NORTH AMERICA CUP
The Woodbine Mohawk race card is full of good betting races headlined by the North America Cup, race 11, in which, I like the 7/5 morning line favorite Louprint (post 4) in a full field of 10.
It's a $1 million race and a prep for the Meadowlands Pace (July 12) and as such anything can happen in a full field of 12.
Having said that, the likely winner is the 7/5 morning line favorite Louprint.
He is the best horse in the field and likely to go down in odd -- 4/5 or even money is my guess.
Also in the card, race 10, a cinch horse in Chantilly.
Bet Chantilly (ML 1-1) to win and put a lot of money on her because she is going to win this race at a very short price.
This is the easiest money you'll ever going to get on any card for this Saturday June 14, 2025.
Chantilly crowned Canada's Horse of the Year for 2024
Chantilly, the 2-Year-Old Pacing Filly of the Year (2024) was also named the Somebeachsomewhere Horse of the Year (2024).
She became just the fifth 2-year-old - and only the third pacing filly - to be named Canada's Horse of the Year, joining the likes of Emilie Cas El, Whenuwishuponastar, Somebeachsomewhere and JK She'salady.
Chantilly, Canada's reigning Horse of the Year, set a career best 1:49.4 mark while easily besting a field of 10 in the lone $140,000 Ontario Sires Stakes (OSS) Gold Series event for three-year-old pacing fillies on Saturday, May 24 (2025) at Woodbine Mohawk Park. It was the first OSS Gold event of 2025.
Millar Farms' homebred daughter of Big Jim out of Shiraz Seelster, who was sent off at 1/9, is now undefeated through all 11 career starts. It was her second pari-mutuel win of 2025 and pushed her career earnings to $897,756.
Starting from the rail, driver James MacDonald positioned Chantilly fourth in the early going. The pair took the lead with a strong brush before reaching the half in :55. They opened up on the field from there through the three-quarters in 1:21.4 and came home in :28 to win by 4-1/2 lengths over Wickedpace (Jody Jamieson) on a cold, windy night. Perfectly Chic (Bob McClure) was third.
"[Chantilly's] high gear is just something else, MacDonald told Woodbine Mohawk Park's Chad Rozema. "I was able to clear the lead pretty, pretty easily. And then she's just one of those horses -- and I've only driven a few of them in my life -- where you feel like you're absolutely crawling ...
You've got to be careful with her, because she's just got unbelievable speed.
"She's just a special horse. She's passed every test with flying colours. I would have liked to go :52 with the brakes on, but she's got other plans.
Sometimes when you put her in top gear she's just relentless with her speed. Hopefully, she keeps carrying on to bigger and better things.
Whether that means Chantilly will be entered against the boys in the $1 million Pepsi North America Cup or the Fan Hanover for sophomore fillies -- both have their finals on June 14 at Woodbine Mohawk Park -- will be up to her owner George Millar, said Chantilly's trainer Nick Gallucci.
"It's going to be George Millar's call, said Gallucci, indicating she'll get next week off. "We'll just see what happens, and I'm good with whatever decision he makes."
ENJOY SATURDAY NIGHT OF HARNESS RACING WITH LOTS OF STAKES RACES AT BOTH THE MEADOWLANDS AND WOODBINE MOHAWK
MEANWHILE ON SATURDAY JUNE 14 -- DON'T FORGET THERAVADA -- CD -- RACE 8
3 weeks ago
Paul Tuon
3 weeks ago
THERAVADA'S JOURNEY: TAKE THREE!
SENTIMENTAL FAVORITE THERAVADA IS ENTERED SATURDAY JUNE 14, 2025
Sentimental favorite Theravada is entered to run in a 1-mile turf race for Fillies and Mares 3 Year Olds-And-Up MAIDEN SPECIAL WEIGHT Purse: $120,000 at Churchill Downs on Saturday June 14, 2025 (race 8).
Theravada makes her third career start for trainer Rusty Arnold. Theravada is a 3-year-old Tapit filly is out of Grade 2 winner Cambodia, who earned $859,000 with four graded-stakes wins.
In her most recent start on April 12 (2025) at Keeneland [in a 1 1/16 miles turf race for 3-Year-Old Fillies], she finished seventh, beaten 9 1/4 lengths.
[Check out my detail description on this thread about 15 or 16 posts down titled: "THERAVADA JOURNEY: THE TRAIL OF SENTIMENTAL FAVORITE THERAVADA !", describing the reasons she lost that race]
She was bred by her owners Don Robinson and Allen Schubert of Winter Quarter Farm.
She'll be ridden by Brian Hernandez Jr in this 1-mile turf maiden special weight race in an overflow field of 16 horses, but it is limited to just 12 runners.
Theravada is a 5-1 morning line third choice behind the Jack Sisterson-trained 7-2 favorite Hello Beauty and Joe Sharp-trained 4-1 second choice Running Game.
Bet Theravada (ML 5-1) to win, place, show using double down betting strategy -- however, personally, I will only bet her to win.
With that said, I think she will win this race and I'm planning on gluing my eyes on the TV set the whole time the race is on.
BRING IT ON!!!
I'M VERY EXCITED FOR THIS SATURDAY AND I CAN'T WAIT UNTIL THEN!
BRING IT ON!!!
Looking at the field, without having a chance to examine every horse in the race, I see one horse (beside Theravada) stands out among a good group of horses.
That horse is Mo Expectations (ML 8-1), a 3-year-old filly trained by Brad Cox.
Mo Expectations is by Uncle Mo and is out of an extraordinary family credential through her Grade 1-winning half-sister Serengeti Empress.
Yes, that is correct: Mo Expectations is a half-sister to Serengeti Empress.
That champion filly Serengeti Empress earned over two million dollars and captured multiple graded-stakes, including the Kentucky Oaks (G1), establishing this as one of racing's premier female families.
The Saturday Churchill Downs debut race for this impeccably bred filly suggests connections view this as a significant unveiling, and Uncle Mo's record with fillies adds another positive element to an already compelling pedigree package.
As for Theravada, she never get a break from a post position standpoint as last week she was drawn post position 15 [and did not get in], and this week she is drawn post position 12 -- an outside post position as her previous two outings.
She never get a break -- what is up with that?
As far as the competition -- again a stellar group of horses, but I'm not complaining about her competition at all as I think she fits with these tough group of horses and it will serve her well into the future whether she wins this race or not.
She needs tough competition to be the best of the best of her generation, and so far, her competition was very tough in all of her races.
BRING IT ON!
I THINK SHE IS UP TO THE CHALLENGE INCLUDING FACING SERENGETI EMPRESS' HALF-SISTER!
BRING IT ON!
I CAN'T WAIT UNTIL SATURDAY!
ENJOY THE RACE EVERYBODY!
SENTIMENTAL FAVORITE THERAVADA IS ENTERED SATURDAY JUNE 14, 2025
Sentimental favorite Theravada is entered to run in a 1-mile turf race for Fillies and Mares 3 Year Olds-And-Up MAIDEN SPECIAL WEIGHT Purse: $120,000 at Churchill Downs on Saturday June 14, 2025 (race 8).
Theravada makes her third career start for trainer Rusty Arnold. Theravada is a 3-year-old Tapit filly is out of Grade 2 winner Cambodia, who earned $859,000 with four graded-stakes wins.
In her most recent start on April 12 (2025) at Keeneland [in a 1 1/16 miles turf race for 3-Year-Old Fillies], she finished seventh, beaten 9 1/4 lengths.
[Check out my detail description on this thread about 15 or 16 posts down titled: "THERAVADA JOURNEY: THE TRAIL OF SENTIMENTAL FAVORITE THERAVADA !", describing the reasons she lost that race]
She was bred by her owners Don Robinson and Allen Schubert of Winter Quarter Farm.
She'll be ridden by Brian Hernandez Jr in this 1-mile turf maiden special weight race in an overflow field of 16 horses, but it is limited to just 12 runners.
Theravada is a 5-1 morning line third choice behind the Jack Sisterson-trained 7-2 favorite Hello Beauty and Joe Sharp-trained 4-1 second choice Running Game.
Bet Theravada (ML 5-1) to win, place, show using double down betting strategy -- however, personally, I will only bet her to win.
With that said, I think she will win this race and I'm planning on gluing my eyes on the TV set the whole time the race is on.
BRING IT ON!!!
I'M VERY EXCITED FOR THIS SATURDAY AND I CAN'T WAIT UNTIL THEN!
BRING IT ON!!!
Looking at the field, without having a chance to examine every horse in the race, I see one horse (beside Theravada) stands out among a good group of horses.
That horse is Mo Expectations (ML 8-1), a 3-year-old filly trained by Brad Cox.
Mo Expectations is by Uncle Mo and is out of an extraordinary family credential through her Grade 1-winning half-sister Serengeti Empress.
Yes, that is correct: Mo Expectations is a half-sister to Serengeti Empress.
That champion filly Serengeti Empress earned over two million dollars and captured multiple graded-stakes, including the Kentucky Oaks (G1), establishing this as one of racing's premier female families.
The Saturday Churchill Downs debut race for this impeccably bred filly suggests connections view this as a significant unveiling, and Uncle Mo's record with fillies adds another positive element to an already compelling pedigree package.
As for Theravada, she never get a break from a post position standpoint as last week she was drawn post position 15 [and did not get in], and this week she is drawn post position 12 -- an outside post position as her previous two outings.
She never get a break -- what is up with that?
As far as the competition -- again a stellar group of horses, but I'm not complaining about her competition at all as I think she fits with these tough group of horses and it will serve her well into the future whether she wins this race or not.
She needs tough competition to be the best of the best of her generation, and so far, her competition was very tough in all of her races.
BRING IT ON!
I THINK SHE IS UP TO THE CHALLENGE INCLUDING FACING SERENGETI EMPRESS' HALF-SISTER!
BRING IT ON!
I CAN'T WAIT UNTIL SATURDAY!
ENJOY THE RACE EVERYBODY!
3 weeks ago
Load more feeds
Here is how to get started trading options for beginners
If you've never heard or knew what an option is, you've come to the right place. Take a look at my other tutorial called "introduction to options" and start from there. Once you get a good grasp of the concept, look around and pick a brokerage service and signup an account.There are lots of brokerage services out there that want your business and pick a discount brokerage service because it's cheaper. Brokerage services like Fidelity Investments, Ally Financial, Options House (was bought by E-Trade in 2016, so go to E-Trade.com), Charles Schwap, Scottrade, TD Ameritrade, Tradestation, Tastyworks, etc., or just Google around using the term "low commissions options brokers."
Make sure to read their pricing policy because some brokers charge low fees but require you to have a certain minimum amount in your account. Ally Financial, TD Ameritrade (I think) and Scottrade (I think) have no minimum. Tastyworks has a very unique pricing model--especially if you're an active trader--that they only charge you when you place an opening position trades but they don't charge you when you close your positions.
Remember that all other brokerage services charge you when you open your trade and also charge you when you close out your position. That's $10 for just one round trip--a $5 for opening position and a $5 for closing position. That's a lot of $5(s) and $10(s) to waste.
Please check the following out:
tastyworks.comAnother very good brokerage house that has zero commissions, zero options contract fees, zero deposit minimum. Please check the following out:
Webull.COM There are plenty of other brokerage services that have no minimum -- or if they do, it is very little minimum and the majority of them have a minimum of $25. Some brokers have no minimum but require their clients to keep accounts active by mean of trading. So look around.FYI: Check out the following website for online discount brokerage services comparisons. Scroll down to the bottom of that page for more comparisons: TD Ameritrade vs Ally Invest Review. Once you identified which brokerage service is right for you, go ahead and signup an account with them. They will ask for your social security # (or government-issued id # for foreign applicants), networth, and trading experience. The latter two you don't have to tell them the exact truth. For networth put something meaningful like over $100,000 even though you only have a few thousand dollars to trade.
A Side Note: Welcome to the 21st century and beyond, world! You are now can participate in options no matter where you are in the corner of the world, as long as you have internet connection, a government-issued id # (for foreign), and most importantly, money, and you can signup an account with one of the many online brokerages and trade stocks, options, bonds, etfs, and many other investment instruments at the tip of your fingers. This is the modern day Silk Road.
Networth is what you're worth at the present time and that includes your house, stock/bond holdings, savings, IRAs/401k, and other valuable assets that you can quantify. Also, in the application, it will ask how much of your current networth is liquid -- meaning, usable cash or can be easily turned into cash in a moment of notice. Again, you don't have to tell them the truth. Just put something like $20,000 or $30,000.
Notice that if you have IRAs/401k they are considered as liquid assets because you can withdraw or borrow from your accounts. Other notable liquid assets are bank accounts (checking/savings/preferred), CDs, money market accounts, stocks, tradable bonds, notes, account receivables, etc.
As for experience, one of the questions in the new-account application will ask is, how many years you have been trading and how many trades you have made or expect to make per year? Put something like intermediate (or a few years) because you have me as your mentor and that counts as experience (in my mind).
Most brokerage services establish a minimum experience criterio in which the number of years multiplied by the number of trades must be greater than 100. Most brokerage services consider this minimum experience criterio "liberally" that includes both real trades and simulated practice trades. Yes, you heard it right: your practice sessions count as experience and it makes a lot of sense.
So if you're not sure if you should go ahead and open a real trading account, you should consider applying for a paper trading account and see for yourself if it's what you're looking for. This way, once you are comfortable of what you're doing, you can apply for a real trading account.
Just inquire about them! They will be eager to help you because once you know how to trade options, they'll know that you'll most likely open a real trading account with them and giving them your business.
Let me tell you this: trading options is a lot easier than it sounds. Trading options is very simple--simple enough that even if you never knew what an option was [before reading my articles on options and] can start trading options in a very short amount of time.
Most brokerage services have a great paper trading simulator to get you comfortable if you specifically inquire about them for the purpose of paper trading before applying for a real trading account. Investopedia has a very good trading simulator for free for anyone that signup a free account for just the purpose of learning how to trade. Check this out:
Investopedia Free Account Signup After you've signed up, login to your free account and begin your trading simulator. Investopedia calls this trading simulator a "game" because it's like a game you play for "fun." You can select a variety of trading games, such as trading games for beginners (meaning beginner options traders) by selecting and putting a checkmark on "Beginners" options and click on "Join Selected Games" to go to the trading simulator page. On that page on the left side sidebar, you can find trading simulators: simulate trading of stocks, options, futures, and other trading games. There is a well-documented "how-to" guide to help you get started as well.
In addition, you may want to signup for a free account at Yahoo Finance where you can get access to all kinds of investing information. Once you have a free account, you can create as many portfolios as you want, say, one portfolio contains certain stocks or a group of industry stocks, and another contains certain investing tastes, such as income verses growth stocks.
Another very good website is called investing.com where you can signup for a free account and get access to all kinds of investing information, such as charts, technical and fundamental analysis, stocks screener, news alert on stocks, stock watch, etc.
Also, another very good website is called finviz.com where you can signup for a free account and get access to all kinds of investing information, particularly charts. Technical chart analysis in particular is very powerful and a must read if you are swing trading, looking to make quick profits using stock channels where stocks often move in a range bound, say, stocks that move between the resistance and support levels more frequently.
For those of you who are eager to apply for a real trading acccount, just put some experience, say, a few years and about 30 to 50 trades per year to get your account approved. You don't need experience for the types of trades you'll be doing. Hey, you have to start somewhere and right here is the best place for you to get started.
In the brokerage services application, it offers a variety of account types for you to choose. The following lists the account types you can open:
- Individual (Individual, Joint, and Retirement Account). This is a regular account for individual single person, married joint account, or a retirement account such as for an investment club.
- Individual (Trust and UGMA/UTMA). This is an account for a trust or for accounts setup for your minors for their retirement investment account.
- IRA (Individual Retirement Account). This is an account setup for an IRA/401k retirement account.
- Single Fund. This is an account setup as a managed fund such as an investment fund, a hedge fund or a mutual fund that has only one type of fund under management, e.g., a long term growth fund.
- Multiple Funds. This is an account setup as a multiple managed fund such as an investment fund, a hedge fund or a mutual fund that has multiple types of fund under management, e.g., a value fund, an aggressive fund, a long term growth fund, a bond fund, an emerging fund, etc.
- Financial Advisor. This is an account type for individuals or companies setup to offer and manage investment for their clients.
- Institution (Partnership, Corporation, Limited Liability Corporation, and Unincorporated Business). This is an account type for institutions such as endowment, schools/churches/non-profit organizations retirement funds, individuals formed as a partnership, a corporation setup to manage their own investment and/or their clients' investment. Also, an account for an investment club can signup for institution account as well.
Most of you probably should apply for the first one: Individual (Individual, Joint, and Retirement Account). But if you have minors that you want to expose them to savings and investing, you might also want to signup the second account type: Individual (Trust and UGMA/UTMA).
If you have IRA/401k accounts at your employers or somewhere else, you might want to open an IRA account and transfer them to your accounts at the brokerage services so that you can manage your own investment. It is safer than you think using the trading methods described in this website: covered calls and covered puts.
Furthermore, IRA/401k accounts are allowed to use up to level 3 trading methods. This means that IRA/401k accounts can use long puts/calls, married puts, straddles, strangles, and credit spreads. That is a lot of strategies at your disposable.
All types of accounts, includling IRA accounts, allow you to trade options, in addition to invest in other types of investments, such as stocks, bonds, mutual funds, etfs, warrants, etc.
In options, there are at least three levels based on experience. For most of you, the first three levels are enough for now:
- Level 1: Is for beginners who have no experience in options trading.
Level 1 allows you to trade:- Covered calls. Covered calls sold against stocks held long in your brokerage account.
- Buy-writes (simultaneously buying a stock and writing a covered call).
- Covered call roll-ups/roll-downs.
- Cash Secured Puts. Covered Puts sold against funds held in your brokerage account.
This is for you beginners who had no idea what an option was before reading my tutorials. Well, even after reading my tutorials, consider yourself as a beginner and signup for level 1. In this level you are allowed to buy/sell stocks and trade two types of options: covered call and cash-secured put. For most of you, level 1 is enough for a while.
Once you have demonstrated that you know how to trade covered calls and cash-secured puts and also show an increased in your account balance because of your trades were successful, and then you can apply for an upgrade to the next trading level, which is level 2.
Again, in level 2, you have to demonstrate that you know how to trade vertical legs strategies before you are granted to the next level, which is level 3. - Covered calls. Covered calls sold against stocks held long in your brokerage account.
- Level 2: Is for intermediate level or people who have some experience in options trading -- for people who know how to trade vertical legs strategies.
Level 2 includes all Level 1 strategies, plus:
- Equity debit spreads (commonly called debit spreads).
- Equity credit spreads (commonly called credit spreads).
- Equity calendar/diagonal spreads
- Index debit spreads (commonly called debit spreads but using index instead of individual stocks).
- Index credit spreads (commonly called credit spreads but using index instead of individual stocks).
- Index calendar/diagonal spreads
Level 4 includes all Level 1, 2, and 3 strategies, plus:
- Naked equity puts
Level 5 includes all Level 1, 2, 3, and 4 strategies, plus:
- Naked equity calls
Level 6 includes all Level 1, 2, 3, 4, and 5 strategies, plus:
- Naked index calls
- Naked index puts
In the application, they might give you the option of applying for a margin account (as well) to go along with your regular trading account. A margin account is an extra priviledge account offered to most applicants who want leverage on their account -- and that is -- using brokerage money to control a huge position.
In essence, a margin account allows you more buying power (or trading power in this case) -- usually between 50% to 80% of your account balance. For example, if you have $2,000 in your trading account available for trade, your actual available trading money is between 50% to 80% of $2,000, which is about $3,000 (using a 50% margin account). The percentage is vary from applicant to applicant, depending on each applicant's creditworthyness.
You need to apply for a margin account during the initial application signup or at any time thereafter by contacting your brokerage service and requesting for a margin account. You'll get notified of their approval/disapproval in a short period of time. So if you want to have leverage to control more trading power and generate more profits, you can apply for a margin account to go along with your regular trading account.
A margin account is a loan account where the margin money is loaned to you to allow you to use that loaned money to trade stocks/options (in addition to your own money). But you have to pay interest on the loaned money. The interest rate is comparable to market interest rate like prime rates or rates people pay on their car loans or credit card payments.
Once you are approved of a margin account, your regular trading account should say that you're allowed a priviledge of a margin account; and if you have a balance in your regular trading account of, say, $10,000, it should show that your maximum funds available to trade is $15,000 (if you're approved of a 50% margin account).
So having a margin account is a huge advantage for most traders because you can use leverage to control huge position without spending your own money. That's why most experienced traders have margin account and they make use of their loaned money from their margin account to their advantage all the time to control huge position and therefore generate huge profits.
Once you are approved of a margin account and you're using your regular trading account to trade, your account should list two balance amounts: one for your regular trading account balance (for example, balance: $10,000) and another for the combined amount of your own money and the margin money (for example, available for trading balance: $15,000).
If you trade on your account, the margin interest kicks in and accrues either on a monthly basis or quarterly basis depending on your brokerage service's term of loan. So please read your margin account term of contract. Most brokerage services charge you on a monthly basis. So each month it automatically should show the accrued margin interest amount and that amount is deducted from your regular account balance. So you don't have to do anything on your part as long as you have enough balance to cover the accrued interest.
If you don't have enough money in your regular account balance, it will show a negative balance on it and the brokerage service will activate what is called a house call. A brokerage service is activating an in-house calling away from you -- to take away from you. The term call means to take away.
In the put and call jargon:
Put is to put it to you -- give it to you -- hand it over to you.
Call is to call it away from you. Call you in to take it away from you.
House call is to call you in to take the money away from you -- to wave you in to take the money from you. Sort of saying: Come one in so that I can take money from you.
A house call is a term used to indicate that you owed money to the brokerage service and it wants you to pay it for the next 30 days -- either depositing more money into your account or sell some of your holdings just enough to cover the house call balance. After 30 days from the house call notice and the balance is not paid, the brokerage service will try to collect the balance from you by selling your holdings just enough to cover their dued balance.
Also in the application, they might ask you how often do you trade? And how much per trading session? Again, you don't have to tell them the truth and putting something like two or three times a month or once a month.
In actuality, you will most likely trading monthly but who to dictate how often you trade? It's your money and you can trade once every five years if you want. As for how much, put something like $2000 to $5000 or whatever amount you wish and it won't effect your approval of the application. These questions only for them to help them learn about your aptitude and risk tolerance as an options trader.
Once you are approved, you can start the process of depositing funds into your account and start trading. I recommend starting out depositing into your account of at least $2000 and use the whole balance [or close to it] to buy a stock. That way, you can put every penny of your money to work for you instead of having some money sitting in your trading account doing nothing.
If you can afford to deposit more I think it is to your advantage, because the more money you put it to work for you the more stream of income you generate. The optimum firepower that I usually recommend to my friends and relatives is to start out about $5000 and put the whole $5000 to work right away and go from there. Of course, the more money that you can put it to work for you the more stream of income is coming to you.
The first trade you make should be a covered call. And repeat that trading process for awhile and see how your progress is. In other words, is your account balance higher than the original balance after a few trades?
If not, you might want to try to dump the stocks you have and move on to other stocks and start to do your homework on some other stocks and go from there.
If your account balance is higher, you have to decide if you want to continue on doing the same thing or move on to other strategies, such as the selling of cash-secured puts. Or you can do both if you have enough money for both. But make sure you start with covered call.
Meanwhile, as a beginner in options trading, you always want to learn more about options so that you can improve your skill levels and earn more profits. Here are some very good videos by Adam Khoo that teach you how to trade options as a beginner.
Professional Stock Trading Lesson For Beginners. Five Power Candlestick Patterns in Stock Trading Strategies Lesson For Beginners. Market Cycles in Stock Trading Strategies Lesson For Beginners. Trade Like a Casino for Consistent Profits For Beginners. Part I. Trade Like a Casino for Consistent Profits For Beginners. Part II. That is it!
Introduction to IPO
Article Date: August 9, 2014
By Paul S. Tuon
The answer to that question may seem so obvious but it's not as a clear cut as a lot of you might think. So what exactly is a stock? Before I answer that, let's start from the basic principle of businesses. Enterprising business operations can be conducted in a number of different forms. The most notably common among the various possiobilities are the following:
- Sole Proprietorships
- Partnerships
- Trusts and Estates
- S Corporations
- C Corporations
Almost all enterprising businesses start out at the inception as a closely held, private business entity. There is rare (or virtually none) that an enterprising business starts out at its inception as a publicly traded company; the only exception is when a company is spin-off from its parent company and instantly becomes a publicly traded company.
The reason that no company starts out as a publicly traded company is that no investor would want to invest in an unknown company that just pops up from nowhere and sells shares to the public. Before the public sink their hard earned money into a company the public need to feel confidence in the company's going concern, and that company has to have a solid foundation and a good track record of performance and has a bright future.
When an enterprising business became a well-established enterprising business entity as a privately held business entity, then it might want to think about becoming a publicly traded company.
There is a variety of reasons why a privately held business entity might want to become a publicly traded company. There are pros and cons of being a privately held business entity. And also, there are pros and cons of being a publicly traded company.
There are no advantages of one form of entity over the other. It's just a matter of choice or situation--[really]. In some situations, it's better off to remain as a private business entity. In other situations, it's better off to become a publicly traded company. We won't go into great details on the pros and cons.
When a privately held business entity decides to become a publicly held company, the company is said to be going public. In other words, the owner(s) of the privately held business entity are selling part-ownership to the general public.
The keyword here is part-ownership -- and not the whole-ownership of the company -- because the original owner(s) of the closely held business entity are selling only part of the company and not the whole company. When you buy a part-ownership, often called a stock in a company, you become a part-owner (also known as shareholder). You immediately own a part (no matter how small) of every thing the company owns -- such as buildings, office equipments (i.e., furnitures, computers, copy machines, etc), vehicles, machineries, lands, and other properties.
The formal name for this process is called an initial public offering or IPO. Typically, a company goes public when it needs to raise cash, usually for expansion. In exchange for cash, the original owner(s) of the company give up some rights and some measures of decision-making control to shareholders. The original owner(s) become peer owner(s) to the new shareholders.
The initial public offering process spells out the terms and conditions of the business entity. In a simplified term, it spells out how many total shares of the whole company, e.g., 400 million shares, and how many shares the original owner(s) get, and how many shares it is selling to the general public. It also spells out the offering price for each share that the company is selling to the general public.
The initial public offering process can issue three types of stocks: common stock, preferred stock and warrants, and within those three types of stocks, it can also issue multiple classes of a stock as well. Each stock whether it is a common stock or a preferred stock or warrants can contain classes such as common stock class A, B, C, etc., Preferred stock class A, B, C, etc., and all those combined shares in the three types of stocks is called shares outstanding in a company. So the shares outstanding includes the common stock shares, preferred stock shares and also the warrant shares.
The total of all those shares (or in the previous example, 400,000,000) is called shares outstanding. All those shares outstanding is called a stock, hence answering the question posed earlier 'what is a stock?'
Notice that a company can have many stocks: common stock, preferred stock and warrants, and each of the three types of stocks can contain classes of their own, such as common stock class A, B, C, etc., Preferred stock class A, B, C, etc.; and each class in those three types of stocks is also called a stock.
Now the answer to the question: 'what is a stock?' is now much clearer.
Different classes of a stock contain different rights and privileges, with the highest rights and privileges given to the highest alphabet order. For example, class A shares have higher rights and privileges than class B, class B shares have higher rights and privileges than class C, class C shares have higher rights and privileges than class D, and so forth.Of the three types of stocks, common stock shares have the least rights and privileges and preferred stock shares have the highest rights and privileges and its classes shares generally have preferrential treatment over all common stock classes shares and also have preferrential treatment over all warrant shares of a stock as well. warrant shares generally have rights and privileges somewhere between common stock shares and preferred stock shares.
A share of a stock whether a common stock, a class A, B, or C, or preferred class A, B, or C, or warrants, represents a part-ownership in the company. A publicly traded company is owned by its shareholders, including the original owner(s) -- often thousands of people and institutions -- each owning a fraction of the whole company.If the initial public offering process makes no mention of other classes of a stock, it is assumed that the initial public offering is just issuing only one class of a stock commonly called common stock.
Why do companies choose to have more than one class of stocks?
There is typically only one reason that companies choose to offer multiple classes of stocks, and that is, to entice investors to buy more shares of the company -- and therefore, to raise cash to run the company. To raise cash, companies need to use gimmicks like offering investors with certain classes that pay dividends, having preferrential treatments, and other perks. You will often see a lot of non-high growth companies offer multiple classes of stocks, whereas high-flying growth companies rarely have more than one class of stock because they have no shortage of investors wanting to buy their shares.
Open Trading Visibility
When a company goes public, it also benefits from the fact that its stock is trading in the open market. This open trading tends to give the company legitimacy: its performance, its financial vitality becomes visible to all critics and non-critics.
When a company goes public, the value of the company is determined by the general public. That is, the general public take a look at the company's total shares outstanding and the offering price for each share that the company is selling to the public and multiply them together to get the total value of the company.
For example, if the company's total shares outstanding is 10,000,000 shares and the offering price for each share that the company is selling to the public is $10 per share, then the total value of the company is $100,000,000 (10,000,000 X 10).
If the general public think that the company is worth at least that much, they would be willing to own some shares of the company. On the other hand, if the general public don't think that the company is worth that much, then they would not be willing to own any share of the company. It follows the modern understanding principle that the value of a thing -- or in this case, a stock -- is determined by what one is willing to give up (i.e., money) to obtain the thing (or in this case the shares of a stock). It's a market value-based principle where value is determined against a trade-in.
Now that you know the background of how an IPO works, let's see a real life IPO process featuring companies of Twitter, Facebook, Google and Snap Inc.
IPO Journey
Here is an actual IPO process outlined chronically for a typical company going public. The featured company is Twitter, which went public in November 7, 2013:How Does IPO Pricing Work?
The actual mechanics of what happens are somewhat complicated, but the basic idea is simple economics: The price is set as the number which balances supply and demand.
It's the principle of economics of supply and demand -- plus the modern understanding principle that the value of a thing is determined by what one is willing to give up to obtain the thing. It's a market value-based principle where value is determined against a trade-in.
In more detail, here is what happened for Twitter:
Each Twitter co-founder owns a percentage of the company and how much that percentage is determined from the letter of the agreement when they first formed the company. In the letter of the agreement, it states in percentage who gets how much of the company. The founders followed the letter of the agreement signed when they first started the company; and perhaps later, the founders decided to bring in some early investors (for example, venture capital firms and angel investors), and they, too, get a piece of the company (stated in percentage). This is called private placement. The money raised from the early investors went straight into Twitter's bank account and get used to run the company. So now there are more people who own the company and the founders' stake get smaller because they have to share the company with more people. So now Twitter is owned by the founders, the early employees, and some early investors.
When a company first started as a privately held company, in order to conform with the rules and regulations in conducting an enterprising business entity, it needs to register with the state or locale authority of its jurisdiction to begin conducting an enterprising business. In the filing application, it can decide to allocate the total shares outstanding of the company in actual number of shares or in percentage (as Twitter did). Most companies started out allocating its ownership in percentage, e.g., two owners, each owning 50% of the newly formed company. Or it can decide to allocate its ownership in actual number of shares, e.g., two owners with 10 million shares, each owning 5 million shares.
Businesses ownership structure is very flexible and easy to alter once you formed it and filed it. The easiest way to form a new company -- if you don't know whether to allocate ownership structure in actual number of shares or in percentage -- is to just allocate ownership structure in percentage and later you can change ownership structure from percentage to actual number of shares to reflect your situation, like Twitter did. You can alter your business structure at any time after you formed it; and better yet, your company doesn't have to go public in order to change its ownership structure. All you have to do is filing an 'application of amendement' with the state or locale authority of your jurisdiction and do business as usual.
Usually when a company decides to allocate its ownership in actual number of shares is because of convenience and practicality rather than costs or of other reasons. If a company has many employees and other vesting interest and wants to compensate them in stock options, issuing actual number of shares makes a lot of sense -- and a lot of companies in this situation often do issuing actual number of shares at its inception.
Issuing actual number of shares has other advantages, too, and that is, the vesting interest can trade (buy or sell) their shares in private transactions. This is similar to buying/selling shares in a publicly traded company -- but the only exception is, there is no SEC or other locale authority of jurisdiction you have to comply with their rules and regulations in conducting this kind of private transactions. It's a private placement matter conducting private transactions.
A newly formed company usually requires a "bylaw" written by the founders of the company. The bylaw states the rights and duties of the company, including ownership interest. At a very minimum, the bylaw should issue certificates of stock ownership to the shareholders involved, including the founders and early investors at the inception.
Here is what a typical certificate of ownership looks like:
                                  Certificate Number: 1000

This certifies that Mary Q. Public is the owner and registered holder of twenty thousand
(20,000) shares of ABC Corporation, transferable only on the books of the corporation
by the holder hereof in person or by duly authorized attorney upon surrender of this
certificate properly endorsed.

IN WITNESS WHEREOF, the said corporation has caused this certificate to be signed by
its duly authorized officers of the corporation this 2nd day of October, 2018.


                                      ABC Corporation


                                      by president: ___________________________
                                                         John J. Doe
|
Prior to 2012, the only restriction for private companies operating in the United States was that a company cannot have more than 500 shareholders at any time while it was still operating as a privately held company. The 500-shareholders threshold was originally introduced in 1964 to address complaints of fraudulent private trading activities of company's shares because of no threshold limit of private shares. Prior to 1964 there were no limit as to how many shareholders a private company can have; so because private companies can have as many shareholders as they wanted it caused fraudulent black market activities underground to popup and the SEC stepped in and instituted the 500-shareholders threshold.
The 500-shareholders threshold rule was increased to 2,000 in late 2012 with the passage of the JOBS Act of 2012, after complaints by Facebook and other tech companies for restricting them from granting employees shares of stock.
Leading up to Facebook's IPO (May 18, 2012), Facebook experienced a huge number of shareholders that spilled over 500 shareholders due to the company's policy of granting employees shares of stock. At that time, the JOBS Act wasn't enacted yet and Facebook was forced to go public for being over the 500-shareholders threshold.
Since the JOBS Act, private companies have more room to breath regarding their shareholders threshold. This 2,000-shareholders threshold restriction applies to any private company with shares allocation of either percentage or actual number of shares. So a company's shares allocation is irrelevant for this restriction.
Remember that Twitter started out at its inception by allocating its ownership structure in percentage. Now they have to do more work by changing its ownership structure from percentage to actual number of shares.
Before the IPO, ownership of Twitter is partitioned into N equal shares, and each of the aforementioned people's stake in the company is determined by how many of these shares each owns. For example, N is around 475 million shares for Twitter. How did they come up with the number 475 million? There is no rule that says you have to have a certain number or ranges of numbers for any company. It's based on one's intuition, or in this case, the founders' intuition to realize that their company, Twitter, was worth at least $475 million at that time. Other companies might have less than 475 million and some others might have more than 475 million shares depending on how the owner(s) judge the sentiment of the condition of the market at that time. So for Twitter, the founders felt that Twitter was worth more than $475 million and they decided to choose 475 million for their company.
The number 475 million shares is not set in stone either; the company can decide to increase or decrease it any time from now on as it sees fit during its lifespan as an enterprising business entity. The company can file an 'application of amendement' with the state or locale authority of its jurisdiction to do either a 'split' or a 'reverse split' of the original number of its shares; to either increase the shares by splitting the current shares into multiple ratios; for example, a 2 to 1 ratio, which splits every share into two shares effectively doubling the current shares; or the company can do a reverse split in which it reduces the current number of shares; for example, a 1 to 2 reverse split, which cuts the current shares in half. The ratios of the split can be as small as it wants by making it in decimal fractions and it can be as large as it wants by increasing the numbers in the ratios. Another way of increasing the total shares of the company is to sell shares in the initial public offfering or issue more shares in the secondary offferings after it had gone public.
Selling more shares means creating more [new] shares to sell to new investors; and therefore, increases the total shares outstanding of the company. So the current shareowners don't lose any actual number of shares that they've already owned as a result of selling more shares; however, they will experience a shareholder dilution. [More on shareholders dilution in a little bit.]
Out of 475 million shares, Twitter cofounder Evan Williams owns 57 million of these shares, so he owns 12 percent of Twitter. Why did cofounder Evan Williams owns only 57 million shares out of 475 million? Well, he was one of many cofounders, plus early investors also got a piece of the company and thus the math works out to 57 million shares for Mr. Williams. So all the allocated shares to the cofounders and early investors must totalled to 475 million shares.
Now Twitter decides to "go public" via an IPO. The reason for doing so is to raise more money. As if private placement isn't enough money and people to share the company, Twitter decides to go public. In other words, it decides to bring in more people and provide the public with the opportunity to share in the ownership of Twitter. Why would the Twitter founders want to give away more part of their ownership in their company? Well, they are not giving it away: they are selling it, albeit the proceed goes to the company and not to the founders themselves. Whatever the public pays for partial ownership in Twitter goes straight into Twitter's bank account for general purpose use in the company. Notice that the original owner(s) and early investors receive nothing or $0 dollar from the proceeds for their hard work building the company to an ipo; nor do they get any money for any subsequent future secodary offerings. All proceeds go straight to the company and not to the founders or early or late investors. That doesn't seem fair, or does it?
For the founders of Twitter [or for any other company for that matter], the upside of this, is that Twitter becomes a richer company, and they can use the new money to develop the company into an even better and profitable company, making the company more valuable. The downside is that their stake in this more valuable company goes down. This is called shareholders dilution because the more shares you sell to the public the more new owners the original owner(s) have to share the company with and it drives the current owners' shares value down.
Take it this way: you own an apple tree that produces good delicious apples for sale and you bring in other people to be part-owner and share the output of the apples. Your current share of the apple will go down because you have to divide the output with other people now. Stock follows the same principle.
This is not the only time that current shareowners experience shareholders dilution. Whenever a publicly traded company decides to issue more shares called secondary offering -- and that is -- an offering after the initial public offering, the total shares outstanding will increase and thus making the current owners' percentage of ownership smaller in proportion to the overall total shares of the whole company.
[A side note: any offering whether it is the second, third, fourth, fifth, etc., is called a secondary offering, the offering after the initial public offering. A company issues secondary offering shares to raise cash to run the company. Likewise, a company buys back shares from the public and retires those shares to increase current sharesholders' value. Buying back shares have a reverse effect on shareholders' value from issuing secondary offerings.]
How do the Twitter founders decide the optimal solution to this tradeoff?
They talked it over among themselves and decided how much ownership they were willing to give up and how much money they were looking to raise. So they balanced the loss in ownership against the gain in the money raised. So they decided that they needed to choose two numbers: the number of new shares of Twitter to issue; and the price at which to sell these shares. There you go again: a
shareholders dilution.Remember that the original shares of Twitter as of now is 475 million and the founders are contemplating adding more shares to the already 475 million. If they decide to issue M new shares of Twitter and sell them for $x each, then Twitter adds $xM to its bank account, but everyone who already owns Twitter shares had their ownership in the company reduced by the factor N / (N + M). This is called
shareholders dilution: it dilutes existing shareholders' value because there are more shares outstanding and perhaps there are more shareholders in the company. The more shares the company is selling the more dilute value for existing shareholders.Let's think about this shareholders dilution principle for a moment. Let's start from the beginning when a company just get started. The owner(s) own percentage of the company, say four owners, each owning 25 percent of the company. And let's say the owners decided to issue 400 million shares for the whole company and each receives 100 million shares.
There would not be a dilution of shareholders' value if the four owners don't want to sell part of their company to new investors. Any time you sell part ownership of a company, it reduces your current ownership holding. And furthermore, the money received from the sales won't directly benefit the current owners. The money goes straight to the company's bank account to be used in the company's operations.
After the sale, the company's shares outstanding is increased from the original 400 million shares to the newly added x shares plus the original 400 million shares. Notice that the four owners didn't lose their actual number of shares that they've already owned as a result of sharing their company with new investors. The original four owners still own 100 million shares each. Bringing in new investors doesn't mean that some of the shares that they've already owned are taken away from them and re-distributed to new investors. That's not how it is usually done.
Although it is rare, the original owners can decide to do just that by clawing back portions of the shares from themselves and give them to new investors while also filing an application of amendement with the state or locale authority of its jurisdiction to account for the transaction and go on with business as usual without issuing new shares to pay the new investors. That kind of practice is very rare in deed in modern business transactions, but it is legal and nothing stops you from doing that.
Now if you understood the Twitter description thus far, you may have noticed that Twitter did exactly that by going back to the founders themselves and clawed back portions of their ownership percentage and allocated it to the early investors. It may have been that one founder got 40%, another got 30%, another got 30%, and the early investors asked to get a 10% or 20% or any number of percentage (in which I am not sure since this information was/is [still] private).
So to give the early investors their demands the founders had to recalculate their ownership percentage to reflect the accommodation of new investors. That means that the founders' actual ownership percentage had to come down proportionately to satisfy all parties involved. For example, if a new investor had asked for a ten percentage investment, each founder's stake would have decreased by a factor of [10 x 1/3] or 3.33% that reduces the sharholder #1 from 40% to 36.37% and for the sharholder #2/#3 from 30% to 26.67%. Add them all up: 36.37% + 26.67% + 26.67% + 10% = 99.71% (and rounding off to the whole number to 100%).
If later, more [late] investors want to invest in the company, the same process that just described is followed if the company allocates its ownership in percentage. Let's say that one investor wants to invest, say, a 5% stake in the company, each founder's stake and the early investor's stake would have decreased by a factor of [5 x 1/4] or 1.25% that reduces for the current stake of sharholder #1 from 36.37% to 35.12%; for the sharholder #2 from 26.67% to 25.42%; for the sharholder #3 from 26.67% to 25.42%; and for the (early investor or sharholder #4) from 10% to 8.75%. Add them all up: 35.12% + 25.42% + 25.42% + 8.75% + 5% = 99.71% (and rounding off to the whole number to 100%).
What happens if the company allocates its ownership in actual number of shares instead of percentage? Well, the normal process is to issue more shares worth the amount stated in the investment term. For example, if the investment term states that a new investor gets a 10% stake in the company, then 10% [of the current shares outstanding] worth of new shares will need to be issued and given to the new investor so that existing owners don't lose any actual number of their shares that they've already owned. Very straight forward.
Now to finish off the four owners example: Similarly to Twitter's founders, the original four owners' stake in the company got reduced and is no longer 25%, even though they still each own 100 million shares, and now their holding is reduced in term of percentage by 1/4 times the newly issued shares for each four owners. This is called shareholders dilution, a process of selling more ownership to new investors. It's not uncommon for a company to sell more shares years after it went public to raise more cash to run the company. This is called secondary offering. It is also can cause shareholders dilution. To offset shareholders' dilution, a company needs to generate more business and thus generates more profits and thus its stock price goes up and thus makes shareholders happy and thus current shareowners will forget about the actions that a CEO took when he/she issued more shares to raise cash.
[Now let's continue with Twitter]
Twitter needs to choose M first, because what x should be depends on M: x needs to be a price that the public would be willing to pay to own 1 / (N + M) of Twitter. In the process outlined below, Twitter chooses M in step (1) and chooses x in step (5).
Here we go:
1. Twitter decided to offer 70 million shares on the public market. This means that current shareholders of Twitter have their stakes decreased by a factor of 13 percent = 475 / (475 + 70), and that 13 percent of Twitter is up for grabs for the public or mainly for institutional investors. How did Twitter come up with this number? Its executives know around how much money they want to raise, and how much of their ownership they were willing to give up.
Based on the number 70 million, Evan Williams knew right away that after the IPO his stake in Twitter will decrease from 12 percent to 10 percent, but in his mind he thinks this sacrifice is well worth it. Twitter now advertises to institutional investors (via its underwriting banks, in particular Goldman Sachs) that 70 million shares of Twitter are on the table, and invites them to submit requests for how many shares they would like to buy.
The process of going public is a two-tier process: first, you let institutional investors buy shares from you (via the underwriting banks), and second, in turn, institutional investors (later) sell those shares to retail investors (like you and I -- who lack deep pockets that instutional investors have).
Notice that Twitter or any IPO-bound company don't spell out the offering price just yet, and they kept institutional investors in the dark and institutional investors have no official word on how much they will have to pay per share, but they can do their own analyses to come up with rough estimates. This is almost like a Dutch Auction process where you want to gauge the demand of the shares by inviting buyers to submit their bids to buy shares, stating how many shares and how much price they're willing to pay.
2. Meanwhile, the institutional investors are busy at work trying to come up with an optimal price to submit their bids. They pay close attention to market news reports to see if rumors abound. Lo and behold for Twitter, rumors circulated that the offering price will be in the $17 to $20 range. [A side note: You can keep tuning to market news and you often hear rumors about some IPO-bound company is expected to price its share in range]. And for Twitter, rumors ran wild!
3. Multiple reports: Rumors circulated that the offering price will be in the $23 to $25 range. By now, institutional investors got a fairly good idea of the price range they intend to submit their bids.
4. By November 5, 2013, institutional investors must submit their requests on how many shares they wish to buy. I call these "requests" and not "bids" because they can take many forms, ranging from the simple ("I want to buy 1 million shares, no matter the price") to the complicated ("If the offering price is between a and b, I want to buy X shares; if the offering price is between b and c, I want to buy Y shares; but in the event that Z occurs I do not want to buy any shares"). This process resembles a closed auction where bidders of an item submit their bids in writing stating the price range and the quantity of the items. A more accurate comparison is that this process is similar to a Dutch Auction process where you invite buyers to submit their bids to buy shares, stating how many shares and how much price they're willing to pay and the underwriting banks can choose to accept bids that fall in the optimal range.
Who are these institutional investors?
They are the "important" clients of the underwriting banks: the top pension funds, mutual funds, hedge funds, high net worth individuals, and long standing clients. Why do these investors get first dibs on an IPO?
Retail investors often complain this is not fair, but the (official) reason is stability: the argument goes that institutional investors (who are accredited, sophisticated, more experienced, and who have deeper pockets and capacity to take risk) create stability in the stock price by being the first to receive them. The alternative would be for Twitter to offer its shares to the entire world all at once on IPO day.
While this seems more fair, experience shows that this creates havoc: Twitter [or any IPO-bound company for that matter] is afraid that if it starts by offering its shares to Average Joe investors at the outset, the price will jump all over the place and the market will become anxious and confused. Moreover, the SEC fears that the "unsophisticated" Average Joes do not know how to deal with an IPO appropriately and are likely to lose their life savings by purchasing the stock in this unstable environment.
Personally, the current practice of letting institutional investors have their first crack at it is outdated and I think today's retail investors are sophisticated enough to avoid pitfalls. So I think it should open to all investors. After all, in the era of the information age, retail investors have access to all kinds of information, advices and opinions [on the internet], both for and against any IPO-bound company; and therefore, the majority of retail investors are more than well-versed about investing. That's just my opinion.
To back up my opinion, I intend to change the way they practice the "initial public offering" and allow basically everybody to have a crack at the IPO, assuming my company is good enough and worthy enough to go public. From now on, companies that I found will allow basically everybody to have a crack at the IPO, even if nobody else is following my trail and footsteps. Please stay tuned! A good place to tune to is:
http://www.noon2noon.net.
5. On November 6, 2013, around 4:00pm, after they've received all bids and reviewed and picked the optimal price: Twitter finally sets its IPO price at $26. By looking at the set price at $26 per share, we can see that the majority of the bids probably would've fell between $20 per share and $30 per share. So this means that anyone who submitted their requests at $26 a share or higher most likely will be granted as "winning" bids and anyone who submitted their requests below that price were rejected. At this point, Twitter knows that it will raise exactly $26 x 70 million = $1.8 billion in cash from this offering. We say that this offering price values the company at $14.2 billion = $26 x (475 million + 70 million). The only way you can say what a company is worth is by seeing how much someone else would pay for it, or at least how much he would pay for a share of it.
6. On November 7, 2013, around 8:30am: The IPO underwriters look at all the requests from step (4) and decide how to allocate shares to the institutional investors. This is not as simple as giving each institutional investor what they requested if their conditions were met.
First, the total number of shares requested by all institutional investors is likely much, much more than 70 million (and most institutional investors know that demand for shares greatly exceeds their supply, so they will tend to request a much higher number of shares than they actually want). After all, a lot of these institutional investors are dealers: they buy low and sell high to retail investors. So they will try to get as much shares as possible. And the best part, is that, they don't even have to send in the money right away. They can request the shares and when the IPO is open for trading for the first time, they can sell the shares at a higher price than they requested and pocket the difference.
Second, this is the only chance the offering company and the underwriters have to control what kind of shareholders have a stake in the company. They know the reputations/styles of the institutional investors, and they take this information into consideration when choosing how to allocate the available shares. The process is not "fair" in the sense that all of the institutional investors are on the same playing field; however, they're at the mercy of the underwriters who have full control of deciding who gets how much.
For example, the underwriters would be wary of granting a large number of shares to an investor who is likely to flip them (wait until the price spikes upon the opening trade and then immediately dump the position). The underwriters want an ideal balance of different types of investors: long term investors, short term investors, domestic investors, foreign investors, etc. Note that (essentially) all of the requests at this stage are "buy" requests; although in some cases an institutional investor can request to borrow shares (with the intent of creating a short position by selling them), this is very rare and (understandably) not very well received by the underwriters.
7. On November 7, 2013, before market open: All of the 70 million shares are in the hands of the initial institutional investors, who now owe Twitter $26 for each share they were granted. From here on, Twitter the company -- I mean the company and not the founders and early investors -- don't stand to gain a penny from the market activity. However, for the founders and early investors, they stand to gain/loss from the market activity.
8.On November 7, 2013, at the market open (9:30am): Orders start coming to the NYSE from all over the world, from both retail investors and institutional investors (both the ones who were lucky enough to be part of the initial offering and the ones who were not).
Each order is either a "bid" to buy ("I want to buy TWTR") or an "offer" to sell, also known as "ask", ("I want to sell TWTR"), with the latter presumably only coming from those [early] institutional investors who already have the stock to sell. Each order includes both a price and a size: for example, "I am willing to pay $45 per share for 100 shares of TWTR" or simply "bid: 45 x 100" or for an offer "ask: 45 x 100".
9. On November 7, 2013, after market open: The designated market maker (DMM) for Twitter (which is the bank Barclays) at the NYSE starts collecting all of the orders that are coming in. Taking a quick first look at the numbers they are seeing, Barclays reports that the prevailing price seems to be in the $40 to $45 range for the majority of the orders. This number is reported by the market news media [or sometimes called rumors].
10. On November 7, 2013, after market open: The DMM (Barclays) works on setting the opening price. The opening price is chosen so that supply and demand are balanced as well as possible. In other words, the opening price is the price that maximizes the number of trades that can be executed, based on all of the orders submitted thus far. This process is called price discovery, and is handled by humans at the NYSE (unlike Nasdaq, which handles price discovery electronically).
Once the opening price is decided upon (for Twitter, $45.10), the DMM "freezes the book", or blocks any new orders from coming in. Next, the DMM enters all of the accepted orders into the system, matching buyers and sellers based on the prices and sizes they submitted. The process of price discovery usually takes around fifteen minutes for the NYSE, but since Twitter is such a high profile stock with a great deal of anticipation and demand, the process took over an hour.
11. On November 7, 2013, at 10:50am: Bam, Twitter begins trading at $45.10. In particular, the public is willing to pay $45.10 per share of Twitter, and we say this opening price values the company at $24.6 billion = $45.10 x (475 million + 70 million). Twitter instantaneously increases in value by $10 billion.
12. On November 7, 2013, at market close (4:00pm): Twitter closes at $44.90.
Conclusion: Was Twitter a Success for its IPO?
The success of an IPO is measured by how smoothly steps (10) and (11) go. If the price during discovery falls below the initial offering price ($26 for Twitter), this looks embarrassing and the underwriters will shore up demand by purchasing shares. Similarly, if the price goes berserk once trading begins, the DMM is blamed for not setting the price appropriately.The fact that the closing price ($44.90) is close to the opening price ($45.10) in this case is a sign of stability, and that the underwriters and the DMM performed their job well.
Note that for Twitter as a company, the exciting day was November 6, not November 7. On November 6, Twitter set the offering price, and thus knew it would raise $26 x 70 million = $1.8 billion in cash. The opening price ($45.10) is irrelevant here.
But for the employees of Twitter, especially the founders and early investors, the exciting day was November 7: they already owned shares before any of the IPO process happened, whether they obtained these shares as founders, as early investors, or in the form of employee compensation and those shares are worth a fortune. But they were in limbo regarding just how much this intangible stake in the company was worth until 10:50am, at which time they gleefully realized they now had $45.10 x n in their pockets, where n is the number of shares they owned.
So who profited from the surge from the offering price of $26 to the opening price of $45.10?
Not Twitter, the company.
Instead, its employees and the institutional investors from step (4) just received a huge return. Considering this circumstance, was $26 too low of an offering price? Perhaps. If Twitter had instead set the opening price at $45, and assuming that demand from investors was the same, Twitter could have raised nearly twice as much money for the company. However, the goal of an IPO is not just to make as much money as possible for the company; it is also to build a foundation of happy shareholders, and a shareholder is happy if he gets a nice return from his IPO investment. Normally companies try to set the offering price so that the initial investors earn something like 10 percent on IPO day, so in that regard the 73 percent return the initial investors received is on the high side.
As a concluding aside, let us consider what happened to Facebook, now infamous for its botched IPO. The initial offering price (offered to institutional investors) was $38 per share. After price discovery, the opening price on the NASDAQ exchange was $42.05 (an 11 percent spike, compared to 73 percent for Twitter).
After trading began, the stock started to drop back down toward $38. It very well would have gone below $38 were it not for the embarrassed underwriters who provided support by purchasing shares at $38. The closing price on IPO day was $38.23. Needless to say, the institutional investors who received first dibs on Facebook were not pleased. Nor were they when a week after its IPO, Facebook closed at $26.81. And that's not all: Facebook continues to drop gradually to as low as $12 a share in the span of two years later from its IPO debut.
What went wrong?
Numerous things:
- Two days before the IPO, Facebook changed its mind about M (the number of shares it would offer). Though the mathematics is simple, this meant that all the major players who had planned on purchasing shares on IPO day had to recompute everything and update their plans.
- Many of the initial institutional investors reported in the days before IPO day that they intended to sell some of the shares they would receive. Remember that a lot of these so called institutional investors are people just like you and I who look to make money in the stock market. Except you and I don't get the privilege to obtain IPO shares at no cost and sell at the IPO debut trading to make quick bucks. In other words, a lot of these so called institutional investors are opportunistic dealers who seek to make quick bucks using their privilege and well-connected status.
- Facebook's initial offering price was much closer to the expected market price than Twitter's; as a result, the initial institutional investors in Facebook stood to gain much less on IPO day than the institutional investors in Twitter.
- The period of price discovery took exceptionally long (trading opened at 11:30am) and the process was marred by technical difficulties before and after the start of trading: orders did not come through, and investors were confused about whether or not their orders had been executed or even received.
- Extremely high volume (because of unprecedented excitement about Facebook) overwhelmed the NASDAQ servers, exacerbating the technical difficulties.
- The excitement was not only unprecedented, but also excessive: many retail investors wanted to purchase shares of Facebook because they were convinced it was the next big thing (for many young people, purchasing Facebook shares was their first foray into the financial markets), but the reality was that the prices at which it was trading were ridiculously high compared to its profitability. When "virgin" retail investors (who had been promised that the stock price might increase by as much as 50 percent on IPO day) saw prices dropping, they grew anxious and sold their positions, exacerbating the selloff.
Because of the Facebook debacle, everything about the Twitter IPO was much more conservative (lower initial offering price, conducting a dry run of the IPO over the weekend to test all of the systems, using humans instead of electronics to handle price discovery, listing on the NYSE instead of the NASDAQ), and it seems this caution paid off, at least as of day one.
Google's IPO
Google's IPO, 10 Years Later
On August 19, 2004, Google GOOGL went public in a highly anticipated initial public offering that valued the six-year old company at what seemed to be an astronomical $23 billion, with a price-earnings ratio of 80, a mere six years after its founding. The company was already generating annualized revenue of $2.7 billion and profits of $286 million.
As of today, August 9, 2014, Google's market cap is $390 billion, with annualized revenue of $64 billion and profits of $13 billion. Google's market cap is the third highest of any U.S. company, with only Apple AAPL and Exxon Mobil XOM being bigger. Public market buy-and-hold investors have scored a "ten-bagger", earning a return of more than 1,000% over the decade or an equivalent of $100 invested then is now (August 9, 2014) worth about $880,000 [Sources: Amazon $250,000/2500 = $100 and $2.2 billion/2500 = $100.].
Google's IPO was unconventional, starting with a registration statement stating that the company was planning to raise $2,718,281,828, a number that confused the many journalists who hadn't memorized the number "e" to the ninth decimal place, as any serious quant would have. Famously, the letter from the Founders contained in the prospectus stated a corporate goal of "Don't be evil." Several years later, the company decided to honor this commitment by pulling out of China rather than agreeing to facilitate government censorship of search results.
Google bargained with its investment bankers to lower the fees that are charged, and paid 2.8% rather than the more normal 4% that a multi-billion dollar deal would normally face. Most IPOs, and almost all of those that raise $50-200 million, pay their bankers 7% of the proceeds. So at 2.8% for Google? This is the case of the rich 'get' richer!!!
Unlike most IPOs, the company used an auction called a "Dutch Auction" to sell shares. The merits of using an auction versus the more traditional way of selling shares, known as bookbuilding where you let investors submit their bids and the company gauges the sentiment of the offering to if investors' appetite is high or low and chooses to set the price of the IPO accordingly.
An auction, at least in theory, should deliver the highest possible price for the company while giving individual investors, rather than just the fund managers who dominate the bookbuilding approach, the opportunity to buy shares. But by the time Google launched the IPO, it had scaled back the size of the stock sale and lowered the offering price in the face of weak demand. After setting a price range of $108-135 per share, Google went public at only $85 per share, selling just 22.5 million shares and raising just $1.9 billion.
Adding insult to injury, the stock rose 18 percent on the first day of trading to close at $100.34 -- suggesting that the auction failed to achieve its purpose of setting a price as close as possible to the value investors would award the stock on the open market. The IPO was largely viewed as a fiasco.
Part of the reason that the offering raised less money than expected was simply bad luck: In the weeks leading up to the IPO, both the technology-laden Nasdaq market and shares of Yahoo YHOO, Google's top rival at the time, had been drifting downwards, sending a chill through the IPO market.
Two other factors, however, were even more important. The first factor was that the "road show" did not go well. When a company goes public, in an attempt to stimulate demand, the top managers and the investment bankers hired to take the company public typically spend up to two weeks going from city to city making presentations to institutional investors and answering questions. Google's management, however, refused to answer many of the questions that were asked. As a result, investors were less willing than normal to give the company the benefit of the doubt about its future profitability.
The second factor that lowered the offer price was the desire of the lead underwriters, Credit Suisse and Morgan Stanley MS, to sabotage the auction. Underwriters find the bookbuilding system (also known as a "status quo" system) to be very profitable, and most feel threatened by auctions. With an auction, the underwriters no longer have the power to allocate underpriced shares to their favorite customers. Consequently, the lead underwriters didn't want the auction to be viewed as a success.
They didn't want it to be a complete failure, however, since they were the lead underwriters. The underwriters told many institutional investors that they were likely to receive shares if they bid $85 per share. Not surprisingly, there were a huge number of bids for shares at $85, and relatively little demand at a higher offer price. Google was forced to accept just $85 per share.
Google and the selling shareholders thus raised less money than they could have in the IPO. But the offer was selling only 8% of the company, and the employees and others who held their shares were amply rewarded as the stock rose, and rose further, as profits increased from $286 million per year to $13 billion per year. Google has proven that targeted search advertising can be an enormously profitable business, which is why Facebook was able to get a valuation of $104 billion when it went public in 2012.
Snap is Going Public
Snapchat is about to make a 26-year-old one of the richest people on Earth
Here is an article taken from a Vanity Fair Magazine dated February 17, 2017, by Maya Kosoff:
Here's how much money CEO Evan Spiegel will make when Snap goes public.
Next month, Snapchat parent company Snap will begin selling shares on the public market in one of the most highly anticipated I.P.O.s for a tech company since Twitter went public in 2013. With Uber and Airbnb still raising funds and bolstering their bottom lines as they mull public offerings of their own, Snap is expected to serve as a bellwether for the otherwise slow-moving tech-IPO pipeline and a critical test of the public appetite for other unprofitable Silicon Valley unicorns.
When Snap does go public, the company said in documents filed with the SEC on Thursday, it will price its I.P.O. at $14 to $16 per share, with a total of 200 million Class A shares. At that price, the offering could value Snap at $22 billion -- an eye-popping valuation given its recent losses, but still on the low end of its private-market valuation.
CEO Evan Spiegel, 26, and co-founder Bobby Murphy, 28, stand to make about $5 billion off of their shares in the company when it does finally go public, beginning with the $256 million in stock that they each plan to sell when Snap debuts, according to the documents. Both Murphy and Spiegel are the biggest shareholders in the company, and together they will control about 89 percent of voting rights in Snap once it's a public entity. (Their third co-founder, Reggie Brown, was paid $157.5 million in a settlement with his estranged co-founders after he filed a 2013 lawsuit over being forced out of the company.)
For Snap's I.P.O., Spiegel took a page out of Facebook CEO Mark Zuckerberg's playbook, consolidating the executive power at the helm of his company ahead of its offering, and offering shares without any voting power, allowing Spiegel and Murphy to retain control even after selling huge amounts of stock.
"Our two co-founders have control over all stockholder decisions because they control a substantial majority of our voting stock.... We are not aware of any other company that has completed an initial public offering of non-voting stock on a U.S. stock exchange. We therefore cannot predict the impact our capital structure and the concentrated control by our founders may have on our stock price or our business," the filing said.
Co-founders Spiegel and Bobby Murphy each own 20 percent of Snap, according to the prospectus. Based on a valuation that could reportedly reach $25 billion at the time of the offering, each of them would own shares worth about $5 billion. The two co-founders currently plan to sell 16 million Class A shares -- which don't have voting rights -- when the company goes public, with the expectation that will sell more over time.
Snap's co-founders aren't the only ones who will make money by shedding some of their shares during Snap's public offering. Shareholders like Snap chairman Michael Lynton, formerly of Sony, will sell up to 54,907 Class A shares, and make as much as $878,512 during Snap's IPO. Others such as Benchmark partner Mitch Lasky will make up to $171 million. Snap's earliest investor, Lightspeed Venture Partners, could make as much as $74 million. Once Snap goes public, Spiegel will also receive 3 percent of its stock as an award.
It remains to be seen how the public market will react to Snap, and whether it will emerge as a highly valuable, diversified social-media company like Facebook, or one that does well on I.P.O. day but flops afterward. Some potential investors have already "reacted with fury" over Snap's decision to sell shares with no voting power.
In the S-1 SEC's official filing for an IPO on Thursday February 16, 2017, Snap told investors it "may never achieve or maintain profitability." Snap also revealed that it will spend $2 billion with Google Cloud over the next five years, and that boss Evan Spiegel got nearly $900,000 of security services (or stock options) in 2016. The company sought in the filing to raise $3 billion.
"We have incurred operating losses in the past, expect to incur operating losses in the future, and may never achieve or maintain profitability," the filing said. Other similar companies, like Twitter, have also included similar language in their public offerings, and look what happens to Twitter now.
As of this writing (2/17/2017) Twitter's stock closed at $16.62 (USD) a share -- the lowest it ever been traded in its four years as a publicly traded company. It debuted on November 7, 2013 at around $45 a share and on January 3, 2014 its shares were trading around $70 a share and about a month later it began to head south and never looked back ever since. Will history repeats itself for Snap? We'll see!
SNAP INC (SNAP) IPO
Company Financials per S-1 SEC filing of 2/16/2017:
Snapchat's revenue growth is astounding -- and so are its losses. Here are the highlights.
- Net revenue: $404.48 million in 2016, up from $58.66 million in 2015. That means the ephemeral messaging service grew revenue almost seven times in a year -- but its losses outstripped its revenue
- Net loss: $514.64 million in 2016, wider than $372.89 million in 2015
- Loss from operations: $520.39 million in 2016, wider than $381.73 million in 2015
- Usage: 161 million daily active users in the December quarter (60 million daily active users in the United States and Canada)
- Average revenue per user: $1.05 in the December quarter ($2.15 in North America)
- Time spent: 25 to 30 minutes a day
- Head count: 1,859 employees
Total Assets $1,722,792,000 (equates to Stockholders' Equity + Total Liabilities)
Total Liabilities $203,878,000
Stockholders' Equity $1,518,914,000
Pre-IPO Update: Snap tops expectations in pricing of long-awaited IPO:
Here is an article taken from Reuters dated: March 1, 2017 (one day to IPO)
By Lauren Hirsch (Reuters)
(Reuters) - Snap Inc priced its initial public offering above its target range on Wednesday (March 1, 2017), a source familiar with the situation said, raising $3.4 billion as investors set aside concerns about its lack of profits and voting rights for a piece of the hottest tech IPO in years.
At $17 a share, the parent of popular disappearing-messaging app Snapchat has a market valuation of roughly $24 billion, more than double the size of rival Twitter and the richest valuation in a U.S. tech IPO since Facebook in 2012.
The company had targeted a valuation of between $19.5 billion and $22.3 billion.
The book was more than 10 times oversubscribed by institutional investors and Snap could have priced the IPO at as much as $19 a share, but the company wanted to focus on securing mutual funds as long-term investors rather than hedge funds looking to quickly sell, the source said.
The source asked not to be named because the matter is confidential. Snap declined to comment.
The share sale was the first test of investor appetite for a social-media app that is beloved by teenagers and 20-somethings but faces a challenge in converting "cool" into cash.
Despite a nearly 7-fold increase in revenue, the Los Angeles-based company's net loss jumped 38 percent last year. It faces intense competition from larger rivals such as Facebook as well as decelerating user growth.
Snap priced 200 million shares on Wednesday night at $17, above its stated range of $14 to $16 dollars a share.
The sale had the advantage of favorable timing. The market for technology IPOs hit the brakes in 2016, marking the slowest year for such launches since 2008, and investors are keen for fresh opportunities. The launch could encourage debuts by other so-called unicorns, tech start-ups with private valuations of $1 billion or more.
Institutional investors bought the shares despite them having no voting power, an unprecedented feature for an IPO despite years of rising concerns about corporate governance from fund managers looking to gain influence over executives.
Snap is set to begin trading on Thursday on the New York Stock Exchange under the symbol SNAP.
Snap Initial Public Offering Procession
An IPO Procession Reminiscent of a Wedding Procession
Here is a chronically outlined ipo procession for Snap that reminiscent to a wedding ballyhooed procession which took place on Thursday March 2, 2017. The preparation and anticipation of an ipo mirror the wedding preparation and anticipation where things are orchestrated in an elaborate fashion; while the anticipation is high for both the guests and bride and groom and the same thing can be said for the ipo. Keep in mind that the similarity of the two doesn't end at the ipo. For a lot of companies it continues beyond the ipo -- Twitter comes to mind. Just as a splashy wedding is no guarantee of an enduring marriage, stock price of a hot and high demand at ipo says little about a company's long term prospect.
Mar 2, 2017 at 8:10 am ET
As we get set for the trading to begin, here are some facts that we know so far about the IPO:
Snap is the parent company of Snapchat, an ephemeral, or disappearing, messaging platform that is very popular among the millenials, age 18 to 24 years old. Snapchat is a one-to-one and group messaging app that lets users (particularly millenials) send photo, video, and text messages that disappear after several seconds. Roughly 150 million people use Snapchat every day, and they consume around 800 hours of video per second.
The History of Snapchat
Three Classmates Meet at Stanford University
Evan Spiegel, Robert "Bobby" Murphy, and Frank Reginald "Reggie" Brown IV, who was pushed out in 2012, met at Stanford University around 2010. At that time, Spiegel and Brown were juniors; while Murphy had graduated. Spiegel (who eventually didn't graduate) studied product design, Murphy studied mathematical and computational science, and Brown studied English. All were members of the Kappa Sigma fraternity, for which Spiegel served as social chair. At the Kappa Sigma fraternity that the trio got to know each other well and they started to hang out together throughout their college days.
In the summer of 2011 after they all left Standford, the trio began work on an ephemeral messaging app they soon dubbed "Picaboo." The co-founders built a prototype at the Los Angeles home of Spiegel's father, assigning a title to each: Spiegel, CEO; Murphy, CTO; Brown, CMO.
Soon after that things turned sour for the three founders and Reggie Brown was pushed out in 2012. In February 2013, Reggie Brown filed a lawsuit against his former co-founders. In September 2014, Reggie Brown was paid $157.5 million in a settlement to close off a 2013 lawsuit he had brought against other co-founders Evan Spiegel and Bobby Murphy, alleging that they had taken his original idea and run with it, pushing him out of the company without compensation in the process.
So Long, Picaboo. Hello, 'Snapchat'
The name "Picaboo," it turns out, is a name already in use by an older New Hampshire-based company that published and printed images. In September 2011, Spiegel, Murphy and Brown rebranded the app changing its name from Picaboo to Snapchat, added the ability to caption photos, and relaunched in the iOS App Store. They focused on the app's technological innovations more than branding and marketing to make the experience more organic and cool than traditional advertising.
Fast Forward
Snap priced 200 million shares on Wednesday night (March 1, 2017) at $17, above its stated range of $14 to $16 dollars a share.
Recent disclosures and decisions have led to more over/under speculation on its IPO than on a college football game. The book was more than 10 times (or more than 2 billion shares) oversubscribed by institutional investors, which means that the deep-pockets investors are fighting each other to get the shares. It also means that there will be a lot of these instutional investors who got shut out in the allotment process will try to be the first one in line to "snap" up the shares when it opens for trading for the first time. So look for an openning "pop."
Snapchat parent Snap valued at $24 billion after better-than-projected IPO pricing on Wednesday night, as investors clamored for a piece of the biggest technology IPO in the U.S. since Alibaba made its debut in 2014.
For Snap, the truth will be in advertising-Herd on the Street
Snap calls itself a camera company, but everything beyond the first line of its IPO filing suggests it is an advertising company. And estimating how much ad revenue it can generate is essential to determining its value.
Snapchat Founders Keep Control
In the IPO of Snap Inc., new investors will get zero votes while Evan Spiegel and Bobby Murphy, the Snapchat creators, will have 70% voting power; deep-pockets pre-IPO investors get less-powerful voting shares.
Snap CEO Paid More Than Rivals in Year Leading to IPO
Snap CEO Evan Spiegel took home more cash in the year leading up to the company's IPO -- without accounting for inflation -- than the CEOs of Match Group, Facebook, Pandora Media, ETSY, LinkedIn, Twitter and Square, ahead of all of those companies' public offering, a new study says.
In 2016, Spiegel's salary from Snap was $503,205, the study conducted by Equilar says. Facebook CEO Mark Zuckerberg received $483,333 in 2011, the study says.
Spiegel also received the largest CEO bonus, of $1 million, of any of these CEOs in the years before their companies went public, according to the study.
Will Snap's IPO Crackle or Pop?
To become the next Facebook instead of the next Twitter, Snap must accelerate user growth and keep monetizing its existing users.
Snap is asking a lot of its investors in its coming IPO, and that may lead them to push back.
Mar 2, 2017 at 8:19 am ET
The Steps Snap Took to Bolster Demand
Snap executives took some unusual steps that could help bolster demand for the shares.
In a regulatory filing ahead of the IPO, the company said roughly one-quarter (or 50 million shares) of its planned float of 200 million shares would be subject to a lockup of one year before that chunk could be sold.
The company planned to sell those shares (about 50 million shares) to a group of existing accredited deep-pockets investors, who got in before the IPO process began, people familiar with the deal said. Other [accredited] deep-pockets investors would be locked up for less time. Such moves could damp volatility by limiting the number of short-term stockholders known as "dealers" [who buy low sell high] who can jump in and out.
In the offering, which raised $3.4 billion, about 120 million of the shares sold went to roughly 25 investment firms, according to people familiar with the offering. The 50 million shares going to the group of existing [accredited] deep-pockets investors meant there were only about 30 million shares to be distributed among all other interested institutional investors, the people said.
Mar 2, 2017 at 8:36 am ET
Hard to Imagine Better Timing for Snap's IPO
Investors are hungry to buy just about any stock these days and portfolio managers are particularly starved for new supply of fast-growing shares of information technology companies.
Demand is evident in the pricing of Snap shares sold to big institutions at higher-than-expected value of $17-a-share.
Meanwhile, U.S. stocks are plowing higher and no group of S&P 500 shares are faring better than than information technology -- up 11% in just over two months, compared with a 7% advance for the benchmark.
"All stars are lining up for this thing. It couldn't be more ideal," said Josef Schuster, founder of IPOX Schuster, a research firm that specializes in creating indexes tied to IPOs.
Mar 2, 2017 at 8:57 am ET
Snap's Challenge: Monetize its Users Base
It seems pretty likely that Snap's IPO is going to look more like Facebook's than Twitter's, but from this point out, it's going to try and mimic Facebook's business, and not Twitter's.
The company has to expand its users base, while at the same time hiring away ad-sales reps from Facebook and Google, and then leverage those two planks to sell the advertising industry on its platform.
It seems that monetization of its user base is not something you could take for granted, especially not when you have to take the money from Google and Facebook. Which is what these guys now have to do.
Mar 2, 2017 at 9:03 am ET
But How Much Will It Pop?
Remember that a big chunk of Snap Inc.'s shares (about 50+ million shares) will be going to buyers who can't sell them for at least a year.
The lock-up could damp volatility by limiting the number of short-term stockholders who can jump in and out.
In a regulatory filing ahead of the IPO, the company said roughly one-quarter of its planned float of 200 million shares would be subject to a lockup of one year before that chunk could be sold.
The company planned to sell those shares to a group of existing accredited deep-pockets investors, who got in before the IPO process began. Other institutional investors would be locked up for less time.
Mar 2, 2017 at 9:18 am ET
Ceremony Surrounds Each NYSE IPO
It's one of the most cherished and orchestrated rituals of American capitalism: an initial public offering at the New York Stock Exchange.
For companies going public, the day begins with breakfast in a palatial ballroom upstairs from the NYSE trading floor. NYSE parent company Intercontinental Exchange recently finished a two-year, multimillion-dollar renovation of the ballroom and other event spaces in the historic building at the corner of Wall and Broad Streets in lower Manhattan.
NYSE officials present the firm going public with a certificate identifying it as a listed company on the 224-year-old exchange. And, of course, the firm's leadership rings the 9:30 a.m. opening bell.
Mar 2, 2017 at 9:21 am ET
Here is Why Snap's Shares Could Run When They Open
There's a lot of pent-up demand for new tech listings, which means Snap shares could run when they open on the New York Stock Exchange later today.
Ahead of Snap's IPO, there hadn't been a U.S.-listed tech IPO since December when Trivago NV debuted, according to Dealogic. The hotel-search company priced its IPO below its expected range, though shares did rise in its first day of trading. Last year was also the slowest year for tech IPOs in terms of money raised since 2009, Dealogic data shows.
Mark Hesse, analyst at Nuveen Asset Management who was considering buying shares of Snap ahead of its IPO, said he expects Snap could pop right out of the gate based on this hunger for tech IPOs. Mr. Hesse said he also is upbeat on Snap's business.
"There's a real opportunity to grow," he said, referring to Snap's advertising revenues.
Mar 2, 2017 at 9:23 am ET
What Happens Before Snap Starts Trading?
Note that even though Snap executives will be ringing the opening bell in about 10 minutes from now, trading in Snap won't begin right away. First there's an auction process where institutional investors who didn't get in on Snap during the pre-IPO phase try to be first in line to buy Snap's publicly traded shares. Their demand is met by sellers of Snap shares, including the bank(s) selected as the so-called "stabilizing agent," which Goldman Sachs is the leader among them.
This auction procession is overseen by a firm called the designated market maker, or DMM, whose lead trader stands on the NYSE floor, surrounded by a huddle of floor brokers representing big buyers and sellers.
Each company listed on NYSE gets to pick its DMM ahead of the IPO. There are now six DMM or "specialist" firms active on the NYSE floor, down from dozens in decades past. Snap's DMM will be Global Trading Systems, a New York-based high-frequency trading firm that acquired the NYSE floor operation of British bank Barclays PLC last year.
The DMM's lead trader shouts out prices so the floor brokers know how the auction is coming along, while in a parallel process, an algorithm matches buyers and sellers electronically. The auction ends when the DMM, working with the stabilizing agent, settles on the opening price. Then the shares begin trading. NYSE officials say this usually happens by around 10:00 a.m., although for some high-profile IPOs - such as those of Twitter Inc. and Alibaba Group Holding - it can take a couple hours for trading to start.
Mar 2, 2017 at 9:25 am ET
Quiet on the Floor
Right now it's pretty quiet on the floor of the New York Stock Exchange.
The exchange asked all non-necessary personnel to stay off the floor because about 100 Snap employees and friends are expected to be here for the bell ringing. Snap co-founder and CEO Evan Spiegel will ring the bell, but then he'll drive over to Goldman Sachs headquarters to watch the traders there open the stock in their role as stabilization agent.
Mar 2, 2017 at 9:27 am ET
Snap Is Wildly Uncertain for Investors
Morningstar analyst Ali Mogharabi launched coverage of Snap late Wednesday, warning that there's a lot of uncertainty around the name, particularly with the high price of the shares.
The analyst writes: "The IPO price is modestly above our fair value estimate and we would recommend a wider margin of safety before investing in this very high uncertainty name." He adds: "we are not yet convinced about the firm's ability to generate excess returns on capital over the next decade."
Morningstar's doubts come from the fact that, "there is no guarantee that a larger portion of new digital ad dollars will flow to Snap." In particular, they believe Facebook and Alphabet's Google, which have more developed ad platforms, are likely to keep raking in more of that money.
Still, the short-term traders who will be jumping into the stock when it begins trading Thursday may not be thinking that far down the road.
Mar 2, 2017 at 9:40 am ET
How Unusual Is Snap's Share Structure?
First, Snap IPO has no voting rights. That is very unusual. How unusual? Dealogic does not tracked that data point, so nobody can say for sure, but the data provider says it is very unusual.
Dealogic does track dual-class share structures, which Snap has. How unusual is that? Only 14% of IPOs since 2010 have had dual class shares. But that does rise for tech IPOs. According to Dealogic, 24% for tech IPOs .
So Snap is in the minority but it's not unusual among Tech IPOs.
Mar 2, 2017 at 9:43 am ET
Watch Shares of Twitter, Facebook on Day of Snap's Debut
As the stock market opens, keep an eye on shares of Twitter and Facebook.
While Snap called itself a camera company in its regulatory filings, many investors looking at the deal scoffed and said it remains a social media company in their eyes.
Some traders and investors said to watch to see if any "pairs trades" are placed today in relation to Snap and Facebook or Twitter.
A pairs trade is a strategy that involves taking a long position and a short position in two companies that are in the same sector and sometimes can be viewed as competitors (for instance, a pairs trade could be taking a long position in Visa coupled with a short position in MasterCard).
Alternately, some traders said to watch for investors who believe in Snap's ability to grow users (and revenue per user) who may be dumping Twitter's stock in favor of scooping up shares of Snap.
Mar 2, 2017 at 9:44 am ET
Facebook Lower, Twitter Higher as Snap Auction Gets Underway
Other social-media shares are mixed as Snap Inc.'s auction process gets underway.
Facebook Inc., owner of Snapchat rival Instagram, is down 0.2%. Twitter Inc., whose growth trajectory Snap hopes to avoid, is up 0.5%. The Global X Funds Global X Social Media ETF (of course there is one) is down 0.8%.
Mar 2, 2017 at 10:03 am ET
Snap's First Indication: $21 to $23
The first pricing indication (or rumor) for Snap has leaked and crossed the wire: $21 to $23 a share.
Mar 2, 2017 at 10:08 am ET
For Those Keeping Score...
Snap Inc's initial pricing indications point to a first-trade pop of between 24% and 35%.
The leaked rumor initial price range laid out in the frantic auction procession is $21-$23 compared with the IPO price of $17.
Mar 2, 2017 at 10:11 am ET
It May Take a While for Snap to Start Trading
The stock market is now open, but don't expect Snap shares to start trading right away as the "specialists" are frantically processing the buy/sell incoming orders, mostly from the institutional investors who got shut out at the pre-IPO process.
Basically, at this point specialists must work to match up people who want to buy the stock at the open with those who want to sell. This price-discovery process takes time.
For smaller IPOs, it can be fairly smooth, with new companies starting trading within the first half hour of the trading day. The bigger the IPO, and the more hotly demanded, the longer this process can take.
One trader on the NYSE floor predicted Snap doesn't start trading until at least 10:30 or 11 a.m.
That wouldn't be unusual. Alibaba shares, for instance, didn't open trading until nearly noon (the first trade was 36% above Alibaba's IPO price). Twitter took til nearly 11 a.m. to post its opening trade (which was 73% higher than its IPO price).
Mar 2, 2017 at 10:17 am ET
Keeping a Watchful Eye on the Auction Procession:
Snap's Updated Price Indication: $22 to $24
As the opening auction procession for Snap shares continues on the exchange floor and elsewhere, another pricing [rumor] indication has leaked across the wire: $22 to $24 a share.
Mar 2, 2017 at 10:28 am ET
Snap Sold 20% of Its Shares Outstanding
Snap floated about 20% of its outstanding shares. On average, tech companies that have gone public since 2010 have sold 19% of their shares in their IPO, according to Dealogic. Facebook sold 20%, Alibaba sold 15%, Twitter sold 15% and Google only 8%.
Mar 2, 2017 at 10:35 am ET
Oh, Snap! Not so Snappy!
Investors are still waiting for shares of Snap Inc. to launch into the secondary market and how much longer?
Mar 2, 2017 at 10:58 am ET
Snap Decision: Investors Bid Up the Wrong Snap Shares
Some trigger-happy buyers may end up pretty disappointed with their Snap purchase... if they're among the traders that have snapped up shares of Snap Interactive Inc. today or since Snap made news about their IPO-bound announcement.
Snap Interactive, ticker STVI, is up 18% at the moment. The problem is, Snap Interactive is not Snap Inc. It doesn't own Snapchat. And it isn't debuting on the New York Stock Exchange.
Snap Interactive, a public company since 2006, operates dating apps. It shares have tumbled from above $50 in 2012 (adjusted for a reverse split) to under $5 in January, but they've shown some unusual price movement lately since Snap Inc made news that it's going public. This is fairly to say that it's not a co-incident and suggests that almost certainly thanks to investor confusion about what the company does exactly. They're confused thinking they're buying the right Snap.
Folks, this is called "animal spirit" at its finest!
Mar 2, 2017 at 11:08 am ET
Party Poopers: Snap Doesn't Plan Big IPO Party for Employees
Snap hasn't organized any company parties to celebrate the company's public offering for workers in San Francisco or Los Angeles, employees say.
Instead, some employees watched the opening bell from home and individual departments have made dinner reservations.
Snap has not made any company-wide warnings to employees about flashy celebrations of new wealth, an employee says, despite a small protest outside the company's offices over rising rents in the artsy beach town of Venice where Snap has its largest offices.
Mar 2, 2017 at 11:13 am ET
Meet A Big-Time Snap Bear
Trip Chowdhry is a tech analyst and co-founder of Global Equities Research.
Mr. Chowdhry is also a Snap Inc. bear.
He writes this morning that that the hype around the disappearing-photo app company has the hallmarks of duds Fitbit Inc., GoPro Inc, Zynga Inc., Groupon Inc. and Twitter Inc.
Like all of the above, he says that Snap will likely beat analyst estimates for a few months, giving early investors cover to exit at higher prices. Then it could come crumbling down.
He writes that, for one thing, the disappearing app niche is assailable by rivals such as Facebook Inc.'s Instagram:
"The popularity of SNAP is based on a set of filters and the disappearing act of pictures, which is a flimsy foundation. Instagram can easily include these features and given its higher number of users; it will only get more popular if it does that." He goes on that it would be wise to avoid buying this stock now or else buying and getting the heck out while the going is good: "SNAP is not a multi-year story. The investing horizon should be in months not years.
Let all the hot air go out, let the private investors cash out, let's see how the Industry evolves in 1.5 years...and then if all looks good, then maybe invest in SNAP."
In a research note earlier this week he was even more direct:
"Speculative investors, if [they] decide to play the IPO, it will be prudent to get out of it within the 1st hour."
Mar 2, 2017 at 11:20 am ET
The Much Ballyhooed IPO
Snap Opens at $24 a Share
Sigh of relief .... Snap Inc. has begun trading.
The opening price: $24 a share. That's an immediate 41% pop for the deep-pockets institutional IPO investors who paid $17 last night.
Mar 2, 2017 at 11:21 am ET
Snap's Market Value at the Open: $33 Billion
And we're off! Snap's first trade hits that tape at $24, up 41% from its $17 price. It traded up 43% recently.
Snap's opening price gives the company market valuation of $33.3 billion on a diluted basis.
Mar 2, 2017 at 11:47 am ET
How Trading Volume Stacks Up So Far
Snap's trading volume has been brisk in the first hour as a public company.
Roughly 84.9 million shares have changed hands as of 11:42 a.m. ET. That's more than double the 36.4 million shares of Apple traded all day yesterday, on Wednesday.
Of course, this is no normal day for Snap, so volume is expected to be elevated. By comparison, here's how some other recent high profile tech companies stacked up on their first days. For Facebook and Alibaba, those days remain the highest volume ever.
Snap hasn't surpassed any of these tech companies yet, but the day is still young.
Mar 2, 2017 at 12:10 pm ET
Orderly Trading So Far
Despite the volume, the stock is trading in an orderly fashion. Snap shares have gone as high as $25.42 and as low as $23.50, but the trendline -- so far, is up. Already, 117 million shares have traded hands.
Even at the low, hit a few moments after the shares started trading around 11:20, the price represents a healthy pop from its $17 per share IPO price.
An average based on how many shares traded at each price point, called VWAP, is at $24.62.
Mar 2, 2017 at 12:28 pm ET
What's Snap Actually Worth? One Analyst Says $10 a Share
In the face of a raging bull on Snap shares, Brian Wieser, an analyst at Pivotal Research Group, isn't big on Snap at the moment. He initiated coverage with a sell rating, and put his price target at $10 a share by year end, less than half of where it's currently trading. And even that's a stretch, he said.
Why no love for the hottest tech IPO in years? He says: "It is significantly overvalued given the likely scale of its long-term opportunity and the risks associated with executing against that opportunity. Significant ongoing dilution from share-based compensation will likely represent an additional negative consideration for the stock."
While the company continues to innovate and offers investors a piece of its business expansion, it's facing "aggressive competition" from larger firms, and its core user base isn't growing particularly quickly, Mr. Wieser says.
On top of that, "Investors will also be exposed to what appears to be a sub-optimal corporate structure operated by a senior management team lacking experience transforming a successful new product into a successful company."
"Snap Inc. is becoming a public company just as its user growth and monetization growth rates are beginning to meaningfully slow," he says.
The limitations on stock gains echo what some other analysts have been saying:
The increase in daily active users is slowing. That means growth will be driven by monetization, which is likely to be difficult, per consultations with ad buyers. Facebook and Google aren't just rivals. They're much larger rivals. The company is priced at a very high valuation, which limits room for error.
March 2, 2017 at 1:30 pm ET
Snap Hits Fresh High
About two hours after share started trading, Snap is setting fresh highs, hitting $25.69 moments ago. Already, more than 150 million shares have changed hands. Snap's volume-weighted average price for the day is now $24.76.
Mar 2, 2017 at 3:06 pm ET
Snap Crosses $26 and then Pares Gains
Shares of Snap touched a new intraday high in afternoon trade, but have since pared their gains. The stock hit as high as $26.05. It was recently at $25.18.
A total of 186.5 million shares had traded just after 3 p.m. ET, topping Twitter's total first-day volume but lagging Alibaba's and Facebook's.
Last Updated Mar 2, 2017 at 4:00 pm ET
Snapchat's Roaring IPO comes to a Close
Here is a wrap up with a few last thoughts:
- Snap closed at $24.48, up $7.48 or 44% from its offer price of $17. It's first day pop was bigger than Alibaba's, Facebook's and Google's, but smaller than LinkedIn's, Twitter's and Yelp's.
- It opened at $24, up 7.00 or 41.2% at 11:19 AM.
- Snap was the most actively traded US stock today, with more than 215 million shares changing hands today.
- At its high today, it was up $9.05 or 53.2%, to $26.05.
- Best first day pop for a U.S.-listed IPO that raised at least $1 billion since LendingClub's December 2014 IPO (LendingClub rose 56% the day it went public.)
- At the close, its market cap is $28.33 billion based on the 1.157 billion shares count in the SEC S1 filing.
- Snap's market value increased by nearly $9 billion on its first day of trading.
The After Thought
Mar 2, 2017 at 6:30 pm ET
Meet the Company That Bought Snap at 98 Cents a Share
A big winner from Snap's initial public offering that has gone (somewhat) unnoticed is venture firm IVP.
Unlisted in Snap's registration statement, the firm led an early investment round in the company at an adjusted $0.98 per share. In time, the firm pumped $110 million into the company for nearly 37 million shares, worth about $900 million on paper at the close of the first day of trading. The firm has shied away from discussing Snap with the press since its original June 2013 investment. But in an interview on Thursday, general partner Dennis Phelps disclosed the size of his firm's stake and said it declined to sell shares in the IPO.
Snap is a "rare breakout platform" that he thinks is "on track to rival Facebook in the new social [media] order."
That may be a bit aggressive considering Snap is still just a tenth of Facebook's size in terms of the number of daily active users, but Mr. Phelps remains bullish as he says Snap will prove one of the few places where ad buyers will be able to target millenials.
And here is an "eat crows" feel bad story:
This Guy Ignored a Get-to-Know You Email from Snap's Co-Founder in 2012
Duh! Even the smart money misses a good deal once in a while.
Venture investor Chris Sacca, an early Google employee that later made a fortune buying up Twitter shares, took the opportunity of Snap's initial public offering on Thursday to eat a little crow.
Mr. Sacca tweeted an email sent to him in November 2012 from Snap co-founder Bobby Murphy, inviting him out for lunch.
"We're currently living and working out of a house in the Palisades....I'd love to get your opinion on LA vs the Bay and building out a company..." wrote Mr. Murphy.
That was around the time Snap raised its Series A round of financing at an adjusted $0.11 per share.
It closed on Thursday March 2, 2017, up more than 200 times from that price. Namaste! .... Eating crows! Eating crows! Eating crows!
What is an option?
As the word implies, an option gives you a choice or option to do what you wish to do with the subject. In other words, an option gives you the right -- but not the obligation -- to do something. In the financial world, an option gives you the right -- but not the obligation -- to buy or sell a stock, futures, a commodity or other investment instruments. A stock option is a contract between two parties in which the stock option buyer purchases the right (but not the obligation) to buy 100 shares of an underlying stock at a predetermined price from the option seller within a fixed period of time.Think of an option as a contract betweem two parties -- usually between a buyer and a seller. Two parties agree on the term of the deal and signed the agreement of the deal.
You may have heard in the corporate world, a company pays executives compensations in the form of a stock option. This is a common practice in the corporate world. The reason being this common is to encourage executives to make the company's stock price goes up by running the company more profitably.
What usually happens is that each year a company offers its employees -- usually executives and board members -- shares of stock at a specific price and those shares have to be exercised at/or before a certain date -- usually the year-end date (right around December) or sometimes several years down the road, depending on how the company structures its option contracts with its [executive] employees.
There are distinctions between a corporate stock option and a financial stock option. A stock option in the corporate world cannot be bought and sold in the secondary market; while a stock option in the financial world can be bought and sold (or traded) freely in the open market. For the rest of the description, we won't discuss the corporate version of the stock options -- but only the financial version.
Option Contract Specifications
All options [with the exception of the corporate version] fall into two broad categories: call and put options. In a simplified term, a call option is a long option -- you're betting the option will rise so that you can profit from the rising option. On the other hand, a put option is a short option -- you're betting the option will fall so that you can profit from the falling option. It's a little tricky and confusing when dealing with these two instruments. Hopefully the following descriptions will help you understand better.
The following terms are specified in an option contract.
Option Type
The two types of stock options are puts and calls. Call options confer (give) the buyer the rights to buy the underlying stock while put options give him/her the rights to sell them.
Strike Price
The strike price is the price at which the underlying asset is to be bought or sold when the option is exercised. Its relation to the market value of the underlying asset affects the moneyness (price movement) of the option and is a major determinant of the option's premium.
Premium
In exchange for the rights conferred by the option, the option buyer have to pay the option seller a premium for carrying on the risk that comes with the obligation. The option premium depends on the strike price, volatility of the underlying asset, as well as the time remaining to expiration.
Expiration Date
Option contracts are wasting assets (meaning they will expire) and all options expire after a period of time. Once the stock option expires, the right to exercise no longer exists and the stock option becomes worthless. The expiration month or period is specified for each option contract. The specific date or period on which expiration occurs depends on the type of option.
For instance, stock options listed in the United States expire on the third Friday of the expiration month for the monthly contracts. For shorter contracts, say, weekly contracts, they expire on every Friday. The length of the contracts are varied from one week to as long as two years for certain stocks and they are set by the exchanges.
Option Style
An option contract can be either American style or European style. The manner in which options can be exercised also depends on the style of the option. American style options can be exercised anytime before expiration while European style options can only be exercise on expiration date itself. All of the stock options currently traded in the marketplaces in the United States are American-style options.
Underlying Asset
The underlying asset is the security which the option seller has the obligation to deliver to or purchase from the option holder in the event the option is exercised. In the case of stock options, the underlying asset refers to the (100) shares of a specific company. Options are also available for other types of securities such as currencies, indices and commodities.
Contract Multiplier
The contract multiplier states the quantity of the underlying asset that needs to be delivered in the event the option is exercised. For stock options, each contract covers 100 shares of a stock; for 1 corn futures contract contains 5,000 bushels of corn; for 1 crude oil contract contains 1,000 barrels of crude oil, and so on, and so forth.
The Options Market
Participants in the options market buy and sell call and put options. Those who buy options are called holders. Sellers of options are called writers. Option holders are said to have long positions, and writers are said to have short positions.
Explanation: Call and Put Options
A call option gives you the right to buy the corresponding stock or futures contract at a fixed price until the expiration date. So if you own the right to buy a stock, you're said to be going long on a stock. You hope that the stock you own the right to will appreciate in value so that you can exercise your option.
You Can Buy or Sell "Call" Options
To buy a call option means that you're buying the right to own that stock in the future at a specific price. So you the buyer of the call option can decide to exercise option at any time prior to the expiration of the contract. Since you're the buyer, you must pay the upfront amount called the option premium to the seller. Remember that buying a "call" option doesn't require you to currently own shares of the underlining stock (unlike selling a "call" as you'll see in a moment).
To sell a call option means that you're giving someone else the right to buy the stock in the future at a specific price.
So you have to have the underlining stock (usually 100 shares per option) in your posession ready to deliver that stock to the buyer as soon as the buyer decides to exercise his/her option. You cannot sell a call option if you don't have that stock in your possession. This is the same as if you want to sell any items (such as clothes, foods, car, jewelries, etc); you have to have those items for sale in order for you to be able to sell those items. Call option applies to the same principle.
Actually, you can still sell call options without owning the stock by using leverage and this is for options trading levels 2 and up. But for now just think that you have to have stocks in your posession in order to sell calls. Once you're comfortable trading options for awhile you'll know how to use leverage to sell calls and puts. But for this tutorial is to get you familiar with the basics and getting you started trading covered calls and secured puts. See my other tutorials on covered calls and cash-secured puts.
You might ask: why would anyone buys a stock and turn it around and allow someone to profit from your stock that you think that it is going higher? Well, the majority of investors are long term investors and they usually don't turn around and allow other investors to profit from their investment. But a small number of investors do buy stocks for the purpose of trading to maximize their investment. This is called "covered call" writing -- you buy stocks and turn around and sell the right to own those stocks to someone else; you're giving someone else the right to own your stocks.
In options, you can sell calls that you don't own as well, and this is called naked call. Don't worry too much about these two terms that I'm throwing at you because it is not significant right now. These terms are being used as options strategy that you can employ to maximize your profits. There are at least 128 options strategies available for trading and each strategy is tailored to specific play; for example, a bear put spread is an option strategy that allows you to profit when you think the stock has a neutral or bearish outlook within the time expiration. Other options strategies are: call credit spread, iron condor, bear put spread, bear call spread, bullish butterfly, half and half, straddle, strangle, leap, leap call, and more. My premium members have accessed to all these advanced strategies and much much more.
A put option is quite the opposite of a call option. A call option is an option to go "long", whereas a put option is an option to go short (or sell short) -- betting it to go down.
A put option gives you the right to sell short the corresponding stock or futures contract at a fixed price until the expiration date.
In a call option you have to have the stock in your posession or enough money in your account (if you're a seller), ready to deliver to the buyer. But in a put, you the short seller do not have to have shares of stock but rather borrow shares of stock from the brokerage firms and pay them back when the options are settled. Again, you don't have to have stocks in your posession in order to sell puts or selling short; however, you have to have enough money in your account to cover the contract involved in the agreement.
You Can Buy or Sell "Put" Options
In general, to short a stock you borrow shares from the brokerage and sell those shares immediately and wait for the stock to drop and buy back those shares in the open market when the stock price is lower than the price at the time you sold the shares. Your hope is for the stock to go lower at any time prior to the expiration date and buy the stock back at a lower price and pay the broker back and profit the difference.
Let's think about this principle a little bit: first, you think that the stock is going to go down. Second, you want to profit from the down side move of the stock. And third, you don't own the stock or know anybody that own shares of that stock. So what do you do? If you have a position on that stock, you better sell that stock very quick or else you're going to lose your money on that holding if your prediction is correct. So if you don't have a position in that stock but you definitely want to have an action on that stock. What do you do?
An answer to that question is to borrow shares of that stock from a broker since the broker has his/her clients holding on to that stock. Once you borrowed the shares you turn around and sell those shares right away and keep the proceed in the broker's account and wait for the price of the stock to drop so that you can buy those shares back and return those shares to the broker so that the broker can credit his/her clients' shares to the original record.
His/her clients think that the stock is going to go up but you think that the stock is going to go down. A difference of opinion. Either the clients are right or you're right: both of you cannot be right.
So if you think that you're right, why not try to profit from someone else mistake? In this case, the clients who think that the stock is going to go up and so you are going to try to eat their lunches. So the clients own the shares and you own nothing, but you want an action on that stock. So you go to your broker and say, "Listen, fella! -- your clients have shares of this stock, can you lend me those shares and I'll pay them back those shares when the stock price drops."
Do you see what's going on here? You borrow the shares from your broker's clients and turn around and sell those shares in the open market. In reality, the borrowing and selling of the borrowed shares exist only in one transaction via the broker's account. Think of it as a three-parties transaction account where a broker (party 3) steps in and acts on behalf of either the shareowner(s) (party 1) and the short seller (party 2) to transact the deal.
For example, in the case of a short selling, a broker steps in and acts as a shareowner using his/her clients' shares to allow the short seller (or party 2) to sell short on those shares without the knowledge of the shareowner(s). The shareowner(s) could careless what their broker do to their shares of the stock as long as they still own those shares and can liquidate them at any time.
So the broker steps in and allows you, the short seller, to sell someone else shares without the knowledge of the shareowner(s). Meanwhile, you, the short seller, wait for the price of the stock to drop so that you can buy those shares in the open market at a lower price and then return those shares back to the broker's clients and pocket the difference; while the broker's clients had no knowledge of the transactions behind the scene and still lose money regardless you borrow those shares from them or not. They still lose money on their long holding because they were wrong and you were right.
So from the clients' perspective, they don't care whether you borrowed their shares of the stock or not -- it made no difference -- they still lose money. So keep this 'short-selling' principle in mind when you're dealing with put options. Now what happens if you're wrong and the clients are right? Well, the clients will eat your lunches -- the same way you eat the clients' lunches if you're right and the clients are wrong. Another way of saying is that you'll lose money and the clients will gain money.
You might wonder that no brokers will let you borrow their clients shares to sell because you're not a big shot wealthy person. Fear not; brokers will love to take commissions from you. The more shortsellers there are the more money brokers make through commissions because shortsellers are very active traders while long position investors rarely buy or sell; and thus generate less commisssions for brokers.
Short Selling Folklore
Okay, now that you know how short-selling works, it's time for a short-selling folklore. Do you know who created the principle behind short-selling that is being widely used throughout the world? Was it some geniuses mathematicians? Or was it some Noble Prize winning economists? Or was it some Ivy League academic professors? No, none of the above, and here's a folklore story:
A guy opened a retail brokerage firm and placed ads to encourage investors to buy stocks so that the brokerage retailer can make money by charging fees when investors buy and sell stocks. Mr. and Mrs. Jones came in and invested their lifelong fortune -- a lot of money -- in one company [presumably on a very solid and stable company], paid the fee to the broker and walked away. Meanwhile, the broker was very happy to have the Joneses as the client and hoped that sooner or later the Joneses will want to diversify and break up their large holding into different investments, creating more fees for the broker. So the broker waited, waited, waited, and waited, and waited! Five, ten years gone by and the Joneses was oblivious to the broker's wish and stayed put with their holding. [The length of time in five, ten years are fictional]
The broker got restless and decided to call the Joneses to encourage them to diversify their holding. But the Joneses didn't take the broker's advice and kept all of their holding in one company. The broker became even more restless and tried to come up with all kinds of tricks to make the Joneses break up their holding and diversify. One trick after another and the Joneses didn't budge and fell deaf ears to the broker. The broker wondered, "There got to be a way to make money off the Joneses."
If the pattern continues there will be 60, 70, 80, 90, 100 or more years before the Joneses sell their holding [the length of time are fictional.] There got to be a way to profit from the Joneses. Lo and be hold, the broker wondered to himself, "Why not let someone else sell the Joneses' holding if the Joneses don't want to sell? And charge the sellers fees instead." "Hello!, wake up fool!," the broker said to himself after realizing a clever way to beat the Joneses. "Finally, I can eat the Joneses' lunches!," the broker cheered to himself. [End of the folklore]
Now let's continue talking about put options. Put options follow the same principle as short selling by letting you borrow shares and pay them back when you settle your options contracts. But instead of shorting the stock, you're just buying/selling the right to short that stock -- and not shorting it -- just buying/selling the right. There's a difference. The amount you must pay (if you're a buyer) or the amount you collect (if you're a seller) for the right to short the stock is called the option premium. The idea is the same but less expensive because you use leverage to control huge position.
Buying "Put" Options
To buy a put option means that you're buying the right to short the stock (or buying the right to sell short the stock) by paying an option premium to the put seller. The keyword is selling short -- you're betting that the stock will fall below the strike price. So here, you need to distinguish the difference between plain 'selling short' the stock and 'selling put' options. There's a difference: in plain selling short you pay the full price of the stock whereas in options you only have to pay the premium price (also commonly called option premium) of the stock, because you're just buying the right to short the stock.
Selling "Put" Options
To sell a put option means that you're giving someone else the right to short the stock and collecting the option premium from the put buyer. Again, here you think that the stock is going to go up and you want to own that stock but you don't want to pay the full price of the stock; so you sell put options and collect option premium from the buyer. So selling put allows you to maximize your profits by reducing your upfront cost because you receive the option premium from the buyer. Selling put is a great strategy for long term investment--that is, if you want to own that stock that you think is going to go up long term wise.
Summary
An option gives you the right -- but not the obligation -- to buy or sell something. Buyers pay a non-refundable (deposit) called option premium amount to sellers in return for time to decide whether or not to conclude the deal. Sellers must be ready to sell [the subject] as soon as the buyers ready to buy at any time up to the expiration date.
The option contains a strike price, which is a set price you must pay when you decide to exercise your option at/or before a specific date in the future stated by the option contract.
Buyers and sellers can decide whether or not to go through with the deal any time up until the option's expriration date.
An expriration date is a date the option to be expired or ceased to exist. Only certain expriration dates are available. They're chosen by the exchange which lists the option.
In the meantime, the seller must always be ready to sell the stock or futures contract as soon as the buyer decides to buy. For this commitment, the seller receives money up front from the buyer called option premium.
Nearly all stock options are for 100 shares of a stock. Every futures option is for one futures contract (which represents a large quantity of a commodity; for example, for 1 corn futures contract contains 5,000 bushels of corn; for 1 crude oil contract contains 1,000 barrels of crude oil).
Remember that in options you can buy or sell calls or puts. Buying calls or puts will cost you money in the amount of premium you have to pay to the sellers, while selling calls or puts will earn you money from the premium you receive from the buyer.
There are at least 128 options strategies available for trading and each strategy is tailored to specific play. So these options strategies basically cover every possible market angles or outlooks or scenarios. You pick a certain strategy or combinations of strategies to play to fit your market outlook.
Options are great investment tools that let you delay buying or selling a stock or futures contract. They allow you to make large profits without having to tie up a lot of your own investment money.
Options Chain
The cost of of an option depends a lot on what's happening with the stock or futures contract involved. The more time there is until expiration, the larger the option premium you must pay the seller since the longer the time the more chance of a stock to go up in value.
Also, the greater the difference between the current stock price and the strike price, the greater the buyer's price (called option premium). For example:
| Strike | Symbol | Last | Chg % | Bid | Ask | Volume | Open Interest |
| $15.00 | T100918C00015000 | 7.45 | 0.23 | 7.40 | 7.50 | 45 | 175 |
| $25.00 | T100918C00025000 | 3.45 | 0.04 | 3.40 | 3.50 | 106 | 694 |
XYZ stock is selling on the NYSE at $22 a share today:
- Option 1 (ticker: T100918C00015000): Gives you the right to buy XYZ stock at $15 a share. option premium: $7.50 (the asking price. See the options chain above).
- Option 2 (ticker: T100918C00025000): Gives you the right to buy XYZ stock at $25 a share. option premium: $3.50 (Ask column. See the options chain above).
Since you would rather have an option to pay $15 for a $22 stock instead of $25 for a $22 stock, option 1 is more valuable.
As a result, it costs more to buy option 1 than to buy option 2 ($7.50 for option 1 as appose to $3.50 for option 2).
To give you a better idea of what options price listing looks like, try Google a term "option chain AT & T" or put in any other company a stock symbol in the place of AT & T and you'll get an option chain for that company's stock.
A very good place to hang around is Yahoo Finance website where you can find a lot of stock and options information. On Yahoo Finance website, you can find options chains for any stock that has options. If you sign up for a free account, you can create portfolios and keep track of the stocks or options you're interested, even if you don't invest in them.
I, personally, have a free Yahoo Finance account where I basically create lots of portfolios, creating one portfolio for every stock I am interested in so that I can keep track of what that particular stock is doing. I have to admit, I have about 250 portfolios in my free Yahoo Finance account, with each portfolio containing one stock that I am watching and keeping track of it. I don't put more than one stock in any of my portfolio because the name of the portfolio tells me what kind of the stock I am watching for.
For example, I created a portfolio called: "Biotech AVEO 2.70 on 7-3-17" to remind me that this biotech stock was trading around $2.70 a share so that I know how I've done if I had bought it on that date. Most of the times, I name my fortfolio to be very long and very descriptive to reflect the catalyst of the stock so that I know what to expect. All of my "watch" portfolios have names identifying stock symbol, coverage stock price on date the coverage was made and some short description of the catalyst.
This way, months or years later, I can go back to see how my "fantasy" portfolios have done with its catalyst by just take a glance at the portfolio names and scan through the list of portfolios in a quick run through without wasting time going into each individual stock. It saves me tremendous time.
Sometimes, I name my fortfolio to be very long and very descriptive about its catalyst to remind me of certain events that might cause the stock to move dramatically, such as clinical trials are due to report or some court rulings are due in the future so that I can anticipate to play options on those events using advanced options strategies where I play options on stocks that are moving dramatically up or down.
I usually play directions and I don't care which direction the stock is moving as long as the stock is moving dramatically. This options play involves advanced strategies. I don't want to confuse beginners right now by explaining the strategies but maybe in the future tutorials I will lay them out.
Another very good website is called investing.com where you can signup for a free account and get access to all kinds of investing information, such as charts, technical and fundamental analysis, stocks screener, news alert on stocks, stock watch, etc.
In the option chain listing you'll see:
Strike Price, which is a set price you must pay when you decide to exercise your option at/or before a specific date in the future stated by the option contract.
Symbol is the unique symbol for that particular option. You need to copy this unique symbol and tell your broker that you want to buy this option.
Last is the closing price of the option premium -- last traded. This is the price traders paid for their options when a transaction was completed and reported. So last is the last price some buyers paid to buy their options last time (last traded transaction reported). You may or may not get to pay this price when you buy the options. You most often will have to pay the asking price. See Ask below.
Bid and Ask Principle
Before I go into the individual description of bid and ask, I want to give you an overview of the concept of these two principles. Have you ever watch auction proceedings? You know, the fast talking guy/gal (call the autioneer) who keeps repeating two prices (lower price and higher price) very fast over and over, and over, and over again in a thundering rhythm that no one seems to understand what the heck he/she is saying?
By the sheer thundering sound of it, it seems that the auctioneer is saying something special but in fact he/she actually just keeps repeating the bid and ask prices while mixing some of his/her own bravado in the mix, often saying the lower price first followed by the higher price next in a thundering rhythmic of sound that gets people to just get up and raise their hands to bid on the subject (or item).
All he/she does is just repeat that pattern over and over and over very fast and gets people excited to jump in and bid. So he/she starts with the starting price set by the seller first and then using that starting price as the bid price as if that price has already been bid. And then the autioneer just raises the bid price higher to make it as an ask price, and now the auctioneer has two prices to work with: bid price and ask price. Now the auctioneer just keeps repeating the two prices over and over, and over again until somebody raises his/her hand to bid on that item.
But the autioneer doesn't want to sell that item to the person that just bid just yet, so he/she keeps raising the ask price again, and this time to an even higher, and he/she repeats that same pattern again and again and again until somebody raises his/her hand again, and the autioneer again doesn't want to sell that item (not just yet), and he/she keeps repeating the same pattern until after a while he/she realizes that there aren't anymore bidders for that asking price, and finally, he/she awards the final bid to the last person who bid on that item.
So the key point to take away from the auction proceeding is that the auctioneer becomes the market maker who dictates how much prices to raise. Once the bidders bid on the item, that bid price becomes the lowest price given to that item, and the auctioneer, being the market maker, sets or raises the price higher to make the price as an asking price. And now the auctioneer has two prices to work with: bid price and asking price. So the auctioneer just repeats this pattern over and over and over.
In the financial world, the market maker (similarly to the auctioneer) sets prices higher or lower depending on the supply and demand. But the difference between the auctioneer and the market maker is that the auctioneer never move prices lower and lower if the demand is not met; whereas the market maker will move prices lower and lower and lower if the supply exceeds demand.
If you ever seen stock, bond, or commodity trading floors (also called pits) where a pit full of traders gathering around a group of market makers and shouting and signaling hands gestures to each other and to the market makers telling them how many shares/contracts, at what price to buy/sell. That was in the old days, but nowaday, trading is done electronically, usually from far distances and sometimes from all over the world.
The bid and ask pricing principle in the financial market follows the same auction pricing principle in which buyers bid to buy the items and sellers ask the buyers to buy the items. That is known as the bid-ask principle or bid-ask spread.
Note: The brokers who handle the buy/sell transactions get to keep the bid-ask spread prices and that's one of the ways brokers make money facilitating transactions to buyers and sellers. One important thing to note is that the higher the volume of a stock, the narrower the bid-ask spread. Although options tend to use volume as a mean to adjust the spreads as well, it uses other factors also in determning the spreads.
In stocks, thinly traded stocks have huge or wide spread -- meaning, if you trade a thinly traded stock you'll have to pay huge spread because the brokerages cannot make enough money if the spread is narrow and it is comparable to spreads in high volume stocks. Likewise, high volume stocks have narrow spreads because brokerages earn enough money with the high volume of transactions. For example, high volume multiply by narrow spread is signficant in money earn; whereas thinly traded stocks need wide spread to multiply with the low volume trades to make enough money comparable to high volume stocks. Brokerages are in the business of making money and making money off spreads is one way of doing that.
So, as an investor, there isn't any way of avoiding this loophole even if you have a brokerage service that charges no fee. They still earn their money through spread transactions automatically that they facilitate. Investors have to bite the bullit on this one.
Bid is the (last) price the buyer bid to buy that options. In the financial world, there are buyers and sellers and sellers set their prices by asking buyers to pay the asking price. Whereas buyers bid each other to buy the underline. So bid is the price some buyer(s) were willing to pay last time (last traded transaction). If you're a buyer, the bid price is the most likely price you'll have to pay for your options. However, since the listed bid price was the last price some buyers were willing to pay last time out, you may or may not get to buy/pay at that price.
In short, the bid price is the last bid price of the options premium that some buyers were willing to pay last time out or last transaction. This helps you gauge the market so that you can price your options accordingly. Again, if you're a buyer, you may or may not get to buy at this price when you buy your options. The bid/ask prices fluctuate according to the law of supply and demand.
Ask is the (last) price sellers were asking buyers to buy their options. Sellers set prices and buyers bid each other for the best price to buy. So ask is the price some sellers were asking buyers to buy this option last time (last traded transaction). Again, if you're a seller, you may or may not get to sell at this price when you sell your options. The bid/ask prices fluctuate according to the law of supply and demand. So in short, the ask price is the last price of the options premium some sellers were asking for buyers to buy last time out or last transaction. This helps you gauge the market so that you can price your options accordingly.
Vol is the total volume of that particular option traded on that day or up to the moment you view the listing. The Vol only lists the volume on that particular day up to the moment you view the listing. It's a daily volume or volume up to the moment you view the listing. The numbers represent the contracts -- total contracts. Use this number to gauge the current sentiment of the options.
Vol listing lists both buy and sell sides -- so there is no way of knowing how many contracts are long and how many contracts are short. It would be nice to know how many contracts are being bought to go long and how many contracts are being sold short. But at least we know how many contracts are being held in the option in both directions. You would need to go to the exchange's website to find out the individual side contracts. And yes, experienced traders do go to the exchange's website to find out this information so that they can make an informed decision.
Experienced traders usually glance through the daily volume for each option to see what kind of action an option receives. If all of a sudden, the volume spikes up unusually high, traders investigate on the option to see why that particular option receives a huge spike in volume. They may trade on that option to ride the co-tail of other traders who caused the volume to spike up. The higher the volume, the more interest the option attracts because traders like to follow one another's lead.
Open Interest is the total option contracts outstanding for that option. This is the accumulation of all the previously contract transactions up to now. Vol lists the total volume for the day up to the moment you view the chain, while open interest accumulates all the outstanding volumes by adding all previous volume up to the moment you view the chain. It's a total outstanding contracts of the option.
If the number is high it tells you that there is a lot of people are interested in holding this options. Use this number to gauge the sentiment of the option. The numbers represent the contracts -- total contracts outstanding.
Open Interest, again, lists both buy and sell sides -- so there is no way of knowing how many contracts are long and how many contracts are short, except by going to the exchange's website. It would be nice to know how many contracts are being bought to go long and how many contracts are being sold short. But at least we know how many (interested) contracts are being held in the option in both directions.
Here is what an options chain looks like:
| Call Options Quotes |
| For AT & T, Inc (Symbol: T): 07-30-2010: $25.94 |
| Expire at close on Friday September 17, 2010 |
| Strike | Symbol | Last | Chg % | Bid | Ask | Volume | Open Interest |
| $23.00 | T100918C00023000 | 2.94 | 0.23 | 3.00 | 3.05 | 45 | 175 |
| $24.00 | T100918C00024000 | 2.15 | 0.04 | 2.10 | 2.13 | 106 | 694 |
| $25.00 | T100918C00025000 | 1.31 | 0.05 | 1.27 | 1.28 | 138 | 2,924 |
| $26.00 | T100918C00026000 | 0.63 | 0.00 | 0.60 | 0.61 | 322 | 11,331 |
| $27.00 | T100918C00024000 | 0.21 | 0.02 | 0.19 | 0.21 | 466 | 3,637 |
| $28.00 | T100918C00024000 | 0.06 | 0.01 | 0.04 | 0.06 | 120 | 808 |
| $29.00 | T100918C00029000 | 0.02 | 0.00 | N/A | 0.02 | 10 | 20 |
| $30.00 | T100918C00024000 | 2.15 | 0.04 | 2.10 | 2.13 | 106 | 694 |
| Put Options Chain Quotes |
| For AT & T, Inc (Symbol: T): 07-30-2010: Price $25.94 |
| Expire at close on Friday September 17, 2010 |
| Strike | Symbol | Last | Chg % | Bid | Ask | Volume | Open Interest |
| $23.00 | T100918P00023000 | 0.05 | 0.00 | 0.09 | 0.11 | 6 | 1,651 |
| $24.00 | T100918P00024000 | 0.15 | 0.01 | 0.16 | 0.18 | 131 | 1,025 |
| $25.00 | T100918P00025000 | 0.31 | 0.00 | 0.32 | 0.34 | 76 | 3,194 |
| $26.00 | T100918P00026000 | 0.63 | 0.03 | 0.65 | 0.67 | 283 | 1,634 |
| $27.00 | T100918P00027000 | 1.24 | 0.02 | 1.24 | 1.27 | 273 | 1,774 |
| $28.00 | T100918P00028000 | 2.05 | 0.03 | 2.09 | 2.11 | 78 | 439 |
| $29.00 | T100918P00029000 | 3.15 | 0.15 | 3.05 | 3.10 | 89 | 18 |
| $30.00 | T100918P00030000 | 4.15 | 0.15 | 3.95 | 4.10 | 124 | 1 |
The OCC Symbology
When exchange traded options first came into popular existence in the 1970s, it was possible that the founders of the options industry neither fully realized just how useful and prevalent option trading would ultimately become, nor some of the changes that would occur in the ensuing decades. As such they set up a somewhat archaic and limiting method of designating option symbols for trading purposes. And the options symbols they used were not always uniformed nor easy to implement.
Then in the latter half of the first decade of the millenial (2000s), as options were becoming more popular and complex (such as using multi-legs strategies), the Options Clearing Corporation (OCC) began an initiative that set the stage for the implementation of a more intuitive and far more flexible method for designating option symbols. The intention of the OCC was for this new method to be uniformed and easy to use and to be fully in place by May of 2010.
Once completed the OCC distributed the guideline to the public world and now all options throughout the world use this OCC implementation.
The options symbol follows the OCC symbology pattern or format that is up to 21 characters that represents the contract specifications of a particular option. The following components are used in constructing the symbol:
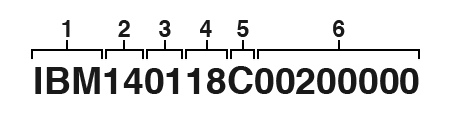
*(1) - Underlying symbol (IBM in this case, or in the previous options chain, T, for AT & T)
*(2) - 2 digit expiration year (14 for 2014)
*(3) - 2 digit expiration month (01 for January)
*(4) - 2 digit expiration day (18 for the 18th day)
*(5) - "C" for Call or "P" for Put
*(6) - 8 digit strike price (00200000 for $200.00).
In the options chain above: 00023000 ($23.00), 00024000 ($24.00), 00025000 ($25.00), 00026000 ($26.00), 00027000 ($27.00), 00028000 ($28.00), 00029000 ($29.00), 00030000 ($30.00).
Notice the strike price is represented in 8 digits no matter what the number of digits of the actual strike price. The strike price is carried to 3 decimal places, but no decimal is used within the symbol. For example, the $200 strike for the IBM option above is represented as "00200000".
Also, note the two "0's padded on the front to complete the 8 digit total. So the maximum strike price can be represent in this format of up to $99999.999 only -- a number unlikely to be surpassed in the options sphere.
Options Continue
The beauty of options is that your risk is limited to the option premium you pay to the seller. But your upside reward is limitless.
If you have the right to buy a stock at $20 a share and it's selling $22, $23, $24, or some other numbers, you could exercise your call option, pay $20 a share to the seller, then turn around and sell the shares on the open market at $22, $23, $24, or some other numbers that the market is offering.
Notice that in options you do not need to have a large sum of money to profit, even at the time of the exercise of the options. All you have to have is your options premium money for either puts or calls and you can buy the rights to puts or calls and when you decide to exercise your contracts the contracts are settled without you having to come up with extra money to cover the full price of the contracts. To better understand this, you'll have to actually get your hands-on-experience by trading options for a few times and you'll see exactly how it works.
Obviously, the higher the stock's price goes, the more you stand to profit. Sellers know this, so as the stock price rises and falls, the option price rises and falls with it.
Consequently, you can profit by just trading the rights to your option for more money than you paid -- without ever having to lay out the large sum needed to buy the 100 shares of stock or the futures contract.
Let's say you bought the stock outright at $22 a share and if that stock price fell from $22 to, say, $10 a share, you would have lost $12 a share just like that.
Now with options, your risk is only limited to the premium paid to the sellers. Take that same scenario above: had you bought a (call) option on that same stock, you would have lost only the premium paid to the seller, no matter how far the stock price fell.
As a result, when you buy an option, you know immediately the most you can lose. This is what the industry calls limited, predetermined risk.
What do the phrases "buy to open," "sell to open," "sell to close," and "buy to close" mean?
The confusing terminology mentioned in the question deals with entering and exiting option orders. There are two main ways in which you can participate in options: you can be either a buyer or a seller. Also, you must enter and exit the trades.
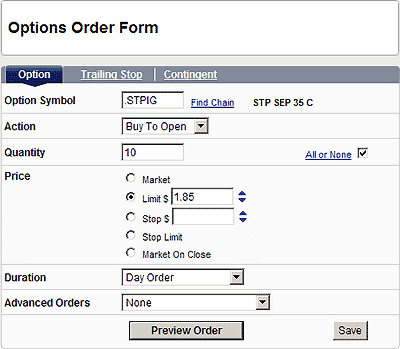
The above screen is a typical options order entry screen interface platform for entering orders. The various key items and their meanings are described below.
Option Symbol
The stock symbol or the specific option symbol you're trading.
Action
The action of entering or exiting the trade.
Quantity
The number of contracts you're buying or selling.
All or None
This feature is pertaining to the quantity just described above. This feature allows you to specify whether the order needs to be filled the entire order quantity or partial quantity. If you check this box when placing an order, your order will be filled only if there are enough contracts to be filled. If you leave it blank or unchecked, your order will be filled regardless of how many contracts available to be filled.
For example, if there are only 8 contracts available and you specified 10 contracts, your order will be filled for only 8 contracts and not the whole 10 contracts you had originally placed. On the other hand, if you check the box and there are only 8 contracts, your order is not filled -- you're not in the contract.
Price
The price specification is pertaining to the type of order as described below.
Types of Orders
Online brokerages provide many types of orders to cater to the various needs of the investors. The most common types of orders available are market orders, limit orders and stop orders. Some provide additional order types (as shown above): Market on Close (or commonly known as After-Hour Trading), Stop Limit, etc.
Market Order
With market orders, you are instructing your broker to buy or sell the options at the current market price. If you are buying, you will be paying the asking price. If selling, you will be selling at the bid price. The advantage of using market orders is that you will fill your order fast (often instantly) but the disadvantage is that you will usually end up paying slightly more, especially when the order is large and the trading volume thin.
Limit Order
With limit orders, you will specify the price you wish to transact. If you are buying, you are instructing your broker to buy at no higher than the specified price. If selling, you are telling him to sell at no less than your stated price. The advantage of using limit orders is that you are in full control of the price at which you buy or sell your options. The disadvantage is that filling the order will take some time, or the entire order may not get filled at all because the underlying stock price has moved way beyond your desired price.
Stop Loss Order
Stop loss orders are orders that only gets executed when the market price of the underlying stock reaches a specified price. They are used to reduce losses when the underlying asset price moves sharply against the investor.
Stop Market Order
A stop market order, or simply stop order, is a market order that only executes when the underlying stock price trades at or through a designated price. Buy stops, designed to limit losses on short positions, are placed above current market price. Sell stops are used to protect long positions and are placed below current market price.
While the stop market order guarantees execution, the actual transacted price maybe slightly lower or higher than desired, especially when the underlying price movement is very volatile.
Stop Limit Order
A stop limit order is a limit order that gets activated only when the underlying stock price trades at or through a specifed price. While a stop limit order provides complete control over the transaction price, it may not get executed if the underlying price moves too quickly and the limit price is never reached.
Duration
The duration specifies the length of time the order is to stay live or good. The two types of duration are:
Day Order
The day order specifies that the order is to stay open until the end of the trading day (of the day you place the order). At the end of the day, if the order is not filled, the order is no longer active and no order is carried forward to the next day to be filled. The order is voided. If you want your order to carry forward past the current day, you need to use a Good Til Cancel (or GTC) order.
Good Til Cancel (or GTC)
The GTC specifies that the order is good until you actually cancel it, regardless how many days, weeks, months or years it takes to fill the order.
Advanced Orders
Advanced orders are advanced types of orders typically available to sophisticated traders. Experienced traders use advanced orders to mitigate risk and to enter the market. These advanced orders include breakouts, retracements, MultiBrackets, Icebergs, market-on-close order (or MOC) which is a non-limit market order, and conditional orders like the one cancels other (also called order cancels order) order (OCO) and the order sends order (OSO).
Some interfaces classify trailing stop orders as advanced orders but trailing stop orders are available to beginners as well.
To Enter the Trade
When you enter a trade, you are essentially opening a position as either a buyer or a seller, hence the orders: "buy to open" (to enter a position as a buyer of call or put options) and "sell to open" (to enter a position as a seller of call or put options).
In other words, to buy a call or put options, you must put in a "buy to open" order. For examples, buy 2 (contracts) IBM 200 (strike) Call at $28.00 (premium) expired, say, in 2 months; buy 1 (contract) IBM 190 (strike) Put at $8.00 (premium) expired, say, in 3 months.
To sell a call or put options, you must put in a sell to open order. For examples, sell 2 (contracts) IBM 200 (strike) Call at $28.00 (premium) expired, say, in 2 months; sell 1 (contract) IBM 190 (strike) Put at $8.00 (premium) expired, say, in 2 months.
To Exit the Trade
Now, to exit a trade, you need to close your option position, whether that position is a long or short position. If you've bought a long option ("buy to open"), you need to use a "sell to close" order to exit the long position. On the other hand, if you've "sell to open" (wrote an option or had sold a short position), you will need to use a "buy to close" order to exit the short position.
While it may seem odd that you would buy to close a position, by taking a long position in the option that you shorted, you neutralize the position by buying a new option (go long) against the position you've wrote the option (earlier short position), and in effect closes your position. Confusing?
In summary, when you enter a trade, you are essentially opening a position as either a buyer or a seller. If you are buying an option, either a put or a call, you must enter a buy to open order. If you are writing an option (a seller), also referred to as selling an option, you must enter a sell to open order to sell either a call or put options.
Yes, these terms can be confusing if you're not practicing it regularly.
What does "In the Money" means?
In the money means that your stock option is worth money and you can turn around and sell or exercise it. For example, if John buys a call option on ABC stock with a strike price of $12, and the price of the stock is sitting at $15, the option is considered to be in the money.
What do "In the Money Call, In the Money Put Option, Deep in the Money " mean?
Definition of "In the Money Call":
A call option is said to be in the money when the current market price of the stock is above the strike price of the call. It is "in the money" because the holder of the call has the right to buy the stock below its current market price. When you have the right to buy anything below the current market price, then that right has value. That value is also referred to as the option's "intrinsic value." That value is equal to at least the amount that your purchase price (strike price) is below the market price. In the world of call options, your call options are "in the money" when the strike price of your calls are less than the current market price of the stock. The amount that your call options' strike price is below the current stock price is called its "intrinsic value" because you know it is worth at least that amount. This compares to an out of the money call option which is call option where the strike price of the call is above the stock's current market price.
Definition of "In the Money Put":
A put option is said to be in the money when the strike price of the put is above the current price of the underlying stock. It is "in the money" because the holder of this put has the right to sell the stock above its current market price. When you have the right to sell anything above its current market price, then that right has value. That "intrinsic value" is equal to at least the amount that your strike price is above the market price. In the world of put options, your put option is "in the money" when the strike price of your put is above the current market price of the stock. The amount that your put option's strike price is above the current stock price is called its "intrinsic value" because you know it is worth at least that amount.
Definition of Deep in the Money:
An option (Call or Put) is said to be "deep in the money" if it is in the money by more than $10. This phrase applies to both calls and puts. So, "deep in the money" call options would be calls where the strike price is at least $10 less than the price of the underlying stock. Put options would be "deep in the money" if the strike price is at least $10 higher than the price of the underlying stock.
Example of Deep in the Money Calls and Puts:
Suppose YHOO is at $40 and you think YHOO's stock price is going to go up to $50 in the next few weeks. If you bought the YHOO $40 calls and then in the next few days you find out you were right and YHOO is at $52, then your $40 calls are in the money $12 and they would be considered deep in the money call options.
Likewise if you had a YHOO $55 put, then this put would be considered deep in the money when YHOO is at $40, but once YHOO climbed to $52, it is still in the money, but it would not be considered deep in the money.
The advantage of buying deep in the money calls and puts is that their prices tend to move $1 for $1 with the movement of the underlying stock. So, if you are absolutely certain that the price of the underlying stock is going to move a lot and move quickly, then you will earn a higher percentage return trading these calls and puts than trading the stock itself.
Calls and Puts Trading Tip:
Why is this distinction between ITM calls and puts and a DEEP ITM calls and puts? The first thing to understand is that options with strike prices near the price of the underlying stock tend to have the highest risk premium or time-value built into the option price. This is compared to deep in the money options that have very little risk premium or time-value built into the option price.
For example, if YHOO is at $40, the current month $40 call might be priced at $1.50. That $40 call is ATM so its intrinsic value is $0 (meaning that there isn't an actual gain in cash value for you to cash out your position to gain a profit) but traders are willing to bet $1.50 that the price of YHOO will move up to and higher than $41.50 which is the breakeven point. The YHOO $30 call however, might be price at $10.25. The $30 call is obviously ITM $10 so the risk premium or time-value is only $0.50.
You will often hear traders talk about Time Value a lot. Time Value means nothing more than the Premium Price you pay or receive (as a buyer or seller). See an extensive explanation later.
What do "Out of the Money Call, Out of the Money Put Option and At the Money Option" mean?
Definition of "Out of the money" and "out-of-the-money":
A call option is said to be out of the money if the current price of the underlying stock is below the strike price of the option.
A put option is said to be out of the money if the current price of the underlying stock is above the strike price of the option.
Example of an "Out of the Money CALL Option":
If the price of YHOO stock is at $37.50, then all of the call options with strike prices at $38 and above are out of the money.
Why are they out of the money? They are out of the money because those options don't have any intrinsic value. If you have the right to buy YHOO at $40 and the current market price is $37.50, then that YHOO $40 call is out of the money by $2.50. If you had that call and you had to exercise it, you could buy shares of YHOO at $40 and sell them immediately in the open market for $37.50 for a loss of $2.50. Would you do that? Absolutely not! So they are out of the money.
Likewise the YHOO $45 and $50 calls are also way out of the money.
If YHOO is at $37.50, then all of the call options with a strike price of $37 and below are in the money.
Example of an "Out of the Money PUT:
If the price of MSFT stock is at $37.50, then all of the put options with strike prices at $37 and below are out of the money.
Why are they out of the money? They are out of the money because those options don't have any intrinisc value. If you have the right to sell MSFT at $35 and the current market price is $37.50, then that MSFT $40 put is out of the money by $2.50. If you had that put and you had to exercise it, you could sell shares of YHOO at $35 and buy them immediately in the open market for $37.50 for a loss of $2.50. That doesn't make sense so they are out of the money.
Likewise the MSFT $30 put is out of the money by $7.50 and the MSFT $25 put is out of the money by $12.50.
If MSFT is at $37.50, then all of the put options with a strike price of $38 and higher are in the money.
Definition of "At The Money" Option:
An option is said to be at the money if the current stock price is equal to the strike price. It doesn't matter if we are talking about calls or puts. Any call or put whose underlying stock price equals the strike price is said to be at the money. Sometimes you will see "At The Money" abbreviated as "ATM." You may also see "OTM" which mean "Out of the Money" and ITM which means "In the Money".
Moneyness
Moneyness is a term describing the relationship between the strike price of an option and the current trading price of its underlying security. In options trading, terms such as in-the-money, out-of-the-money and at-the-money describe the moneyness of options. The price movement of the options.
Instrinsic Value
The two components of an option premium are the intrinsic value and time value of the option. So instrinsic value is a term describing the option's actual value that can be cashed out. By definition, the only options that have intrinsic value (that can be cashed out) are those that are in-the-money. For calls, in-the-money refers to options where the strike price is less than the current underlying price. For example, a call option with a strike price of $25 in premium of $3 and the current price of the stock is $27 causing this option to have an intrinsic value of $2 ($27 - $25).
If you own this option you can cash out your position because it is an in-the-money option and has intrinsic value. In other words, an intrinsic value is an option that has real value to you -- it is worth something to you. In this case, it is worth $2 per share to you; however, even though this option has instrinsic value it is not a profitable option, because its premium ($3 per share) is higher than its intrinsic value ($2 per share). So you still end up a $1 per share loss if you cash out right now. So your hope now is to depend on time value to save you the day. See time value next.
Time Value
The two components of an option premium are the intrinsic value and time value of the option. Time value is a term describing the value of the option in relationship between the length of time of an option to expiration and the current trading price of its underlying security. The more time to expiration, the greater the time value of the option. Think of an option that has no intrinsic value right now but give it time and that option might be worth something (and have intrinsic value). This is called time value -- time is all that option has right now because it doesn't have intrinsic value -- it cannot be cashed out right now, so it has time to expiration to make this option worth something. The time between now and the expiration is called time value. As the expiration date gets closer and closer the time value decreases smaller and smaller and eventually the option is worthless if the stock price doesn't move in the direction of your option.
One indicator that represents the time value is the option price or premium on the contract. So when traders talk about time value, they really mean the actual premium price. If you look at the options premium on any particular option, it gets smaller and smaller in prices as the expiration date approaches. This is called time value.
Time value represents the amount of time the option position has to become profitable due to a favorable move (a move in the desired direction of your option) in the underlying price. In most cases, investors are willing to pay a higher premium for more time (assuming the different options have the same exercise price), since time increases the likelihood that the position will become profitable. In other words, a lot of options traders are willing to choose longer expiration dates to give their options long enough time to move in their desired direction. In general, the longer the time of expiration date the more chances stocks or options move or fluctuate. So time is precious in options trading because the lesser time to expiration the more chances that your option is becoming worthless.
Managing Time or Trades
Now that you know what instrinsic value and time value are and how they work, it's time to learn how to manage your trades. Managing your options trades is not a requirement for most beginners, but experienced active daytraders usually always manage their trades regardless the trades go their way or not.
Why do experienced traders manage their trades?
A simple answer is: maximize profits and minimize losses.
One of the tools they use is the stop loss and trailing stop. See my tutorials on the topics.
Suppose that you place a trade and you expect the stock/options to move in the direction you desire but after a while the position is going against you and the expiration date is fast approaching and you realize that there is no way you're going to make money on your contract. Here is my advice: cut your losses -- the sooner you realize the position is not going to turn good, the better off you are, and the sooner you cut your losses is the better off you are.
Do not try to hope for the best -- the best will never materialize if the trend is going against you. So cutting your losses is the best way to manage your trades. If the trend is going against you: cut your losses -- and don't hope for a miracle! Get out as soon as possible. There are plenty of opportunities to make money else where, and don't falling in love and marry to your positions.
You can cut your losses even if your options are not in the money as long as the options have intrinsic value. To illustrate this, I'm going to use my actual trades I've made, in which, I anticipated the stocks to move dramatically because of Phase III report was dued to report, but after the report the stock didn't move a needle and I realized afterward that there isn't any catalyst to look forward to, to move the stock higher, so I decided to get out and use the remaining proceeds to play other trades. Here are the positions that I've cut my losses:

If you look at the time value, I still have plenty of time value to be had and the options could turn out to be profitable, but I decided that if the Phase III reports didn't move the stock/options then what else will? So I'm not going to hope for the best! To save space, here is one of the positions that I've got out:
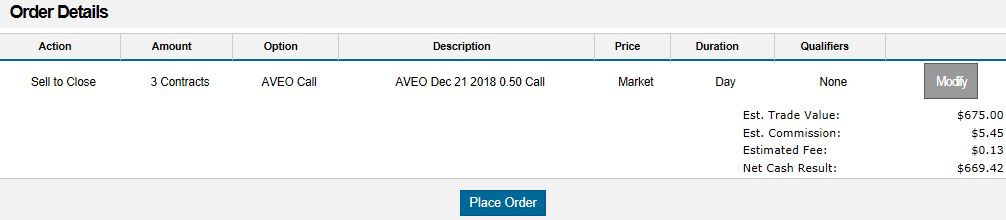
Black Scholes Option Pricing Model
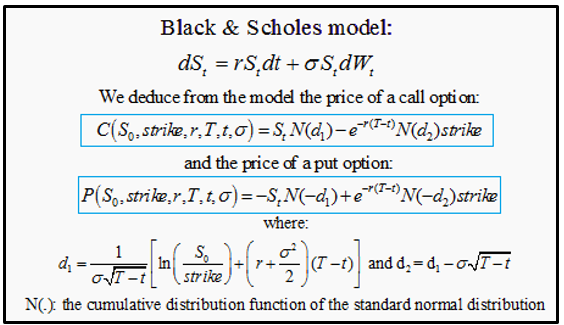
Definition of the Option Pricing Model Using the Black Scholes:
The Option Pricing Model is a formula that is used to determine a fair price for a call or put option based on factors such as underlying stock volatility, days to expiration, and others. The calculation is generally accepted and used on Wall Street and by option traders and has stood the test of time since its publication in 1973. It was the first formula that became popular and almost universally accepted by the option traders to determine what the theoretical price of an option should be based on a handful of variables.
Here is a break down of the formula above. DO NOT be frightened by the scary look of the formula because it is for demonstration purpose only and you do not need to understand any of these mathematical properties.
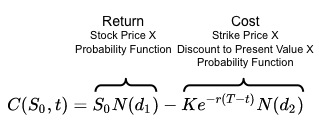
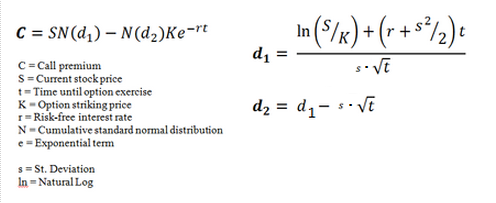
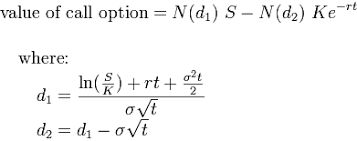
Note that risk-free interest rate means the interest rate is constant throughout the period in the timeframe or expiration period. In another word, it's a fixed interest rate that stays constant throughout the expiration period.
So options trading terms can be confusing initially but once you practice it in real life you'll understand better quickly. You need to be familar with these terms just described and one more key factor in options trading, which is called implied volatility. In options trading, implied volatility is probably the most important key factor that seperates a successful trader from an unsuccessful trader.
Understanding the concept of implied volatility and learning how to use it is key to become a successful options trader. The following describes the concept of implied volatility:
Implied Volatility
What is Implied Volatility?
Implied volatility (IV) is one of the most important concepts for options traders to understand for two reasons. First, it shows how volatile the market might be in the future. Second, implied volatility can help you calculate probability. This is a critical component of options trading which may be helpful when trying to determine the likelihood of a stock reaching a specific price by a certain time.
Keep in mind that while these reasons may assist you when making trading decisions, implied volatility does not provide a forecast with respect to market direction. Although implied volatility is viewed as an important piece of information, above all it is determined by using an option pricing model, which makes the data theoretical in nature. There is no guarantee these forecasts will be correct.
Understanding IV means you can enter an options trade knowing the market's opinion each time. Too many traders incorrectly try to use IV to find bargains or over-inflated values, assuming IV is too high or too low. This interpretation overlooks an important point, however.
Options trade at certain levels of implied volatility because of current market activity. In other words, market activity can help explain why an option is priced in a certain manner. Here we'll show you how to use implied volatility to improve your trading. Specifically, we'll define implied volatility, explain its relationship to probability, and demonstrate how it measures the odds of a successful trade.
Historical vs. implied volatility
There are many different types of volatility, but options traders tend to focus on historical and implied volatilities. Historical volatility is the annualized standard deviation of past stock price movements. It measures the daily price changes in the stock over the past year.
In contrast, IV is derived from an option's price and shows what the market "implies" about the stock's volatility in the future. Implied volatility is one of six inputs used in an options pricing model shown in the Black Scholes Pricing formula shown earlier, but it's the only one that is not directly observable in the market itself. IV can only be determined by knowing the other five variables and solving for it using a model. Implied volatility acts as a critical surrogate for option value -- the higher the IV, the higher the option premium.
Since most option trading volume usually occurs in at-the-money (ATM) options, these are the contracts generally used to calculate IV. Once we know the price of the ATM options, we can use an options pricing model and a little algebra to solve for the implied volatility.
Some question this method, debating whether the chicken or the egg comes first. However, when you understand the way the most heavily traded options (the ATM strikes) tend to be priced, you can readily see the validity of this approach. If the options are liquid then the model does not usually determine the prices of the ATM options; instead, supply and demand become the driving forces.
Any times market makers will stop using a model because its values cannot keep up with the changes in these forces fast enough. When asked, "What is your market for this option?" the market maker may reply "What are you willing to pay?" This means all the transactions in these heavily traded options are what is setting the option's price. Starting from this real-world pricing action, then, we can derive the implied volatility using an options pricing model. Hence it is not the market markers setting the price or implied volatility; it's actual order flow.
Implied volatility as a trading tool
Implied volatility shows the market's opinion of the stock's potential moves, but it doesn't forecast direction. If the implied volatility is high, the market thinks the stock has potential for large price swings in either direction, just as low IV implies the stock will not move as much by option expiration.
To option traders, implied volatility is more important than historical volatility because IV factors in all market expectations. If, for example, the company plans to announce earnings or expects a major court ruling, these events will affect the implied volatility of options that expire that same month. Implied volatility helps you gauge how much of an impact news may have on the underlying stock.
How can option traders use IV to make more informed trading decisions? Implied volatility offers an objective way to test forecasts and identify entry and exit points. With an option's IV, you can calculate an expected range -- the high and low of the stock by expiration. Implied volatility tells you whether the market agrees with your outlook, which helps you measure a trade's risk and potential reward.
Defining standard deviation
First, let's define standard deviation and how it relates to implied volatility. Then we'll discuss how standard deviation can help set future expectations of a stock's potential high and low prices -- values that can help you make more informed trading decisions.
To understand how implied volatility can be useful, you first have to understand the biggest assumption made by people who build pricing model: the statistical distribution of prices. There are two main types which are used, normal distribution or lognormal distribution.
The image below is of normal distribution, sometimes known as the bell-curve due to its appearance. Plainly stated, normal distribution gives equal chance of prices occurring either above or below the mean (which is shown here as $50). We are going to use normal distribution for simplicity's sake. However, it is more common for market participants to use the lognormal variety.
Why, you ask? If we consider a stock at a price of $50, you could argue there is equal chance that the stock may increase or decrease in the future. However, the stock can only decrease to zero, whereas it can increase far above $100. Statistically speaking, then, there are more possible outcomes to the upside than the downside. Most standard investment vehicles work this way, which is why market participants tend to use lognormal distributions within their pricing model.
With that in mind, let's get back to the bell-shaped curve (see Figure 1). A normal distribution of data means most numbers in a data set are close to the average, or mean value, and relatively few examples are at either extreme. In layman's terms, stocks trade near the current price and rarely make an extreme move. Figure 1 (below):
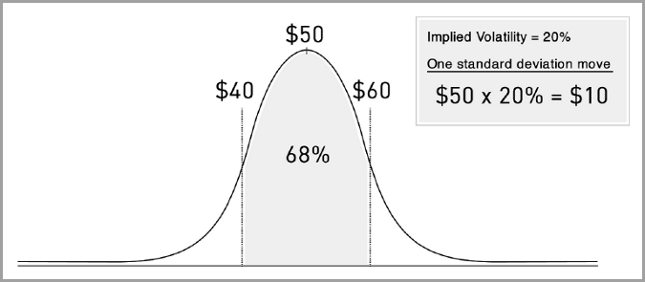
Let's assume a stock trades at $50 with an implied volatility of 20% for the at-the-money (ATM) options. The implied volatility is a proxy for standard deviation in percentages and are calculated and given in the options chain. If you look in the options chain of any stock, you'll see implied volatility percentages for each option. So when you need to do some calculations like we're doing right now, you can just take it from the options chain and use in your calculations (in this example, we make up the 20% for illustration purpose). That is if you're doing by hand; however, if you're using Trade King's calculator (illustrated below) the implied volatility percentage and other items inputs are entered automatically by the tool, making your calculations much, much easier.
Statistically, IV is a proxy for standard deviation. In other words, IV is a representation of the standard deviation. It acts like standard deviation moves--it acts as a proxy signal. If we assume a normal distribution of prices, we can calculate a one standard-deviation move for a stock by multiplying the stock's price by the implied volatility of the at-the-money options:
One standard deviation move = $50 x 20% = $10
The first standard deviation is $10 above and below the stock's current price, which means its normal expected range is between $40 and $60. Standard statistical formulas imply the stock will stay within this range 68% of the time (see Figure 1).
All volatilities are quoted on an annualized basis (unless stated otherwise), which means the market thinks the stock would most likely neither be below $40 or above $60 at the end of one year. Statistics also tell us the stock would remain between $30 and $70 -- two standard deviations -- 95% of the time.
Furthermore it would trade between $20 and $80 -- three standard deviations -- 99% of the time. Another way to state this is there is a 5% chance that the stock price would be outside of the ranges for the second standard deviation and only a 1% chance of the same for the third standard deviation.
Keep in mind these numbers all pertain to a theoretical world. In actuality, there are occasions where a stock moves outside of the ranges set by the third standard deviation, and they may seem to happen more often than you would think. Does this mean standard deviation is not a valid tool to use while trading? Not necessarily. As with any model, if garbage goes in, garbage comes out.
If you use incorrect implied volatility in your calculation, the results could appear as if a move beyond a third standard deviation is common, when statistics tell us it's usually not. With that disclaimer aside, knowing the potential move of a stock which is implied by the option's price is an important piece of information for all option traders.
Standard deviation for specific time periods
Since we don't always trade one-year options contracts, we must break down the first standard deviation range so that it can fit our desired time period (e.g. days left until expiration). The formula is: Figure 2 (below)

Note: it's usually considered more accurate to use the number of trading days until expiration instead of calendar days. Therefore, remember to use 252 -- the total number of trading days in a year.
As a short cut and a clever way to simplify the math, many traders will use 16, since it is a whole number when solving for the square root of 256 [16 X 16 = 256].
How would you like to solve the square root of 252?. But there are only 252 trading days in a year, so we'll have to find 4 extra days to trade -- maybe on four saturdays every year. 252 + 4 = 256.
Let's forget about the yearly precision talk above and assume that we are dealing with a 30 calendar-day option contract, which is very precised and very common for everyday trades. The first standard deviation would be calculated as: Figure 3 (below)

In this example, we use 10% for IV instead of 20% as shown earlier. For real life trades, you can use whatever % IV shown in the option chain on the option you're trading.
A result of (+/-)1.43 means the stock is expected to finish between $48.57 and $51.43 after 30 days (50 +/- 1.43). [+/- means plus or minus. So (+/-)1.43 means +1.43 or -1.43; 50 +/- 1.43 means 50 + 1.43 or 50 - 1.43].
Figure 4 (below) displays the results for 30, 60 and 90 calendar-day periods. The longer the time period, the increased potential for wider stock price swings. Remember implied volatility of 10% will be annualized, so you must always calculate the IV for the desired time period.
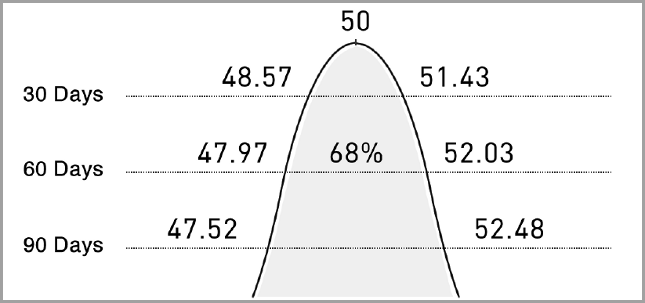
Does crunching numbers make you nervous? No worries, TradeKing has a web-based Probability Calculator that will do the math for you, and it's more accurate than the quick and simple math used here.
[A side note: TradeKing was bought by Ally Financials in 2015 and no longer operating a brokerage trading business as of the end of 2015. So if you're looking to find the TradeKing's web-based Probability Calculator and other trading tools mentioned in this article, you can signup a trading account at Ally Financials and they should have integrated all TradeKing trading tools into their own trading platform.]
Now let's apply these basic concepts to two examples using fictitious stock XYZ.
A stock's "probable" trading range
Everyone wishes they knew where their stock may trade in the near future. No trader knows with certainty if a stock is going up or down. While we cannot determine direction, we can estimate a stock's trading range over a certain period of time with some measure of accuracy. The following example, using TradeKing's Probability Calculator, takes options prices and their IVs to calculate standard deviation between now and expiration, 31 days away. (see Figure 5 below)
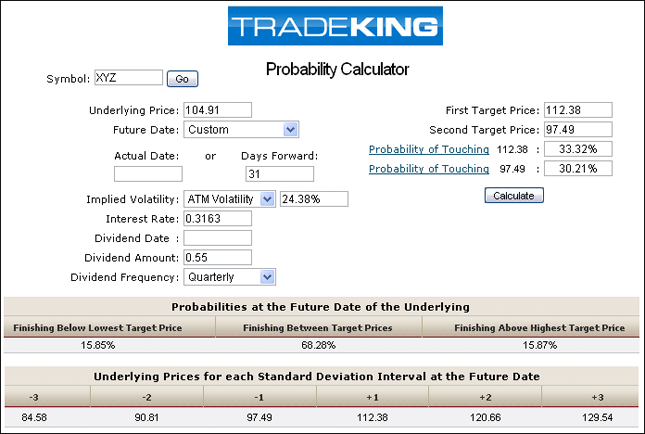
This tool uses five of the six inputs of an options pricing model (stock price, days until expiration, implied volatility, risk-free interest rate, and dividends) using a lognormal distribution to calculate the standard deviations. Note that risk-free interest rate means the interest rate is constant throughout the period in the timeframe or expiration period. In another word, it's a fixed interest rate.
Why throw in interest rate and dividend into the calculation of the price of a stock?
Well, if you're going to calculate the true future stock price to be as close to the actual future price as possible you would have to account for all of the factors that effect a stock price. Interest rate does effect a stock price because of inflation. Stock prices use money as its denomination and money inflates based on the rate of inflation and interest rate is a proxy of inflation.
Likewise, dividends effect a stock price as well. If you buy a stock at $10 a share today that pays an annual dividend of $1 a share, your stock price should be worth $11 a share after one year [not accounting for other factors such as business condition], $12 a share after two years, $13 a share after three years, and so forth. You only have to spend $10 to earn those amounts [$11, $12, $13,...] including dividends, so the true, actual stock price should at least be at those amounts after those years. So the future stock price calculation should account for the dividends as well.
Notice that the normal distribution shown in the early examples doesn't use five inputs as this one does. The lognormal distribution uses all the inputs contain in the normal distribution plus two additional inputs: risk-free interest rate and dividends. This is more accurate than the normal distribution calculation because it accounts for interest rate and dividend.
Once you enter the stock symbol and the expiration (31 days), the calculator inserts the current stock price ($104.91), the at-the-money implied volatility (24.38%), the risk-free interest rate (.3163%), and the dividend (55 cents paid quarterly). Notice that using the tool simplifies the entering of inputs greatly -- you only have to enter two items: stock symbol and the expiration date.
Let's start with the bottom of the screenshot above. The different standard deviations are displayed here using a lognormal distribution (first, second and third moves). There is a 68% chance XYZ will between $97.49 and $112.38, a 95% chance it will be between $90.81 and $120.66, and a 99% chance it will be between $84.58 and $129.54 on the expiration date.
XYZ's first standard deviation limits can then be inputted at the top right of the calculator as the First and Second Target Prices. After you hit the Calculate button, the Probability of Touching will display for each price. These statistics show the odds of the stock hitting (or touching) the targets at any point before expiration. You'll notice the Probabilities at the Future Date are also given. These are the chances of XYZ finishing above, between, or below the targets on the future date expiration).
As you can see, the probabilities displayed show XYZ is more likely to finish between $97.49 and $112.38(68.28%) than above the highest target price of $112.38 (15.87%) or below the lowest target price of $97.49 (15.85%). There is a slightly better chance (.02%) of reaching the upside target, because this model uses a lognormal distribution as opposed to the basic normal distribution found in Figure 1.
When examining the probability of touching, you'll notice XYZ has a 33.32% chance of climbing to $112.38 and a 30.21% chance of falling to $97.49. The probability of it touching the target points is about double the probability of it finishing outside this range at the future date.
Using TradeKing's Probability Calculator to help analyze a trade
Let's put these theories into action and analyze a short call spread. This is a two-legged trade where one leg is bought (long) and one leg is sold (short) simultaneously. Bear in mind, because this is a multiple-leg option strategy it involves additional risks, multiple commissions, and may result in complex tax treatments. Be sure to consult with a tax professional before entering this position.
When using out-of-the-money (OTM) strikes, the short call spread has a neutral to bearish outlook, because this strategy profits if the stock trades sideways or drops. To create this spread, sell an OTM call (lower strike) and buy a further OTM call (higher strike) in the same expiration month. Using our earlier example, with XYZ trading at $104.91, a short call spread might be constructed as follows:
* Sell one XYZ 31-day 110 Call at $1.50 (this means selling one Call option contract with a strike price of $110 at premium price of $1.50 and will expires in 31 days)
* Buy one XYZ 31-day 115 Call at $0.40 (this means buying one Call option contract with a strike price of $115 at premium price of $0.40 and will expires in 31 days)
Total credit = $1.10 ($1.50 - $0.40)
Remember that in options you can buy or sell calls or puts, and here we're buying one call contract and sell one call contract. This is called a bear call spread because this strategy profits if the stock trades sideways or drops.
Check out the tutorials on options spreads: Option Spread Strategies. Buying calls or puts will cost you money in the amount of premium you have to pay, while selling calls or puts will earn you money from the premium you receive from the buyers.
In multple legs strategies, experienced traders use the buys and sells combination to increase odds of profitability while minimize risk and at the same time can lower investment cost by balancing debit and credit combinations. As you can see in the above example, you receive more credit than the debit that you have to pay.
Another name for this strategy is the call credit spread, since the call you're selling (the short option) has a higher premium than the call you're buying (the long option). The credit is the maximum profit for this spread ($1.10). The maximum loss or risk is limited to the difference between the strikes less the credit (115 - 110 - $1.10 = $3.90).
The spread's break-even point at expiration (31 days) is $111.10 (the lower strike plus the credit: 110 + $1.10). Your goal is to keep as much of the credit as possible. In order for that to happen, the stock must be below the lower strike at expiration. As you can see, the success of this trade largely boils down to how well you choose your strike prices.
No worries, we have the Probability Calculator to help analyze the above strikes, let's use TradeKing's Probability Calculator. No guarantees are given by using this tool, but the data it provides may be helpful.
In Figure 6 (below), all the inputs are the same as before, with the exception of the target prices on the right side of the screen.
To start, you'll have to calculate the spread's break-even point ($111.10) and the maximum loss ($3.90), which we've already done so above.
Next, you enter the target prices on the right side of the screen. Every thing else stays the same. The spread's break-even point ($111.10) is the first target price (upper right). Its largest loss ($3.90) occurs if XYZ finishes at expiration above the upper strike ($115 = $111.10 + $3.90) by expiration -- the second target price.
That's all you have to enter. After you entered all information and click a button "Calculate" the screen like figure 6 below is shown.
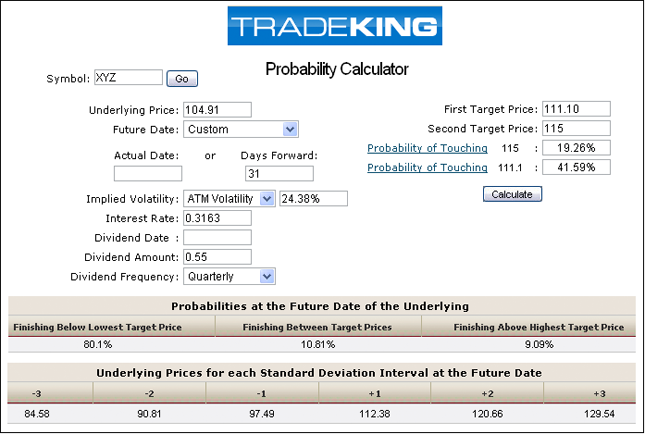
Based on an implied volatility of 24.38%, the Probabilities at the Future Date indicate the spread has an 80.10% chance of finishing below the lowest target price (111.10). This is our goal in order to retain at least one cent of the $1.10 credit.
The odds of XYZ finishing between the break-even point and the higher strike (111.10 and 115) is 10.81%, while the probability of XYZ finishing at 115 (or above) -- the point of the spread's maximum loss -- is 9.09%. To summarize, the chances of having a one-cent profit or more are 80.10% and the odds of having a one-cent loss or more are 19.90% (10.81% + 9.90%).
Although the spread's probability of a gain at expiration is 80.10%, there is still a 41.59% chance XYZ will touch its break-even point ($111.10) sometime before 31 days have passed. This means based on what the marketplace is implying the volatility will be in the future, the short call spread has a relatively high probability of success (80.10%). However, it's also likely (41.59% chance) this trade will be a loser (trading at a loss to the account) at some point in the next 31 days.
Many credit spread traders exit when the break-even point is hit. But this example shows patience may pay off if you construct spreads with similar probabilities. Don't take this as a recommendation on how to trade short spreads, but hopefully it's an instructive take on the probabilities that you may never have calculated before.
If the discussion of implied volatility and the examples shown thus far make your head dizzy, there is an alternative simple way to by-pass all that crazy mathematic and its computation by having others doing all that crazy stuffs for you so that you don't have to worry about any of the crazy computation.
In the near distance future, I will offer a subscription membership for those of you who want to earn more money using the "crazy" computation just discussed here along with many more advanced strategies. My advanced strategies offer you multitudes of opportunities for aggressive investors to earn high returns in a short amount of time; and of course using safe and sound strategies.
I will do all the research plus doing all that crazy math for you and come up with a playbook that spells out exactly what to do in a clear and concise manner so that even a novice beginner in options can follow and understand. If you can understand the credit spread example shown earlier you'll definitely understand my "serve in a plate" playbook instructions.
You don't need to do research to come up with what stocks to play and you certainly don't need to come up with what option price targets to trade; I'll do it all for you and give you a "serve in a plate" playbook instruction, saving you time and headaches. Please stay tuned!!!
In conclusion ....
Hopefully by now you have a better feel for how useful implied volatility can be in your options trading. Not only does IV give you a sense for how volatile the market may be in the future, it can also help you determine the likelihood of a stock reaching a specific price by a certain time. That can be crucial information when you're choosing specific options contracts to trade. So understanding the concept of implied volatility and learning how to use it is key to become a successful options trader.
Good Luck Trading!!!
A Trading Strategy: Selling "Put" Options
Wouldn't it be great if there was a way to buy stocks at below market prices?And yes, there is, and here's a strategy of buying stocks at discount to the market.
There's an investment strategy that can help you get stocks at the price you want to pay. What's more, this strategy can also put money in your pocket immediately.
I'll tell you all about it in a second, but first, a little background.
The strategy involves using options to buy stock. It's not widely used by the average investor, but it should be. The problem is most people think options are too complicated.
But I'm going to change that, at least for this exciting options strategy. And soon you'll never have to pay full price for a stock again!
The strategy I'm talking about is: selling put options.
Here are some of the basics to get started:
First, you've got to do your research and find a stock you want to buy. It should be a stock that you wouldn't mind owning even if the price drops significantly. Blue Chip stocks are usually good for this strategy. Stocks that pay dividends even better if you want some income to go along with the equity. But it doesn't have to be stocks with dividends--any stable stocks are fine. This is a long term investment strategy and we don't have to worry about the market volatility.
Examples of blue chip stocks are Walmart, Mcdonalds, Google, Apple, Facebook, Microsoft, Intel (INTC), 3M, AbbVie, Merck, Johnson & Johnson, Bristol Meyer, Exon Mobil, Chevron, Hess, Bank of America, Citygroup, Goldman Sach, Yum! Brands, Pepsi, Coca Cola, GM, Ford, etc. If you don't like the list that I mention here, there are thousands of blue chip stocks out there that you can choose from. You don't have to choose from the list here. You can find your own blue chip stocks that fit your personal preference.
Once you have the stock, you'll need to figure out what price you're willing to pay for it, preferably a price below the current market price. Don't be afraid to choose a price that's 10% or even 15% below the stock's current market price.
Next, you're going to need to pick a timeframe for the trade.
Remember, every option contract has an expiration date. Any time prior to expiration, your put option can be exercised by the buyer. If that happens, you'll have to buy 100 shares immediately.
Let's be clear, when you sell a put option, you don't have any say when you'll have to buy your shares. Only the buyer of the put option has that choice. The seller must buy the shares as soon as the option buyer exercises the put. So, make sure you always have enough money in your account to buy the 100 shares. I'm using one contract for this example, which is 100 shares. In your case, you can trade as many contracts as you wish. Just remember to do your math to come up with the required money for the transactions.
Getting back to the timeframes! I like to use four months to a year. I've found these time periods usually offer the best risk/reward profile. And more importantly, they tend to offer the highest option premiums. Of course, you don't have to stick to the timeframe I'm using. You can use any timeframe you like and it won't hurt you at all. Four months is just an example, in your case, you can use any length in expiration, say, one month, two months, or even in weeks, say, two weeks, three weeks or weekly since they now have weekly options.
Ok, now you've got your stock, the timeframe for the trade, and the price you're willing to pay.
Sounds good! Let's see how the strategy works!
To make this easier to understand, I'm going to use a real world example. Let's say you want to buy shares of Exxon Mobil (XOM). Right now (March 15, 2018) the stock is trading around $74 or $75 a share. But you decided that $65 is the most you feel comfortable paying over the next four months. That is roughly a 13% discount.
Here's how you make your trade:
- First, sell one October 19, 2018 put option with a strike price of $67.50 for $2.50 a share in premium. Since each put contract controls 100 shares, you'll be collecting $250 (100 x $2.50). Your account will show you've sold one put contract and immediately your cash balance is higher by $250.
For some investors, this is called naked put, which doesn't require you to have enough money to pay for the total price of the stock because their broker allows them to buy on margin. This is for people who have some experience trading options. However, for this tutorial, I am aiming for the non-experience options traders, i.e., long term investors who don't trade options for a living.
So in your case, you would buy a cash-secured put, which requires you to have enough money in your account to cover the transaction. No big deal! Because your intention is to invest for the long haul and part of investing for the long term is to come up with the money to buy the stock outright. But in this case, you're not buying the stock outright -- well, not at the moment of your trading. Eventually, you'll have to buy the stock outright when the buyer of your cash-secured put decides to exercise his/her option from you. That's why you have to have enough money in your account to trade this option. - In technical term, you would in your brokerage account web interface select the type of trades you want to trade: stocks or options. In this case, you want to trade options and you select 'options' from the panel and the interface displays the options pane (similar to the above screen pane) for you to trade.
Next, select the symbol of the stock (XOM), select the expiration date (October 19, 2018), select the type of trade (in this case, a "Put"), select the "Sell to Open" (you're opening a position as a seller to sell the option), select the quantity of the option [1 for one contract], select the strike price (in this case $67.50) of the option you want to sell and immediately the premium for that strike price is automatically calculated by the brokerage system and appeared instantly (in this case $2.50).
Next, click on "Preview" to see your order and if it's what you entered, click "Send" or "Order," depending your interface.
Congratulation! Now you're an expert on how to trade options -- well, a put option. - And that is it! Very simple!
This is called cash-secured put or covered put -- you're securing the trade with your money deposited in your account ready to buy the stock as soon as the buyer of your put option decides to excerise the option.
Meanwhile, you don't have to do anything but only wait for the expiration date to arrive. You can also work on your next cash-secured put trade because at any time from now until expiration, your outstanding cash-secured put option may get exercised. Once it does, you can pull the trigger on your next trade.
- As of now, your trade is on, now you just need to wait for Exxon Mobil's stock to approach $67.50.
But hold on, as expiration approaches, some interesting scenarios can play out.
If October expiration passes and Exxon Mobil's is still trading at around $75 a share, you're sitting pretty. The put option you sold expires worthless (to the buyer) and you get to keep the $250 premium as pure profit. That's a 4% yield on the cash you were holding to buy the stock (which is $6750 = 100 x $67.50.) Again, you have to have at least $6750 in your account. In addition, if you did this every four months, that would be a 12% annual yield.
Let's face it... you're certainly not going to earn 12% interest from your bank right now. - Now you can sell another put option on Exxon Mobil's and collect more premium. And you can continue to capitalize as long as your put options keep expiring worthless.
A typical stocks/options order entry screen interface platform for entering orders looks something like this:
Notice that the various key items in the screen interface maybe arranged in different order and location for different brokerage services interface, but all the items should be there.
If you're paying attention, I chose October 19, 2018 as the expiration date, which is about a little more than six months away from now. Again, this is an example and yours don't have to be that long. On top of that, your objective is to own your stock at a discount and by giving it a little more time than usual the chance of your stock swinging wildly is increased, allowing your options to get exercised.
Even if your options are not getting exercised, you still come out ahead by constantly receiving a stream of premiums and over time it will boost your account balance.
If your stocks swing wildly, the chance of your put options getting exercised is very great and that could be any time from now depending on how your stock is swinging and which way it is swinging. So that's why the six months that I chose is not very significant in relation to this (or your) option-playing strategy. Remember that the more time there is to expiration, the higher the premium the buyer has to pay you the seller of the options.
Suppose that you pick a long timeframe, the premium for that option will reflect the long timeframe; and therefore, giving you more money regardless whether the option get exercised or not.
If one week or two weeks or one month, two months or three months, or whatever, and your options get exercised, you get to keep the premium that was meant for a six-month option contract which lasted only a short timeframe. So there you go: the six-month timeframe works favorably for you.
Do you see what is going on here?
You pick a long timeframe to earn big premiums in hope of your options being exercised in a short timeframe and therefore allowing you to repeat that same process over and over and over again, making you consistent streams of income while owning stocks cheaper than the market price.
Of course, it is not guaranteed that picking long timeframes will result in your options getting exercised frequently, but the chance of that happening is very good. On top of that, you're collecting the premiums in the meantime while you're looking to invest for the long term.
I want to share a secret with you:
For those of you who can spot trends of a stock -- and that is, whether the stock is swinging up or down in the near distance future -- you can sell the longer timeframes, say, six months to 18 months, so that you can get paid big premiums while your options will most likely get exercised in a very short timeframe, paying you the premiums that were meant for longer timeframes. For those of you who can't spot the trends, well, stick to the strategies outlined in this website and you'll do just fine.
As you can see, you can use this strategy over and over to keep generating income and be a long term investor and not worry about how the market is doing. This is kind of a peace of mind trade!
But here's the best part:
Let's assume that Exxon Mobil's is trading at just under $67.50 a share, say $66, at expiration. Now you're obligated to buy 100 shares of Exxon Mobil's at $67.50 a share (which comes to $6750 = 100 x $67.50.) Remember that at the time of this trade Exxon Mobil was trading at around $75 a share and now it is trading $10 lower.
Again, no worries! You're still ok. You already set aside that money in your account to cover the trade. After buying your 100 shares of Exxon Mobil's (at $67.50 a share instead of $75 a share) and then subtracting the premium you collected for the sale of the put option ($67.50-$2.50), you now own Exxon Mobil's at a discount price of $65.00 per share.
Do you see what just happened? You saved 13% on your purchase of Exxon Mobil's shares. Had you not decided to trade the put option and bought the stock outright at $75 a share instead, you would have still in the red because the stock is trading about $10 lower. So trading options has advantages because if the stock is up, down or sideway, you make money.
But what if the stock on XOM is going higher and the option is not getting exercised? Where is the discount? Well, in that case, you still have the premium to keep as pure profits while doing very little work, and you can repeat the same strategy on the same stock again or move on to a different stock. There are thousands of BLUE CHIP stocks that you can choose from. This way, it takes the guessing game of trying to predict which way the stock is going to go away from you. You don't care which way the stock is going, you still make money in the long haul.
You might wonder and ask, "Why do I have to go through all this trouble to buy Exxon Mobil while I can just wait for Exxon Mobil stock to drop and buy it outright?" I suppose you can if you're good at prognostication, but for those who cannot predict how the stock is going to be, this strategy works very well.
Now you have one more choice to make...
You can immediately turn around and sell your Exxon Mobil's shares for $66, a quick $100 profit (100 x [$66 - $65)]. At this point, your gain is $350.00 ($250 from premium + $100 sale of equity), a 5% return on your investment in a short period of time. You can repeat this pattern of trade over and over forever.
Or other alternative is that, you can just go ahead and keep them to maintain a long position in a solid Blue Chip stock that pays forward annual dividend yield of 4% and sell a covered call against your long position to make even more money. So using a combination of cash-secured put and covered call are great ways to earn huge returns long term wise. See my other tutorial on covered call.
No question about it, selling put options is a simple, versatile options strategy. Not only can you use this strategy to generate recurring income, you can use it to buy shares of good, quality companies at discounted prices.
However you choose to use the put selling strategy, it's a powerful tool for boosting returns.
One special note about selling put strategy is that it is a good time when the risks of selling put are balanced because people trade when risks are out of balance (or volatile). Risk is balanced means when stocks are calm and not volatile. So this strategy is good when underline stock is not volatile. So what you look for in stocks of this type are stocks that don't swing wildly regularly.
Here is a summary of the put strategy to help you understand better:
Option traders have an advantage over stock traders because, when the timing is right, they can buy stocks at a discount. How do they do it? They sell put options on stocks they want to own and then wait for the price to fall. Sound complicated? Surprisingly, it's quite simple once you understand the basics. Let's start from the top and take a look at the first step you need to take to start putting this strategy to use in your own portfolio.
- Step 1: Find a Stock You Want to Own.
The first step to take when looking to buy stocks by selling puts is to find a stock that you would like to own. After all, in the end when you employ this strategy, you are hoping to own the stock as a part of your portfolio. And since you wouldn't just go out and buy any old stock in a standard stock trade, you shouldn't just settle for any old stock when implementing this strategy. This may seem obvious, but when we get into the next step, you will see that if you don't start with Step 1, it is easy to be tempted to simply sell puts on the stocks that are offering the highest premium-which can be a big mistake.
When you're looking for stocks you would like to own, make sure you look for stocks with strong fundamentals -- especially in turbulent markets because they have a good chance of rebounding faster than other stocks. - Step 2: Sell Put Options
Your next step to buying stocks at a discount is identifying which put option you are going to sell and then selling it. As an option seller, you have three choices when looking at which put option to sell. You can sell the at-the-money option (ATM), an out-of-the money option (OTM) or an in-the-money option (ITM). When selling puts to buy stocks, you are typically going to use an at-the-money put option. At-the-money options offer a nice balance between paying a good premium and giving you a good chance of actually having the stock put to you.
The premium you receive for selling the put option directly impacts the discount you will get on your stock purchase if the stock is put to you. The higher the premium, the better the discount. As I mentioned above, some stocks offer extremely high premiums on their put options either because the stocks are extremely volatile or everybody believes the stock is going to be moving lower. If you haven't done your homework and determined that the stock is one you would want to own, you may be tempted to go for the stock with the highest premium. Don't fall into that trap and always do your homework!
- Step 3: Manage Your Trade.
Once you have sold your put option, it is time to sit back and see what happens to the price of the stock. Basically, one of the following four things can happen to the price of the stock:
- The stock price can go up a lot
- The stock price can go up a little
- The stock price can go down a little
- The stock price can down a lot
The Stock Price Goes Up A Lot: If the stock price goes up a lot after you sell the at-the-money put option, you don't have to do anything. [To be honest, you don't have to do anything at all after you sold your put options regardless of the scenarios -- the brokerage system takes care of everything.] The put you sold will expire worthless, and you get to keep the premium you received when you sold the put.
The Stock Price Goes Up a Little: If the stock price goes up a little after you sell the at-the-money put option, you most likely won't have to do anything. The put you sold will most likely either expire worthless or will expire with too little intrinsic value to be worth exercising. Both outcomes allow you to keep the premium you received when you sold the put.
The Stock Price Goes Down a Little: If the stock price goes down a little, the person who bought the put from you may choose to exercise the option, and you will have to buy the stock at the strike price set in the option. But since you sold the put on a stock you wanted to own anyway, this is a terrific result. You now own the stock you wanted, plus, you get to keep the premium you received when you sold the put. [Again, you don't have to do anything at all -- the brokerage system takes care of everything.]
The Stock Price Goes Down A Lot: If the stock price goes down a lot (below your breakeven point), the person who bought the put from you will definitely choose to exercise the option, and you will have to buy the stock at the strike price set in the option. But once again, since you sold the put on a stock you wanted to own anyway, this is a terrific result. You now own the stock you wanted, plus, you get to keep the premium you received when you sold the put. Of course, if you see the stock dropping below your breakeven point, and you decide you don't want to buy the stock after all, you can always buy back the put you sold and exit the trade.
Additional Bonus Strategies:
This strategy is a little advanced for you beginners but it's not too complicated because I'll layout the instruction in a clear and concise manner. This strategy is being used by experienced traders on a daily basis because it reduces risk and lowers your investment costs by balancing debit against credit. Again, this is just a bonus strategy and you do not need to use this strategy if you don't feel comfortable doing it.
Remember that in options you can buy or sell calls or puts. Buying calls or puts will cost you money in the amount of premiums you have to pay, while selling calls or puts will earn you money in premiums you receive from the buyer.
Here, we intend to buy one put contract and also sell one put contract simultaneously. This is called a bear put spread because this strategy profits if the stock trades downward.
Check out the tutorials on options spreads: Option Spread Strategies. NVDA Stock Options Play: (Taken out of my actual trade I've made that resulted in a very descend profit).
As of August 27, 2018, Nvidia (NVDA) stock was trading at $277 a share, so we want to buy NVDA October 19, 2018, $270 (strike) at $12.40 (premium) put, and sell NVDA September 28, 2018, at $265 (strike) @ $5.25 (premium) put for a $7.15 net debit ($12.40 - $5.25). Maximum risk on the trade is $715 per spread (100 * $7.15). Ideally, NVDA stock closes near the $265 strike price at September expiration to realize the maximum gain.
This trade strategy is widely being used by experienced traders to anticipate a pull back from NVDA recent run-up from around $253 a share to an all-time high of $282 a share. So traders expected this stock to take a breather from its fast run-up and make a pull back to around $260-65 a share within the timeframes of the trade. However, long term wise, traders expect NVDA to rise again. So experienced traders make use of this run-up and pull-back market cycle to their advantage.
In multple legs strategies, experienced traders use the buys and sells combination to increase odds of profitability while minimize risk and at the same time can lower investment cost by balancing debit and credit combinations. As you can see in the above example, you receive some credit to offset the debit that you have to pay and thus reduces your overall cost of the trade.
Make note of the $265 strike because I and other traders don't think that NVDA stock will drop much lower than $265, or worse case scenario, lower than $260 a share. They think the support level is between $260 to $265 a share within that timeframe. So if you anticipate a stock's support and resistance levels, you can use credit spread strategies to your advantage like experienced traders do on a regular basis.
You can mimmick this (bear put spread) trade on other stocks that have a short term bearish sentiment outlook within the timeframe of your trade. Use this example as one of your strategies to make trades on a regular basis to earn quick profits. The important key to remember is that, make sure you buy a put at the strike price higher (e.g., $270) than the selling strike price (e.g., $265) of the put. If you are approved of a trading level of 3, you can use this strategy to trade to your advantage.
Notice that the selling of the put has to have a shorter expiration date than the buying of the put -- September 28 vs. October 19. This is to give the stock a little more time to turn bearish because the stock may not garner enough bearish momentum from its recent runup. So give it a little extra time to give your position a chance to make a downsize bearish move. The gap between the two periods are not important and its based on your perception of the bearish sentiment of the stock. Try it on a regular basis and see for yourself.
Conclusion
Selling put options is a simple, versatile options strategy. Not only can you use this strategy to generate recurring income, you can use it to buy shares of good, quality companies at discounted prices.
There you have it, selling put options strategy is a powerful tool for boosting returns.
What is a covered call option?
A covered call option is when you buy (go long) on an underlining (stock), say, a Citygroup stock in the amount of $6700 (at $67 a share for 100 shares using your out-of-pocket money [no margin money]), and simultaneously turn around those shares and make a "call sell options" for options buyers to buy 'the right to own' your Citygroup stock in the future.A simplier way of saying is that, you buy a stock in the process of giving up that stock to someone else so that you can collect premium in the process. You might wonder, if you think a stock is going to go up, why giving up the right to profit on that stock to someone else and collect only a tiny premium in the process?
Well, as always the case, it would be nice if your guess in which way a stock is heading is always correct. But your guess might not always correct and to protect your wrong side guess, you need to take steps to minimize your losses and maximize your gains as much as possible by using a covered call method of trading. But your gain won't be as limitless as if you hold that stock outright yourself. So you need to decide whether you want a consistent streams of income plus some upside potential or an outright upside potential.
Statistics show that consistent streams of income plus some upside potential such as using covered call method of trading is way more profitable than trying to hit a home run by buying a stock and hope for a huge move on the upside. However, occasionally it does happen. This tutorial's intention is not trying to hit a home run and getting rich very quick in a very short time but to consistently earn a descend return on your long term investment.
Let's see an example to help you understand better:
First, you buy, let's say, 100 shares of Citigroup to allow you to sell one contract. Buy as much as you want to sell covered calls. But for this example, we're going to buy 100 shares to cover one contract. As I write this (March 26, 2018), the stock is trading for around $67 per share. Your total cost should be around $6700 (plus commissions of $5 to $8). Again, this is an example, yours might be a cheaper stock.
Here's what you do:
In technical term, you would in your brokerage account web interface select the type of trades you want to trade: stocks or options. In this case, you want to trade stocks and you select 'stocks' from the panel and the interface displays the stock pane for you to buy or sell. You select the symbol of the stock, select the "Buy to Open" (you're opening a position as a buyer so that you can buy the stock -- and buying that stock outright paying full price), select the type of trade: market order or limit order and submit your order.
Note: the order of items mentioned in this web interface tutorial may be arranged in different order or placed at different configuration but they all should be there in your web interface.
Market order is where you will buy your stock at any price set by the market and limit order is where you set your price you want to buy and if your price is not met, your trade won't be executed.
Most experienced traders always set their own price in order to extract every penny available from the market since every penny multiplies hundreds and thousands of times can add to a significant sum of money.
So if you want your trade to be executed at any price on the market, just select "market order." For more, see my tutorial on "Introduction to Options."
Now wait for a few seconds for the trade to be executed by the brokerage system. Try to refresh your interface and double check if the trade is executed. If it is, you now own the stock you wanted. At anytime from now on you can decide whether to hold your stock outright for yourself or give other investors the right to profit from your stock by selling a covered call (also called writing a covered call.)
If you decide to write a covered call, go to the next step.
Second, turn around and sell a call option on the 100 shares of Citigroup you'd just bought. This is one call contract.
Notice that you don't actually use the term covered call in your order: you use call. The name covered call exists only in term of strategy in discussion and not in the actual trading technical term. So the covered call is actually a buy of the stock to go long and a sell of 'the right to own' that stock; hence, step 1: you buy the stock outright and step 2: you sell the 'right to own' your stock to someone else.
A typical options order entry screen interface platform for entering orders looks something like this:
Notice that the various key items in the screen interface maybe arranged in different order and location for different brokerage services interface, but all the items should be there.
In technical term, you would in your brokerage account web interface select the type of trades you want to trade: stocks or options. In this case, you want to trade options and you select 'options' from the panel and the interface displays the options pane (similar to the above screen pane) for you to trade.
Next, select the symbol of the stock, select the expiration date, select the type of trade (in this case, a "Call"), select the "Sell to Open" (you're opening a position as a seller to sell the option and you're giving someone else the right to own your stock), select the quantity of the option [1 for one contract], select the price of the option premium you want to sell [again, in return, you receive the premium from the buyer].
That last item maybe calculated automatically by the brokerage system on some systems, and in that case, you only need to select the "strike price" instead of the "premium."
If you are not sure what price to sell, you can just select market order in which case your price will be whatever the market is trading at the time of your trade. Most experienced traders always set their own price in order to extract every penny available from the market since every penny multiplies hundreds and thousands of times can add up to a significant sum of money.
If you're not picky for having to give the market a few pennies here and there, you can just select "market order" and leave it to the mercy of the market to skim some pennies from you.
Next, click on "Preview" to see your order and if it's what you entered, click "Send" or "Order," depending your interface.
That is it! Very simple!
Now you don't have to do anything else but wait for the expiration date to arrive. Once it arrives, you don't even have to do anything at all; the brokerage system takes care of everything.
Meanwhile, you can start working on your next trade because at any time from now until expiration, your outstanding covered call option may get call~ed away from you (meaning get exercised). Once it does, you can pull the trigger on your next trade. Just keep repeating this process over and over and over again.
For Illustration Purpose:
[Remember? You buy a stock in the process of giving up that stock to someone else and earn premiums! That's the whole idea!].
In options lingo, selling a "covered call" is called "writing a covered call." There are two steps for this process:
Step 1: Buy the stock for the purpose of selling the right to own the stock to someone else.
Step 2: Sell a call option or writing a call option. Writing a covered call option means that you're giving other investors the "right to buy" your 100 shares of your stock that you'd bought and currently are holding them.
The call option you sold requires you to deliver your 100 shares of the stock if the option is exercised. That can happen anytime between the time you sold and the expiration date of the option. Remember that you need to hold your stock until the option expires.
As of this writing (March 26, 2018), the call option you want to sell is the Citygroup stock quoted for April 27, 2018 (expire in one month) with a strike price of $67.00 for a premium of $3.50 per share. OK, you bought a Citygroup stock at $67 a share and turn around and sell a covered call for the same amount as you bought them.Why would a buyer of your option want to pay you $67 a share while he can purchase the same stock outright on the open market? [That was a trick question.] No, the buyer's intention was not to tie up their capital (in this case $6700) and only want to leverage their money (spending very little money to control a huge position).
But you, on the other hand, don't mind spending a huge capital on the stock. So it's kind of a "win-win" for both you and the buyer of your options. Let's face it! You put your money in your checking or savings accounts at your local banks to earn interest of about 1% or less anyway, and you're basically doing the same thing here but receiving way more returns on your investment.
You will receive the premium of $3.50 per share. By selling the call option, you collect $350 cash ($3.50 X 100 shares). You might wonder: how do I pick the right option to sell? There is no right or wrong answer to this question. You just pick one out of many possibilities and done with it! You don't need to use sophisticated method to quantify and tell you what the optimum price to trade because you're selling for premiums and the higher the premiums the better for you. But as a general rule of thumb, try to sell your call option at a strike price slightly higher than the price you paid for your stock or slightly higher than the current trading price of the stock.
I found that selling about 2 to 3 percentage points slightly higher than the current trading price of the stock is optimal, but then again, you don't have to stick to my taste of trading -- just pick a strike price slightly higher than the current trading price of the stock and you'll be on your way to profitability.
So the only key point to remember here is: pick a strike price slightly higher than the current trading price of the stock.
Remember that the more time there is until expiration, the larger the option premium the buyer must pay you [the seller] since the longer the time the more chance of a stock to go up in value. You don't care what the condition of the market is going to be during the timeframe, and you don't care if your stock is going up or not during that time. In other words, you don't care if your stock is going up, down or side way. Your strike price is set and you just received the premium and that's all you're looking for. So just a general rule of thumb: pick the highest premiums to trade! Not all the time but most of the time. I usually look at the open interest and see if there are a lot of contracts are being traded on a particular option, and that's the one I'm focusing on. So you sort of riding the "co-tail" of other traders.
[A side note: to those people who have IRA or 401k accounts: you can use this very safe investment strategy to boost your investment returns instead of invest in other types of investments. Signup an IRA account with a brokerage service and transfer your IRA/401k accounts to your account at the brokerage and start trading using this covered call strategy.]
Here's where the numbers get interesting.
You bought the stock for $6700 and you sold an option collecting $350 almost instantly and it is for one month and for one contract. That's a 5% return for doing very little work. This $350 is yours to keep no matter what happen to the option. But wait, it gets even better.
The call option you sold requires you to deliver your 100 shares of Citigroup if the option is exercised. That can happen anytime between now and the expiration date of April 27, 2018. Here's the great part if your option gets exercised (or get called away from you), you get $67 per share for your Citigroup stock or $6700 cash! In other words, you get your original investment in full! Again, this is an example using an ITM call. You can sell your options at out-of-the-money (OTM) as well, or even go deep ITM as well. Again, there is no right or wrong on the choice you make. But as a general rule of thumb, try to sell your call option at a strike price slightly higher than the price you paid for your stock or higher than the current price of the stock.
This is a safe strategy for guaranteed retirement income.
A little quick math shows you make $350 selling the option, plus a profit of $0 on the equity side if the option is exercised. That's $350 of pure profit on an investment of $6700. An easy money return of 5%. Notice in this example, the profit on equity side is $0 because I chose the strike price to be an ITM at exactly $67 a share. In your case, you might want to sell your strike price at a higher price than the price you bought your stock.
So the key point to remember here is: pick a strike price slightly higher than the current trading price of the stock.
One word about risk: you need to hold Citigroup stock until the option expires. If you sold your 100 shares of Citygroup prior to its option expiration date, you still owe option buyer 100 shares of Citygroup if that buyer decides to exercise his/her options and you must come up with 100 shares of Citygroup -- which usually means that you'll have to buy 100 shares of Citygroup at current price to pay back the buyer.
If Citigroup runs up to above $70.50 a share, whoever bought your call option is going to exercise their option and make a lot of money in the trade and laugh all the way to the bank. But you'll still make money from the deal -- (not as much as if you hadn't sold the call option). Notice for the buyer of your option, the stock has to trade above $70.50 to be a profitable trade because the buyer had to pay you the premium of $3.50 a share, so $67 + $3.50 is $70.50.
If Citigroup stays below $70.50, whoever bought your call option is not going to exercise their option; and therefore, leaving you holding the 100 shares of Citygroup for yourself. Of course your stock has fallen in value and worths less now. But you get to keep the money from selling the call option (premium $350) and the 100 shares of Citygroup.
Who knows giving it sufficient time, Citygroup stock may rise up in value substantially and even to a point you can make a profit from it. Not only that, as soon as the contract is settled or expired, you repeat the same process just outlined and make more money consistently. But you have to pick stable BLUE CHIP stocks and focusing on long term investment. Your stocks will swing wildly once since awhile but in the long run your stable BLUE CHIP stocks will go up and your investment will prosper.
I briefly mentioned about people with IRA/401k accounts can use this strategy to boost investment. For this strategy to work in your favor, you have to pick stable BLUE CHIP stocks and repeat the outlined process repeatedly in however timeframes you desire: whether it is monthly, quarterly, semi-annually or yearly, or even weekly. Be consistent with your timeframes -- meaning, be consistent picking your expiration dates.
You don't have to use all of the IRA/401k balances to use with this strategy. Just set aside a portion of the balances for this strategy and leave the rest with your other investment types. I wouldn't tell you to do it if it's not safe.
Remember that this is a long term investment strategy and we don't care what the market is doing daily, monthly, quarterly or yearly.
I'm sure you see the power in this simple technique and you can clearly see the thinking behind the use of the covered call method of options trading. It's a very good tool to use in almost any kind of market condition.
Examples of blue chip stocks are Walmart, Mcdonalds, Google, Apple, Facebook, Microsoft, Intel (INTC), 3M, AbbVie, Merck, Johnson & Johnson, Bristol Meyer, Exon Mobil, Chevron, Hess, Bank of America, Citygroup, Goldman Sach, Yum! Brands, Pepsi, Coca Cola, GM, Ford, etc. If you don't like the list that I mention here, there are thousands of blue chip stocks out there that you can choose from. You don't have to choose from the list here. You can find your own blue chip stocks that fit your personal preference.
Here are my top picks (as of March 31, 2018) in that preferential order for long term investment that you can use to trade cash-secured puts and covered calls or just buy and hold for the long term:
1. NVIDIA Corporation (NVDA), stock price on March 27, 2018: $225.52 (pre-splits -- the original unsplit price) ===> to be a force in chips for video games, AI and machine-learning technologies, also continues to lead the charge in self-driving cars. My 5-year target: $320 (pre-splits -- the original unsplit price) a share. Most analysts have this stock at $825 (pre-splits -- the original unsplit price) a share on average in 5 years. But I like to keep my expectation low to avoid disappointment.
Update: June 25, 2025. Nivdia stock: $154/share. Update: June 10, 2024. Nivdia stock: $121/share. Today, June 10, 2024, Nvidia Corp. begins trading on a post-10-for-1 stock split. From now on the stock base point per share to gauge is $121 per share (and not the pre-split $1,224.40 per share on Wednesday June 5, 2024). This is the second time in less than two years that Nvidia stock is split -- a very good sign that the stock is doing very well. Nvidia's stock closed on Wednesday June 5, 2024, pre-split of $1,224.40 per share. Update: July 14, 2023. Nivdia stock: $481/share (post-splits). Update: June 13, 2021. Nivdia stock: $410/share (post-splits). Update: Remember that Nivdia stock was split on May 21, 2021 and began trading on a post-split of: $194/share. Now (as of June 13, 2023) the stock is worth more than twice the post-split share of $194/share. If you had bought the stock and held it since I recomended: CONGRATULATION!!! Update: July 21, 2021. Nivdia stock: $194/share. Nvidia Corp. today begins trading on a post-4-for-1 stock split. From now on the stock base point per share to gauge is $194 (and not $819) per share. Update: July 2, 2021. Nivdia stock: $819/share. Update: May 21, 2021. Nivdia stock: $598/share. Nvidia Corp. today announced it would split its shares 4-for-1 in an effort to make them more accessible to investors and employees. You can think of a stock split as exchanging a $1 bill for four quarters. The total value is the same; it's just divided into more pieces; or for a reverse split, it's just combines more shares into smaller shares, giving you less shares but not less amount of money that you get. Stock splits don't change the fundamental value of a business. So for a 4-for-1 split is in many ways like exchanging a $1 bill for four quarters. In the end, you get the same amount of money for your stock holding. The split, in the form of a stock dividend, is subject to shareholder approval at the Santa Clara, California-based company's annual meeting on June 3, 2021, Nvidia said in a statement today Friday. The move, if approved, would increase the common stock to 4 billion shares. The shares jumped 3.1% as trading got underway in New York earlier today Friday. Currently Nvidia has about 622.4 million shares outstanding, valuing the company at $363.8 billion, based on Thursday's closing share price of $584.50. The stock has gained 12% so far this year (2021). If shareholders approve the plan, each Nvidia stockholder of record on June 21 will receive a dividend of three additional shares of common stock for every share held, to be distributed after the close of trading on July 19, 2021. Trading is expected to begin on a stock split-adjusted basis on July 20, 2021. Update: October 27, 2020. Nivdia stock: $536/share. The stock is now at $536/share, surpassing my 5-year target of $320 per share. Better yet, this company is growing rapidly in a 'breakneck' speed through in-house inovations and outside acquistions. So the future is very bright. The management is very smart in using their 'skyrocket' high stock price to buy these valuable companies without denting their cash on-hand. That's what you can do when your company's stock is as high as NVIDIA is - it gives you leverage and power to do things that otherwise would not be possible. Nvidia reminds me of Amazon just a few years ago when Amazon stock was already trading around $500 per share and the stock was moving up steadily ever since [February 26, 2016 at $555 per share; October 27, 2017 at $1,100 per share; May 11, 2018 at $1,603 per share; November 11, 2019 at $1739 per share; March 27, 2020 at $1,900 per share; May 29, 2020 at $2442 per share; September 4, 2020 at $3294 per share; June 22, 2021 at $3505 per share]. Let me clarify my view on this comparison: Nvidia is not Amazon nor will it perform like Amazon stock in the future. It will never be anything near what Amazon has done -- no stock is nor will be. However, the strategy that Nvidia employs recently resemblances the strategy that Amazon employed leading up to their current high performances of its stock. The purchase of ARM is a very smart move by Nvidia's management and it will do a lot of good for the future of this company. Will its stock performs like Amazon's stock in the future? We'll see! And time will tell! Here is the synopsis from the press release: Unites NVIDIA's leadership in artificial intelligence with Arm's vast computing ecosystem to drive innovation for all customers NVIDIA will expand Arm's R&D presence in Cambridge, UK, by establishing a world-class AI research and education center, and building an Arm/NVIDIA-powered AI supercomputer for groundbreaking research NVIDIA will continue Arm's open-licensing model and customer neutrality and expand Arm's IP licensing portfolio with NVIDIA technology Immediately accretive to NVIDIA's non-GAAP gross margin and EPS Consideration of $40 billion to be met through a combination of NVIDIA shares and cash
Please see Here is my definition of "dollar cost average": "Stocks rarely go up in a straight line." Just remember that definition when you think of a dollar cost average. Because of the nature of stocks, which rarely go up in a straight line, it makes a great strategy for a long term investment. Update: July 2, 2021. AbbVie stock: $115/share.
Update: July 2, 2020. Nivdia stock: $384/share, surpassing my 5-year target of $320 per share.
Update: November 16, 2018. Nivdia stock: $163/share.
Synopsis: Nvidia Stock Crashes After Earnings Guidance and Cryptocurrency Fears.
Nvidia shares fell steeply after the chipmaker gave weak fourth quarter revenue guidance when it reported third-quarter earnings after the close on Wednesday, November 15, 2018. I call it a "crash" based on from where the stock was trading around $280 to $293 a little over a month ago -- October 2, to be more precise.
NVIDIA today (November 15, 2018) reported revenue for the third quarter ended Oct. 28, 2018, of $3.18 billion, up 21 percent from $2.64 billion a year earlier, and up 2 percent from $3.12 billion in the previous quarter.
"AI is advancing at an incredible pace across the world, driving record revenues for our datacenter platforms," said Jensen Huang, founder and CEO of NVIDIA. "Our introduction of Turing GPUs is a giant leap for computer graphics and AI, bringing the magic of real-time ray tracing to games and the biggest generational performance improvements we have ever delivered.
"Our near-term results reflect excess channel inventory post the crypto-currency boom, which will be corrected. Our market position and growth opportunities are stronger than ever. During the quarter, we launched new platforms to extend our architecture into new growth markets -- RAPIDS for machine learning, RTX Server for film rendering, and the T4 Cloud GPU for hyperscale and cloud."
Capital Return
During the first nine months of fiscal 2019, NVIDIA returned $1.13 billion to shareholders through a combination of $855 million in share repurchases and $273 million in quarterly cash dividends.
In November 2018, the board of directors authorized an additional $7 billion under the company's share repurchase program for a total of $7.94 billion available through the end of December 2022.
NVIDIA announced a 7 percent increase in its quarterly cash dividend to $0.16 per share from $0.15 per share, to be paid with its next quarterly cash dividend on December 21, 2018, to all shareholders of record on November 30, 2018.
NVIDIA intends to return an additional $3 billion to shareholders by the end of fiscal 2020, which may begin in the fourth quarter of fiscal 2019.
What does this mean for long term investors, which I am targeting?
Well, if you already own the stock, don't sell but hold on to it in hope that it will recover and maybe turn a profit in the long run, say, in five years. So don't panick!!!
Another excellent strategy is to buy more at these lower prices, turning it into a "dollar cost average" strategy that works wonderfully awesome over a period of time. That's what I would suggest you do: buy more shares at these lower prices and if the stock drops some more buy some more shares to make the dollar cost average works favorably for you.
Bottom line: the fundamental of the company is very much sound and you should stick to the long term horizon instead of panicking to crashes like this one. Remember that stocks rarely go up in a straight line; so the stock market is like sex: there's highs and there's lows and it feels the best just before it ends too soon and it never last long either. As with sex, you'll just have to keep trying for more to get the most out of it.
Goldman said it remains "Buy-rated on the stock as our view that Nvidia has access to
one of the best growth opportunity sets in Semis and that it has a sustainable
competitive lead within remains unchanged."
"The stock will likely not bounce back right away,
given the severity of the miss," Morgan Stanley said.
Wells Fargo Analyst:

Concerns (and now frustration) over a significant gaming channel inventory burn-off
have materialized ... While we can appreciate that NVIDIA's weak F4Q19 outlook is
impacted by a 1-2 quarter work-down of Pascal mid-range gaming card inventory in the
channel ($600M; assuming no sell-in in F4Q19 as crypto-related dynamics flush through
the channel), couple with a seasonal decline in game console builds, we think
investors will be frustrated by NVIDIA's comments exiting F2Q19 that:
"...we [NVIDIA] see inventory at the lower-ends of our stack...inventory is well
positioned for back-to-school and building season that's coming up on F3Q19..."

Bottom Line: Well, even if we model a strong double-digit growth in DCG next year,
we think there is a high likelihood that NVIDIA will not grow next year.
We are modeling for as such.

The large shortfall in guidance due to a bloated channel due to crypto-currency is in
sharp contrast to the comments around channel inventory from the company at the
last earnings call. Our estimates and target price are going lower.
We remain Market Perform rated.

We are Buyers on weakness.
SunTrust Analyst:

The surprisingly weak Q4 guide appears temporary.
NVDA guided Q4 20% below consensus revs as the company halts 1/3 of gaming segment sales
to flush channel inventory built during the crypto enthusiasm in 1H18.
This badly damages near-term revenue and profits, but Datacenter, Pro-Viz,
and Automotive results support our structural growth view.
Gaming resets our 2019 & 2020 EPS to $7.33 & $8.70 (from $8.18 & $9.59).
PT goes to $237 (from $316) based on 30x (17x discount to rapid-growth tech peers)
our CY20 EPS, discounted back 1 year. Buy.
RBC Analyst:

Going forward, we think the focus will now shift to Data Center as gaming expectations
are now reset due to crypto currencies and a product transition (Turing) which will
unlikely ramp until around the Jul-qtr time frame. Net Net: we lower our price target
due to the lower than expected results (PT to $260 from $310).
Positively, gaming and Pro Visualization will likely be up q/q in January helping gross
margins and offsetting the material gaming weakness.
2. Abbvie Inc (ABBV), stock price on March 23, 2018: $97.46 ===> a drugs maker selling top drugs like Humira, Revlimid, Enbrel, Rituxan, Herceptin, etc. The company announced in February 2018 that it set aside $10 billion for shares buybacks of about 87.6 million shares, or 5.5% of the shares outstanding, starting in May 2018 and continues to the end of the year.
AbbVie Synopsis
The performance of AbbVie (ABBV) shares through 2018 thus far up to June 30th (2018) can be characterized as lackluster. It has performed similar to the S&P 500 and is just above break-even at .8% return on the year. A lot of pessimism is built into the share price relating to two failed clinical tests by Rova T and Imbruvica. The stock market is beginning to question AbbVie's pipeline of 20 drugs and its ability to supplement the massive growth in sales of its Humira drug line.
Humira has been a massive success. It is an extremely profitable drug for AbbVie and it accounts for over 66% of its net revenue ($18.4 billion). The company secured a deal with Samsung Bioepis and partner Biogen (NASDAQ:BIIB) to fend off generics until 2022. It has been developing immunotherapy cancer drugs and is reliant on research and development to internally develop a Humira replacement which will decrease its reliance and revenue concentration risk.
Its second top-selling drug is called Imbruvica. This drug can differentiate between cancer cells and regular cells. It inhibits the growth of certain cancer cells caused by lymphoma and leukemia. Imbruvica will generate greater than $3.3 billion in sales during 2018 and management projects a terminal revenue level of $7 billion in sales in the next few years.
AbbVie is a cash flow machine, it generates $10 billion of free cash flow a year and it consistently increases the capital repatriation to shareholders. The company pays $3.76 dividend per share, which equates to a 3.94% yield based on a closing price of $95.41. This strong cash flow generation has created significant assets and the ability to leverage its balance sheet to make an acquisition to stave off revenue decline from the Humira patent expiration into 2022.
This isn't your typical one drug value trap biotech stock like Gilead (GILD); it has substantial growth opportunities in the pipeline and remains a candidate to make an acquisition.
Summary
Analysts estimate the 5-year revenue compound annual growth rate will average 17%, which is significant for a company with a $146-billion market capitalization. With the 5-year revenue compound annual growth rate on average of 17% should propel the company's market capitalization to around $300 billion or close to it.
This is a very solid company that consistently has increased its dividend regularly at a good percentage. My 5-year target: $200 a share.
As of July 31, 2018, I'm adding a new stock and squeeze it in as the third-rated stock: Texas Pacific Land Trust (TPL). This stock doesn't have options, so you can't use it to trade cash-secured puts and covered calls.

3. Texas Pacific Land Trust (TPL), stock price on July 31, 2018: $740.00 ===> Texas Pacific Land Trust was created in 1888 as a result of a bankruptcy of the Texas and Pacific Railway Company. A company, or more specifically a trust, that is trying to go out of business and ceased to exist.
Why would I or anyone want to invest in a company that is trying to go out of business?
As they say: "... the devil is in the detail."
What exactly is in the detail? Read on.
My 5-year target: $2800 a share -- a 3 1/2 times current price of $740.00 per share.
Update: July 2, 2021. Texas Pacific Land Trust stock: $1593/share. It's Texas Pacific Land Corporation now.
Note (about the WARNING above) that TPL's annual report filed on Form 10-K and Form 10-Q filed in 2020 stated that Texas Pacific Land Trust (TPL) will become Texas Pacific Land Corporation (TPL) on January 1, 2021 -- as it will be converted from a trust to a real corporation called the Texas Pacific Land Corporation.
The trust will cease to exist and a new era begins (on January 1, 2021) as a real corporation called the Texas Pacific Land Corporation from January 1, 2021 and onward.
With the end of the Civil War in 1865, the Texas and Pacific Railway Company was created in 1871 with the goal of having a southern transcontinental railroad that rivaled its northern territory counterpart, the Transcontinel Railroad. See map below:
The Texas and Pacific Railway Company was given the right to build a southern transcontinental railroad from Marshall, Texas, to San Diego, California, with a condition that the company completed the rail line by a certain deadline specified in the federal charter.
At that time, the southern transcontinental railroad was the only railroad in Texas, and one of the few in the United States, to operate under a federal charter. Congress granted the charter on March 3, 1871 to the Texas and Pacific Railway Company to build a southern transcontinental railroad.
The company was granted a federal land grant of twenty sections of land per mile through California and forty sections through what are now Arizona and New Mexico; and the State of Texas (where there were no federal lands) agreed to grant Texas and Pacific Railway Company twenty sections per mile for the portion of the line crossing Texas.
The panic of 1873 caused financial difficulties, and by 1876 only 444 miles had been built. In 1879, Jay Gould bought the company and began laying track west. Gould merged Texas and Pacific Railway Company with Southern Pacific Railway, and by 1881 it had built a total of 972 miles of track, entitling it to 12.4 million acres of land granted in the federal charter. But because it had not built all of the line within the time required by its charter, Texas and Pacific Railway Company was awarded only 5,173,120 acres, later reduced to 4,917,074 acres - 3.5 million of that in Texas.
In 1888, the Texas and Pacific Railway Company went through bankruptcy and receivership, and the bondholders who financed the railroad were awarded the land in Texas that had been granted to Texas and Pacific Railway Company. The bondholders created a trust, Texas Pacific Land Trust, to liquidate those lands for the benefit of the bondholders, receiving 3.5 million acres of land.
The certificates of trust issued to the bondholders were later converted to shares and listed on the New York Stock Exchange (NYSE: TPL). Those orginal shares have been split several times since and making the shares outstanding larger than the original shares when bond certificates were converted. Since then, descendence of original bondholders have sold off their shares to other investors like you and me in the open market, but a very small number of them still retained a small portion of their original holdings.
The Trust was created to manage and sell the land and eventually go out of business. They have been trying to do just that for the last 130 years. As trying it maybe, the trust seems to be in no hurry to put itself out of business.
Today, the Trust is one of the largest landowners in Texas with around 888,333 acres located in eighteen different counties. Texas Pacific Land Trust derives revenue from all avenues of managing the land, i.e. oil and gas royalties, grazing leases, easements, sundry and specialty leases, and land sales. The Trust has a perpetual oil and gas royalty interest in some 459,200 acres.
The mineral estate under the land was spun off into a separate entity and later sold to Texaco, now Chevron. TPLT owns a royalty interest in some 459,200 acres of its land.
Grants of land to railroads were done on a checkerboard pattern, granting the railroad every other section in portions of the State not yet settled. The idea was that, when the railroad sold off the land, settlement and development would be encouraged along the rail line, making the sections retained by the state more valuable and ripe for settlement.
Most of the sections of the land retained by the State of Texas is owned by the University of Texas when the State of Texas granted the University of Texas most of those sections some long time ago. Today, the land is managed by the University of Texas Endowment Fund, and the University of Texas Endowment Fund earns subtstantially of investment income from oil and gas royalties from the land.
The discovery of oil in West Texas during the late 1920s and later in East Texas had a major impact on the company. During the years of peak crude oil movement the physical condition of the railroad was significantly improved, and the Texas and Pacific was able to weather the Great Depression better than many of the other railroads in the region.
Most TPLT lands are in El Paso, Hudspeth, Culberson, Reeves, Pecos, Winkler, Excor, Midland and Glasscock Counties. Much of TPLT's land is now in the heart of the Permian Basin, the hottest area of oil and gas exploitation in the nation. As a result, the value of shares of TPLT have soared, from a low of $156.60 per share in August 2015 to $740 at close on July 31, 2018.
Permian Basin daily production as a whole has soared to 3.3 million barrels of oil and nearly 11 billion cubic feet of natural gas during the month of June, 2018, according to the Energy Information Administration. TPLT revenue is derived from oil and gas from most of the output from the Permian Basin drillers, particularly, Chevron.
For a number of years past the Trust have followed the practice of declaring an annual cash dividend at their meeting typically is being held in the month of February each year. So if you're a shareholder of this trust make sure that you don't sell your holding during the first quarter of each year because you'll be missing out a possible dividend and special dividend payouts. Here is the dividend history for the past few years:
| Payment Type | Declared Date | Payable Date | Amount |
| Annual Regular Dividend | February 25, 2016 | March 16, 2016 | $.31 |
| Annual Regular Dividend | February 21, 2017 | March 9, 2017 | $.35 |
| One-time Special Dividend | February 21, 2017 | March 9, 2017 | $1.00 |
| Annual Regular Dividend | February 21, 2018 | March 16, 2018 | $1.05 |
| One-time Special Dividend | February 21, 2018 | March 16, 2018 | $3.00 |
| Annual Regular Dividend | February 25, 2019 | March 15, 2019 | $1.75 |
| One-time Special Dividend | February 25, 2019 | March 15, 2019 | $4.25 |
| Annual Regular Dividend | February 24, 2020 | March 16, 2020 | $16.00 |
| Quarterly Regular Dividend | March 08, 2021 | March 15, 2021 | $2.75 (or $11 annually) |
| Quarterly Regular Dividend | June 08, 2021 | June 15, 2021 | $2.75 (or $11 annually) |
| Quarterly Regular Dividend | September 10, 2021 | September 15, 2021 | $2.75 (or $11 annually) |
| Quarterly Regular Dividend | December 07, 2021 | December 15, 2021 | $2.75 (or $11 annually) |
As of 2020, it's the sixteenth consecutive year that the annual dividend has been increased.
As of January 1, 2021, it's the seventeenth consecutive year that the annual dividend has been increased.
Note that Texas Pacific Land Trust (TPL) has become Texas Pacific Land Corporation (TPL) -- it's no longer a trust, which has been converted into a real corporation called the Texas Pacific Land Corporation.
Summary
Original bond certificates were converted into shares of this trust and is trading in the NYSE: TPL, and these shares are required to be retired eventually and the trust will go out of business and ceased to exist.
So, how do they retire these shares? Why did it take over 130 years already trying to get rid of the shares and the trust and to no avail?
The trust's mandate was to get rid of itself by selling off lands and other properties and go out of business. Sounds like a simple idea to do, but with these valuable minerals on its properties, it's very hard to go out of business -- [to the pleasure of its shareholders.]
So the answer is: It's very hard to go out of business when you have a stream of income and the land keeps going up in value all the time. As one would expect, the trust is in no hurry to go out of business but at the same time is trying to sell off lands and other properties and using that proceeds to buy back shares in the open market and retire those shares.
So the trust isn't going out of business any time soon. To understand the significance of the trust's longivity, put yourself in the shoes of the people who are running the trust where their future is dependent on the trust's on going future as well.
Consider this:
As a General Agent, Chief Executive Officer and Secretary at TEXAS PACIFIC LAND TRUST, Tyler Glover made $699,250 in total compensation in 2017. Of this total $381,250 was received as a salary, $300,000 was received as a bonus, $0 was received in stock options, $0 was awarded as stock and $18,000 came from other types of compensation. This information is according to proxy statements filed with the SEC for the 2017 fiscal year. This is not taking into account other perks and insider privileges that these officers are receiving and benefiting annually. So the actual amount is much much higher than the required report to the SEC.
Other officers of the trust received similar compensation, which means that, their livelyhood is tied to the trust's longivity--the longer the trust stays in business the more money they make.
So understandably, it seems that the trust is trying to sell less valuable lands and other properties little by little and using the proceeds to buy off shares and retire them, while keeping the most valuable lands and other properties that are producing consistent income to the end, and that's why it takes a long time to go out of business. Put yourself in the shoes of these people and you'll realize that life can be this so easy.
Update: June 1, 2020 ====> WARNING: Please read TPL's annual report filed on Form 10-K and Form 10-Q as TPL is undergoing a major change in the company's structure!!!
Note (about the WARNING above) that TPL's annual report filed on Form 10-K and Form 10-Q filed in 2020 stated that Texas Pacific Land Trust (TPL) will become Texas Pacific Land Corporation (TPL) on January 1, 2021 -- as it will be converted from a trust to a real corporation called the Texas Pacific Land Corporation.
The trust will cease to exist and a new era begins (on January 1, 2021) as a real corporation called the Texas Pacific Land Corporation from January 1, 2021 and onward.
This means that the shares outstanding will decrease over time, little by little, while the stream of income just keep coming, driving the stock price higher and higher and higher, hence lands this stock in the third ranking of my pick.This stock could conceivably be at $10,000 a share when it winds down to the last lot of shares that the trust is buying and retiring them. But when will the last lot be bought out? Judging by the pace of the trust, it looks like at least 50 more years before this trust is out of business. What does it mean as a shareholder of this trust to be the last lot of the shares to be bought out?
It means that your shares will be bought out at that price. Since everybody is trying to hold on to their shares the stock price will remain high to the end, unlike other stocks where shareholders may view that their shares may not find enough buyers.
With this stock, we know that the trust will have to buy back the remaining shares outstanding, so there is an absolute certain that the shares will be bought out eventually -- the trust has no choice but to buy out the shares -- that's what its mission is.
Imagine this:
Update: June 1, 2020 ====> WARNING: Please read TPL's annual report filed on Form 10-K and Form 10-Q as TPL is undergoing a major change in the company's structure!!!
Note (about the WARNING above) that TPL's annual report filed on Form 10-K and Form 10-Q filed in 2020 stated that Texas Pacific Land Trust (TPL) will become Texas Pacific Land Corporation (TPL) on January 1, 2021 -- as it will be converted from a trust to a real corporation called the Texas Pacific Land Corporation.
The trust will cease to exist and a new era begins (on January 1, 2021) as a real corporation called the Texas Pacific Land Corporation from January 1, 2021 and onward.
You're among the last lot of shares to be bought out by the trust to cease to exist. At that time, the trust would still have some pieces of valuable land to get rid of and it tries to get the highest bid for the lands. Once the pieces of land are sold, the proceeds are used to buy the remaining lot of shares to close out the trust.The intrigue is the value of the last lot of the lands to be sold and how many shares the trust still holds at that time. So the final share price to be bought out is dependence on the total proceed of the sale and the total number of remaining shares -- and at the present time, no one can value that price this far out into the future.
What if the trust tries to keep the most valuable lands for the last lot as that is the most likely scenario? Why wouldn't the trust tries to keep the most valuable assets and generating substantial income for shareholders til the end? It makes a lot of sense in that regard and no one in the right mind would disagree with that assumption.
If that is an indication of the scenario, judging by its pass pattern and lengthy history, the trust have always tried to balance the value of its land portfolio that is beneficial to all shareholders, whether you're the first or the last lot of shareholders to be bought out. The possibility of the trust keeping more valuable lands for the end lot is enourmous. That is why it is so intrigue to hold on to your shares to the end.
This means that if you're a shareholder of this stock, the chance of you getting your money back in full is very tremendously--plus along the line you will receive dividends as well. Over time, your investment in this stock will prosper. That's my gift to you!!! And you're very welcome!!!
Update: June 1, 2020 ====> WARNING: Please read TPL's annual report filed on Form 10-K and Form 10-Q as TPL is undergoing a major change in the company's structure!!!
Note (about the WARNING above) that TPL's annual report filed on Form 10-K and Form 10-Q filed in 2020 stated that Texas Pacific Land Trust (TPL) will become Texas Pacific Land Corporation (TPL) on January 1, 2021 -- as it will be converted from a trust to a real corporation called the Texas Pacific Land Corporation.
The trust will cease to exist and a new era begins (on January 1, 2021) as a real corporation called the Texas Pacific Land Corporation from January 1, 2021 and onward.
4. Micron Technology Inc. (MU), stock price on March 27, 2018: $52.40 ===> Semi-conductor giant is leading the pack in DRAM, GDDR6, low-power DDR4 (LPDDR4) product. Moving forward, Micron is setting its sights on the self-driving car industry with a high-end memory solution. Car companies can achieve the 300GB per second data transfer rate in their fully-autonomous cars with the help of Micron's GDDR6. My 5-year target: $118 a share.
Update: July 2, 2021. Micron Technology stock: $80/share.
In conjunction with Micron's plans to return at least 50% of free cash flow to shareholders next year (2019), Micron Technology Inc. announced on Monday, May 28, 2018, that it plans a shares buybacks program worth $10 billion and will begin the buybacks in its 2019 fiscal year, which starts in September 2018 and lasts through September 2019. So the future of this stock is bright!!!
Note: these stock price projections are based on my own forward-looking analysis and not an indication of the actual future stock price performance. In other words, it's a guess! If you do play, please do so based on your risk-tolerance and affordability and target your timeframes of at least five years.
You might wonder that if I think these stocks are going higher in five years, and ask, "Why don't I recommend everybody to just buy the stocks outright and hold for at least five years?" After all, the gains may well be a lot more than the premiums received, "Why giving up the upside potential to other investors?" And on top of that you have the money to buy the stocks outright in the first place, "Why not forget about the selling of the covered call and keep the stocks for the long haul?"
I don't have a good answer to these questions other than to say if you're looking to receive consistent income with some upside potential and minimize your downsize risks, then use the covered call strategy; if, on the other hand, you're looking for huge gains but expose yourself to some downside risks, then buying and holding the stocks outright for the long haul is also ok.
These strategies fit some people's tastes but not others. You also can even do both, say, like putting half of the money aside for the covered call strategy and using the other half of the money to buy these stocks outright and hold them for the long haul. This way, you get to have both worlds!
Not only that, you can use covered call in conjunction with the cash-secured put strategy. If you really want a limitless upside potential, say, if these stocks mentioned in my picks or in your own picks go sky high and you don't want to give anyone the right to own your stocks, you would sell cash-secured puts on the stocks that you already own.
But instead of merely putting your money in your account to cover the cash-secured puts, you would buy these stocks outright (and holding them) and sell cash-secured puts against them.
This way, if the stocks rise you get to keep the premiums and the stocks, because the cash-secured puts that you sold are worthless to the buyers and they are not going to exercise the options. In other words, you get to have both worlds!
Another strategy that achieves the goal of a covered call is to use leverage (spending very little of your own money but control a huge position) to gain huge upside potential. Yes, there is a way to trade options (or covered calls) for long term investors without worrying that the expiration is approaching too soon. This is the same way you buy and hold stocks for the long haul but you only have to pay only the premium amount instead of the whole stock price.
The longest options contracts can be traded are for up to two years but the majority of them can be traded at about 12 to 18 months. For long term investors, this is too short of a timeframe to give your stocks the chances to go up in value. So using my strategy you can increase this timeframe for years and years and invest for the long haul but you only have to spend very little of your own money to control a huge position without using margin money.
Although, some of you can even increase your leverage even more by using margin money, my strategy doesn't involved margin money and that's why it is a very low-risk strategy that offers very huge upside potential.
So instead of spending lots of money to buy stocks to sell covered calls, say, in the amount of $1,000, $2,000, $3,000, $4,000 or whatever the amount is, you only have to spend only for the premium amount, say, $50, $100, $200 or whatever the premium amount is, to control a huge position for the long haul for a long term investment.
So in effect, you only spend very little of your own money to control a huge position for longer periods of time for long term investors.
Wouldn't that sound great if only you have to spend very little of your own money with only the risk is the only premium you paid and the contract is lasting a long time?
The answer is a soundly: "Yes!!!"
But this strategy is for those of you who have advanced trading accounts: level 2, 3 and have a membership with my paid "premium subscribers." Yes, this will cost you money to join as it offers you tremendous upsize potential.
On top of that in the near distance future, I will offer a subscription membership for those of you who want to earn more money aggressively using advanced strategies. My advanced strategies offer you multitudes of opportunities for aggressive investors to earn high returns in a short amount of time; and of course using safe and sound strategies.
For a very small, and negligible fee, I may in the future offer my expertise to manage an account for you for those of you who are too busy, too lazy, and don't want to waste time managing your own account but also at the same time just want an expert like myself to manage an account for you. You open an account with a brokerage service, give me the credential access only to trade your account [but not anything else] while you have full access to your account. My purpose is to trade only and nothing else so that you have full control of your account at any time. That is forthcoming for some of you!
Safety is what I stride to be for myself and for my members. I will only recommend trades that have very high probability of winning or else I won't even touch them with a ten-foot pole. Please stay tuned for further announcements per time allows. At the present time I'm too busy!!!]
[A side note: For some of you, you might want to apply for a level 2 or level 3 trading account if you want to play a naked put or naked call strategy or join in with my advanced strategies in the paid "premium subscribers" membership account to achieve high returns while maintaining high safety net. Level 2 and 3 are advanced strategies that give you leverages. See my tutorial on "Get started trading options."
So selling (or writing) covered calls and cash-secured puts is a great way to earn consistent streams of income and also gives you a limitless upside potential. If you do this consistently for 10 to 15 years you'll be on your way to your financial independence provided you start out at least $2,000 and don't take out any proceeds.
Remember that the more money you start out with or add more money in subsequent periods during your investment horizon the quicker your financial independence you'll achieve.
As they say:
"Give what you CAN, take WHAT YOU NEED!...."
I did my part and we don't need to get rich quickly! Focus for the long term and don't forget to thank me later!
Good Luck Trading!!!
A Brief Overview of Buying Puts and Calls
In my other tutorials about selling puts and covered calls, we mainly talked about selling of the options. But here, we will mainly talk about buying of the options: buying puts and calls -- or more specifically, naked puts and naked calls as oppose to cash-secured (covered) puts and covered calls.To refresh your memory from my one other tutorial called "introduction to options": Buying call options is to go long -- betting that the stock option will rise so that you can profit from the rising stock option while paying only the premium to the seller of the call option. Now you're a buyer whereas in the other two tutorials (selling puts and covered calls), you were a seller.
Likewise, buying put options is to go short -- betting that the stock option will fall so that you can profit from the falling stock option while also paying only the premium to the seller of the put option. Simple enough?
In either cases, puts or calls, your losses are limited to just the premiums you paid to the sellers, but your upsize potential reward is limitless. You leverage your position by spending very little of your own money to control huge position in stocks; and therefore, control huge upsize potential.
The technical process in using the web interface is the same as in the other tutorials but only differ from the "Sell to Open" [to open a position as a seller of the options in the other tutorials] to "Buy to Open," (here) to open a position as a buyer of the options.
A typical stocks/options order entry screen interface platform for entering orders looks something like this:
Notice that the various key items in the screen interface maybe arranged in different order and location for different brokerage services interface, but all the items should be there.
In technical term, you would in your brokerage account web interface select the type of trades you want to trade: stocks or options. In this case, you want to trade options and you select 'options' from the panel and the interface displays the options pane (similar to the above screen pane) for you to trade.
Next, select the symbol of the stock, select the expiration date, select the type of trade (in this case, either a "Call" or a "Put"), select the "Buy to Open" (you're opening a position as a buyer of either a "call" [you're opening a long position] or a "put" [you're opening a short position]), select the quantity of the option [1 for one contract], select the price of the option premium you want to buy.
If you are not sure what price to buy, you can just select market order in which case your price will be whatever the market is trading at the time of your trade. Next, click on "Preview" to see your order and if it's what you entered, click "Send" or "Order," depending your interface.
That is it! A brief overview of how to buy puts and calls.
A Long Term Investment for Kids/Teens
If you have kids/teens and want them to get interested and learn how to invest/save for their future, it's not too early to start getting them interested in investing and saving by exposing them early in their early age years to the world of savings accounts and stock market investing.
One company called Stockpile (https://www.stockpile.com/) is aiming to bring fractional share investing to mainstream investors, particularly millenials and kids/teens who lack the huge sum of money and knowledge of investing. Stockpile has raised $30 million to continue its mission.
The company received its latest cash injection from the Fidelity-backed Eight Roads Ventures, alongside traditional venture funds like Mayfield, Arbor Ventures, Hanna Ventures, Wang Ventures, and others.
"We're on a mission to make it simple for everyone -- especially young, first-time investors -- to save and invest for their future," said Avi Lele, Stockpile's founder and chief executive, in a statement. "Fractional shares make market investing fun, easy, and personal. Even someone with only a few dollars can buy a piece of a favorite brand like Amazon or Alphabet, which are currently trading close to $1600 a share," (as of this writing April 2018)
Stockpile users can open an account online or using the company's iPhone or Android app. The account is free to open, but trades cost 99 cents per trade compare to $5 to $12 per trade for traditional discount brokerage services like Fidelity Investments, Ally Financial, E-Trade, Charles Schwap, Scottrade, TD Ameritrade, Tradestation, etc.
Using the app to browse for potential investments is relatively easy. Once a user downloads the app they can browse for potential investments under categories like "Entertainment", "Kids", "Technology", and "Food."
Rather than organize the potential stock purchases under companies, the app lists the underlying brands that a user might be familiar with, and links that brand to its parent company. Which means that if a user likes the "Malibu" brand they can search for the brand and then be taken to the option to buy GM stock without having to know that the brand is owned by General Motors Company.
The company offers some basic information on the stock market in its learning section (really just some definitions of common financial terms and a bit of the arcana around stock dividends and the language of earnings reports).
Pretty much though, an investor using Stockpile is on their own. It's only a little better than picking a horse in a race because a gambler likes the name. The app pretty much makes a user rely on their feelings about a company's brand to guide their hand when making investment decisions.
Stockpile has had tremendous success in attracting the next generation of investors, and their innovative approach takes the mystery out of stock investing and opens up access to all. They sort of like putting the stock market on a gift card in similar fashion that you would normally do to your kids' periodic allowances.
Instead of putting money in a gift card for their periodic allowances for your kids/teens for their personal use, why not open up an account with Stockpile and expose them to investing/saving?
It's never too early to get your kids/teens exposed to investing/saving and you don't have to have a lot of money to do it. So start early and the sooner the better for your kids/teens! Point them in the right direction and let them see the horizon!!!
On the Long Term Investment Front There is a New Type of Investment Technique Called "Robo Advisor."
April 10 2018
A fee-free robo advisor is the latest fintech to land millions in funding.
WiseBanyan raised $6.6 million in their latest round, according to documents filed with the SEC. At a base level, the platform offers robo-investing services with no management, trading or rebalancing costs. Fees kick in when clients purchase a la carte premium services like detailed investment strategies, increased personalization or additional automation services, the firm's website says.
The increased personalization allows clients to pick and choose the services that they find most appealing.
The New York-based firm currently has $153 million in assets under management and 32,000 clients, according to their latest Form ADV filed in March. There are 32 investors currently on the offering, according to the SEC filing.
The filing highlights continued investor support for robo advisors, though a number of industry executives have questioned the sustainability of the independent model. The largest independent digital advice platforms have found millions in funding, including Wealthfront's latest round that secured $75 million in January and Betterment's $70 million last July.
Fending off challenges from larger incumbents and upstart mobile investment apps, Wealthfront landed its latest influx with a continued focus on adding more to its digital-only platform, such as its PATH financial planning feature. It has also expanded its product offerings, though its latest risk parity fund quickly became a magnet for controversy.
Hybrid advice firm Personal Capital took a different approach after securing $40 million in funding last August. Up against comparable hybrid offerings from Vanguard and Schwab, the firm reinvested in its advisor base, hiring new employees in multiple cities across the country. Betterment has taken a similar approach, directing some of its funding to retooling and expanding the appeal of its RIA platform offering.
While the competition continues to evolve in the robo space, online retirement platforms have pushed the boundaries of digital advice as well. For example, Financial Engines, an online 401(k) financial advisory firm, teamed up with human resources giant ADP to offer their digital platform to millions of potential new clients on ADP's employer network.
For now, WiseBanyan is betting a focus on clients -- not assets -- will drive continued growth for the firm, its website says.
Co-founder Vicki Zhou started the firm in 2014, according to SEC documents. With dual degrees in applied math and biomedical engineering from Johns Hopkins University, she previously co-founded a medical device company and invented a patented surgical device, according to the firm.
WiseBanyan completed its seed funding round in 2015, which included John Hancock Investments as an investor.
What is a Stop Loss?
A stop loss is a type of order designed to protect investors from significant losses. It is an automatic order trigger that automatically activated once a price condition is met.
One of the most commonly used methods for limiting losses from a declining stock is to place a stop-loss order. Using this order, the trader will set the value (or price) based on the maximum loss he or she is willing to absorb. Should the share price drop below this value, the stop loss turns into a market order and will be triggered a sell order. Once the price falls below the stop level, the position will be sold and closed at the current market price, which prevents any further losses.
Online brokers offer various types of orders designed to protect investors from significant losses. The most commonly used order is a stop loss, but active traders should also consider using the trailing stop (loss). When these tools are combined, they become even more powerful. See trailing stop next section.
A stop loss can be implemented during the initial entry point (buying) or at any time thereafer. A typical stocks/options order entry screen interface platform for entering orders looks something like this:
Notice that the various key items in the screen interface maybe arranged in different order and location for different brokerage services interface, but all the items should be there.
As you can see from the screen interface, you can set your stop loss by clicking the bullit point option under price category. You can use the same screen to place a "stop loss" order on the position you already hold -- the existing position that doesn't have a stop loss on it. If you need to modify a "stop loss" on a position that already have a "stop loss" on it, you need to cancel it and start over again. If you're not sure on how to do it, just ask your brokerage service agent for help.
An example of how it works:
Suppose you're buying 100 shares of a stock that is currently trading at $10.50 a share. In the the price category stop option, click on the bullit point and enter the price, say $9, you want to sell your stock in the box next to the stop option. [Self-explanatory]
What is a Trailing Stop?
A trailing stop loss is an automatic order or auto pilot order that monitors and adjusts the stop loss accordingly based on the movement of the stock. It trails or follows the price movement of the stock by the margin of value you specified.
Whereas a regular stop loss has a fixed value and can be manually readjusted, the trailing stop automatically shadows the price movement, following the stock's rising price action. Over a period of time, the trailing stop will self-adjust, moving from minimizing losses to protecting profits as the price reaches new highs.
The trailing stop offers a clear advantage in that it is more flexible than a fixed stop loss. It allows the trader to continue protecting capital if the price drops, but as soon as the price increases, the trailing feature kicks in, allowing for an eventual protection of profit while still reducing the risk to capital.
To better understand a trailing stop, let's consider an example. If you have a $10 stock, you could set the trailing value as a fixed percentage of 5% or a fixed spread of, say, 20 cents. Either way, the trailing stop will follow the day's high by the predefined amount.
The important thing to remember is that if the last price drops below the trailing-stop value, the stop loss will be triggered. So, setting a stop too close may cause you to get stopped out more quickly than you hoped.
Another important thing to note is that stocks often move up a point or two or move down a point or two during the day, but at the close of the trading day moves back to a neutral position where it started the day.
If you placed a trailing stop too close you end the day with your position closed and the stock didn't go anywhere and therefore you accomplished nothing. So be judious about where you place your stop.
One of the greatest features of a trailing stop is that it allows you to specify the amount you are willing to lose without limiting the amount of profit you will take. In addition, trailing stops can be used with stocks, options and futures exchanges that support a traditional stop-loss order. Refer to the screen interface shown above for reference.
Note that some brokerage services screen interface, they place the trailing stop inside the advanced orders category area. So look around in your screen interface to locate it. For example, for this particular brokerage's screen interface it looks something like this:
Notice that when you click on the drop-down menu in the Adavanced Orders it shows the advanced orders options, including the trailing stop loss.
Examples of a Trailing Stop
Consider a stock with a:
Purchase price = $10
Last price at time of setting trailing stop = $10.05
Trailing amount = 20 cents
Immediate effective stop-loss value = $9.85
If the market price climbs to $10.97, your trailing-stop value will rise to $10.77. If the last price now drops to $10.90, your stop value will remain intact at $10.77. If the price continues to drop, this time to $10.76, it will penetrate your stop level, immediately triggering a market order. Your order would be submitted based on a last price of $10.76.
Assuming that the bid price was $10.75 at the time, the position would be closed [sold] at this point and price. The net gain would be 75 cents per share less commissions.
During a temporary price dip, it's important that you don't don't reset your trailing stop. If you do, your effective stop loss may end up lower than what you had bargained for. By the same token, reining in a trailing stop loss is advisable when you see momentum peaking in the charts, especially when the stock is hitting a new high.
Take another look at the example above. When the last price hits $10.80, a trader can tighten the trailing stop from 20 cents to 11 cents. This allows for some flexibility in the stock's price movement while ensuring that the stop is triggered before a substantial pullback can occur.
A good active trader always maintains the option to close a position at any time by submitting a sell order at market. Just be sure to cancel any trailing stops you have set, or you could find yourself in a short trade. (Trailing stops work equally well on short positions, but you want to make sure you don't get into a short position by accident!)
The Best of Both Worlds
One of the best ways to maximize the benefits of a trailing stop and a traditional stop loss is to combine them. When you do, it is important to note that initially the trailing stop should be deeper than your regular stop loss. It's also important to always calculate your maximum risk tolerance and then set the main stop loss accordingly.
For example, you could set a stop loss set at 2% below the current stock price and the trailing stop at 2.5% below the current stock price. As the stock price increases, the trailing stop will surpass the fixed stop loss, making it redundant or obsolete. Any further price increases will mean further minimizing potential losses with each upward price tick.
In other words, initially, the stock was given some flexibility with the staggered values, so it could establish a level of support. By doing this, you can trail a stock's price movements without getting stopped out early in the game, and allow for some price fluctuation as the stock finds support and momentum. Be sure to cancel your original stop loss when the trailing stop surpasses it.
The added protection here is that the trailing stop will only move up. During market hours, the trailing feature will consistently recalculate the stop's trigger point. Basically, if the price doesn't change, then neither will the value of the stop.
There you have it! Never establish a position without implementing either a Trailing-Stop or a Stop-Loss or both the Trailing-Stop/Stop-Loss as a Combo. It's a very smart way to invest for short term or long term.
Can you set a stop loss on options?
A quick answer is 'Yes!'As with all stock orders which allow you to set stop loss and trailing stop loss orders, options orders also allow you to set stop loss and trailing stop loss orders.
There are two ways that you can go about setting stops on your Options trades and both methods work well whether you are day trading or swing trading. One way is to set it as a percentage (%) stop loss of the price of the options and another is to set it using the actual price of the stock. Make note: one using option price and another using stock price.
Method 1: Using Options Price in Percentage (%) Stop Loss
This is basically when you take an option trade and set a stop loss on the contract price itself (usually called premium) based on your risk appetite ( a level of risk that you can comfortably take) without giving too much consideration to the movement of the underlying stock. The premium is the option price -- the same thing -- because premiums rise and fall based on the stock price, but at different rate of change called the delta. So you would use this price to set your stop loss on your options trades.
Let's say you bought the TSLA AUG $350 (strike) Call @ $9.00 (premium) and decided that you cannot afford to lose more than 25% on this trade. You would then set a stop loss at $6.75 which would ensure that if the Option contract declined to $6.75, it would be automatically sold and you wouldn't lose more than $2.25 on the trade.
To set this up, you would first place the following order:
Buy To Open 1 TSLA AUG 350.00 Call @ Limit 9.00
and then once you are filled, you would go ahead and place the stop order:
Sell To Close 1 TSLA AUG 350.00 Call @ Stop 6.75, Limit 6.05.
As you can see above, you first have to open the trade using a buy to open and then you would need to do a sell to close using similar instruction outlined below.
For the screen above, once you place a check mark on "stop limit" it opens up two input boxes for you to enter 6.75 and 6.05. Here is what it would look like on this particular interface:
Other screen interface may look different and have different configuration.
Note that different brokerage services have different order screen interface with different method and location of the stop loss section and some allows you to set stop loss simultaneously at the opening of the position. For others, you would need to do a two-step: first, buy to open and then once you are filled, you would go ahead and place the stop order.
For example, at TradeKing (now Ally Financial) you would need to do a two-step: after you completed the first step, you would go to your account space that lists your stocks and options holdings, and each holding contains your outstanding position on your stock or option and at the right column it contains a right arrow "=>" for that particular stock or option.
You click on that arrow to popup a menu that allows you to do many other things, and one of them is to trade or close out that particular stock or option.
To set a stop loss means that you are setting the price to close out your position to be triggered in the future. That's what that popup order menu pane is for -- for you to close out your position to be triggered when your price is met.
If you want to place a stop loss on that option (or stock for that matter), you would click the item "trade" on the popup menu pane and it will open a trade pane for you to trade that option while allowing you to place a stop loss on that trade.
Again, different brokerage service have different order screen interface and you may have to look around to find where they place the stop loss or trailing stop loss at. You can always ask the brokerage service representative for help if you need help placing stop loss on your stocks or options.
If you look closely at the bottom of the screen interface above you'll see a section called Advanced Orders which contains, well, advanced orders such as trailing stop loss and many other types of advanced orders. So look around in your particular screen interface to find trailing stop and many other advanced orders.
One important note: When you set your stop loss make sure to select the duration for either a Day Order in which your stop loss is active until the end of the trading day on the day you set your stop loss; or a GTC (good til cancel) in which your stop loss is active until you actually cancel it physically by hand.
A Few Words About "Stop Orders" vs "Limit Orders" vs "Stop Limit Orders"
These orders are very confusing if you're not using it on a regular basis. It will take some practice to get you full speed. For more, please refer to these tutorials: Stop-Limit Order for Stocks. Stop-Limit Order for Options. Stop Orders
A "Stop Order" tells the market maker that you want to sell your contract at $6.75 once that price is reached. Period. Notice that stop order contains only one price: $6.75.
The important thing to note is that, with a "stop order", once the set price is reached, the order becomes executable and can be filled at whatever the current market price is, which can give you a very bad fill in a fast moving market.
For instance, let's say the TSLA stock price is moving around wildly, and the Option Contracts are moving just as fast in response to high volume and volatility, and you place a stop order to get out of the AUG $350.00 Calls at $6.75.
What is likely to happen here is that as soon as the price gets to $6.75 your order becomes executable. However, if there are many orders at that price lined up before your own, there is a strong chance ( given that the market is moving fast) that your order will not be filled immediately. So a few seconds pass and you finally get filled at 5.10 because that is the current market price.
You have just lost an additional $1.65 on the contract. So, please note that even though your order becomes executable once the price is reached, it doesn't mean that it will be filled right away. It rarely ever will be.
With a stop order you are effectively telling the market maker "I want to sell this contract once the price reaches $6.75, even if I don't get filled immediately at that price, I just want to get out of the trade once $6.75 is hit". A stop order does not guarantee the best possible fill.
Limit Orders
If you look at the example order (method 1) above, I used "limit orders" on the trade entry for $9.00 to tell the market maker that I want to buy the option at a set price of up to $9 and no more. It can be executed at any price below $9 but not above it.
Limit Orders on closing out your position is the same as opening position as you'd just seen, but the price can be executed all the way down to the limit price whereas in opening position price can be executed all the way up to the limit [self-explanatory]. So Limit Orders basically tell the market maker that you want to sell your contract if/when it gets to $6.75.
Stop Limit Orders
If you look at the example order (method 1) above, I used "stop limit orders" on the exit (sell to close) which takes two prices: $6.75 and $6.05.
A stop Limit order is obviously a combination of both the limit and the stop order. With a stop limit order you are telling the market maker that "I want to sell this contract at $6.05, and no lower, once the $6.75 level is hit. But do not sell unless I can get $6.05" or better.
Remember that, as noted in the stop orders above, even though your order becomes executable once the price is reached, it doesn't mean that it will be filled right away. It rarely ever will be. So your closing order could be much, much, much lower than you wanted.
To prevent that from happening, you use stop limit orders to limit your closing price that you want to sell. If the $6.75 is hit, the market maker will make an attemp to close out your position in a timely manner, but if by the time the market maker gets to your order que and the price falls below the stop price of $6.05, the market maker won't go ahead and execute your order because you told them not to do so by placing a stop limit order.
Sometimes you don't want to sell your holding if the price is too low to make sense in closing out your position and stop limit order allows you to accomplish that.
Trailing Stop Loss Orders on Options
So far we've only talked about the regular stop loss orders on options, the trailing stop loss on options is a lot simplier than regular stop loss, especially on existing holdings--holdings that don't have stop loss/trailing stop loss on them.
Here is a summary of trailing stop loss on options on existing holdings in visual screen interface view to help you understand better:
As you can see from this particular brokerage's screen interface, they placed the trailing stop order item in the advanced orders section. Your brokerage screen interface may place it somewhere else, so look around. Once you click on the trailing stop options in the drop-down menu, it opens up a screen that looks like the following:
As you can see from the screen above, at the top there are five headings: Symbol, Action, Contracts, Price, Duration. Most of them are self-explanatory, but under symbol, it shows an option contract for a Facebook Call option at $170 strike expires on June 19, 2020. This screen propagated from the previous screen and the previous screen resulted from the other previous instruction where you navigate to your options holding and click on a popup menu and click on "trade" to place a stop-loss on your options. So you don't have to enter anything on this section.
As a matter of fact, you don't even have to enter any of the items on the five headings. The only items that you need to enter are items on "Trailing Stop Criteria" section below it. Again, most of them are self-explanatory.
Point increment or price increment is the value of the trailing margin or gap you want the trailing number to trail the actual option price. If you set it to 5 (using price/points instead of percentage) it will trail the actual option price 5 points below the actual option price using bid price. If you set to 2% (using percentage instead of point) it will trail the actual option price by 2% using bid price. You can also use ask price by selecting the ask price from the drop-down list but most traders use bid price.
One important note: When you set your stop loss make sure to select the duration for either a Day Order in which your stop loss is active until the end of the trading day on the day you set your stop loss; or a GTC (good til cancel) in which your stop loss is active until you actually cancel it physically by hand.
The above screen shows the detail from the previous action from the previous screen entry.

The above screen shows the outstanding order status that you have placed.
In this screen, I want to point out one key point that I mentioned in an earlier example when I said '...you would go to your account space that lists your stocks and options holdings, and each holding contains your outstanding position on your stock or option and at the right column it contains a right arrow "=>" for that particular stock or option.
You click on that arrow to popup a menu that allows you to do many other things, and one of them is to trade or close out that particular stock or option....'
If you look closely at the far right end of the screen you'll see some sort of marking inside the circle. That circle is the one the arrow was pointing to when you navigate to your account holding space. So click on that circle to popup a trading menu. Follow the menu after that.
Method 2: Setting A Stop Order based on the underlying stock and the Option Greeks
This method is mostly often used by swing traders (particularly, experienced swing daytraders). For beginners in options, be advised to use the first method above. Note that this step uses the stock price to set the stop loss on your options positions instead of using option prices as in method 1.
This method comprises of a few steps but it is really very simple and can be very effective if executed properly. Let's take the same stock (TSLA) and Option contract ( AUG 80.00 Call) as an example and apply the following steps.
You want to take a look at the stock and see where it is trading relative to its nearest support level. In this case, TSLA closed the last session at 327.78 and the next level of significant support is at 315.25 and the next significant level below that is at 303.10.
Since we are swing trading, we have to assume ( and make room for) the possibility of a test of support. By setting our stops based on these support levels, we are ensuring that we will be out of the trade in the event that support is broken and the stock enters a downtrend.
How To Set A Stop For Options Trades
- Since we now know that the next level of significant support is about $12.53 [$327.78 -- $315.25] from the current price we can go ahead and calculate an appropriate stop loss by using the Option Greeks.
NOTE: For those who do not know, the Greeks are nothing more than a couple of metrics/numbers that are used to price and gauge the risk profile an option. Don't be intimidated by them. For our purposes, we are primarily concerned with the Delta. The Delta is basically the rate at which an Option will change based on the change in the stock price and it is usually stated as a percentage.
For instance, if a call option has a .50 Delta it basically means that for every 1.00 move in the price of the stock, the option will rise by .50 (theoretically). This tutorial/guide is not for beginners so I am assuming you already know the basics. If not, you might want to check out a book called Trading Options Greeks which is by far the best book on Options trading.
For most brokerage services interface, you should be able to find this Greek easily by looking around in the options chain. Here is what it looks like for this particular screen interface.
As you can see, under the Delta heading on the left side for call options starting at the top listing and run down the list for all the options. If you look at the top call option and run across to the right to the put option you'll see the delta number 0.671 (or 0.67 for our calculation purpose) for the call option and -0.331 (or 0.33) the delta number for the put option. Notice that the put option delta is negative -- all put options deltas will always be negative numbers since the deltas are going down.
- Now a quick look at the contract profile for the TSLA AUG 350.00 calls reveals that the Delta is currently .35. So this means, in theory, that for every 1.00 move in TSLA, the contract should move by .35 cents. At this point, I have to remind you that time decay will also have an impact on how the option contract responds to movement in the stock price. So be mindful of that. But for this exercise, we will assume that only the Delta is important.
- Now that we know that the Delta is .35 and we know that the next support level is at $315.25 we can do some calculations and get closer to an appropriate stop loss level for our trade. So, since we have decided that we want to get out of the trade on a break below the $315.25 level, we are basically saying we are willing to give up/risk $12.53 [$327.78 - $315.25] (or 3.81%) per share on the trade. With a delta of .35 that would be $4.38 [$12.53 * 0.35] on the AUG 350.00 Contract which is now trading at $9.00. Therefore, the stop loss will be set at $4.62 [$9 - $4.38] initially.
Notice that we use the margin (or difference) bewteen the resistance/support levels and the actual stock price to further calculate the actual stop loss value.
A summary of the steps for method 2
Step 1: Find out where the significant support level is on the underlying stock you are trading and select an Option contract. The support level on TSLA was 315.25 and we decided we were trading the AUG 350.00 Calls which cost 9.00.
Step 2: Find out what is the Delta for the option contract you are trading. In our example, the Delta was .35.
Step 3: Subtract the price at the support level from the current stock price. eg. 327.78 - 315.25 = 12.53.
Step 4: Multiply the Delta by the result (amount of points/dollars) that you got from the subtraction in step 3. eg. 12.53 x .35 = 4.38.
Step 5: Subtract the result in step 4 above from the current option contract price. eg. 9.00 - 4.38 = 4.62.
Step 6: The result of the Subtraction in Step 5 above is where your stop loss on the Option Contract should be set. Finished.
How to Set a Stop Loss on Put Options
So far we've just talked about a call option, but what about the put options, how do we set stops on put options?
We follow the same steps as calls but only modify two steps: step 1 and step 2.
Step 1: Find out where the significant resistance level is on the underlying stock you are trading and select an Option contract. Remember that we're betting the option is going down, so if the option is going up against us we set the stop to get out. So we need to find the significant resistance level and assuming it is at 345 on TSLA Put at a cost of 12.00 (premium), we subtract the current price of 327.78 from the resistance level of 345, which is 17.22.
Step 2: Find out what is the Delta for the put option contract you are trading. The Delta for put options is negative.
So step 4 result should turn out to be a negative number.
And step 5 should have two negative signs: 12 - (negative step 4).
High school basic math tells us that we need to add them up and change the result as a positive number.
Next (step 6), use this positive sum as your stop loss. Your stop loss should be higher than the option premium because we want to protect our catastrophic loss if the put option heads toward the resistance and breaks through the resistance level to the upside. Done!
By using the movement of the underlying stock and the Delta value of the option contract, you are putting your self in a better position to manage the trade as opposed to just setting a random % risk level on the Option Contract by itself (as in Method 1).
This second method is not for everyone and it works best for larger accounts and real swing trading (1 week minimum holding period) and it works best in strong trending markets. Let me repeat: this method will work much better if you are buying calls in a strong upward trend or puts in a strong downward trend.
Trailing Stop Loss Orders on Options
So far we've only talked about the regular stop loss orders on options for method 2, the trailing stop loss on options for method 2 is a lot simplier than regular stop loss you had to go through in method 2. In trailing stop loss, you don't have to worry about the delta and other messy calculations; you only have to come up with the trailing margin value, say, $5, in points to trail the option price movement and that is it! It will automatically trails the actual option price (premium) movement. Very simple!
What is a Relative Strength Index?
A Relative Strength Index or RSI is a momentum indicator that measures the magnitude of recent price changes to analyze overbought or oversold conditions. It is primarily used to attempt to identify overbought or oversold conditions in the trading of an asset.The relative strength index (RSI) is calculated using the following formula:
RSI = 100 - 100 / (1 + RS)
To solve the equation using the above formula, we need to simplify the formula first because the two terms have different denominator. We need to find a common denominator and then we can solve the equation by plugging in the necessary value.
To simplify the above formula, we need to find the common denominator and then work out the math as usual, and that is all that we need to do. For example, the simplied formula process would looks something like this:
Finding the common denominator by multiplying the left side by (1 + RS)/(1 + RS):
RSI = [100 * ((1 + RS) / (1 + RS))] - [100 / (1 + RS)]
Multiplying the nominator [100 * (1 + RS)] out and the result becomes:
RSI = [(100 + 100RS) / (1 + RS)] - [100 / (1 + RS)]
Now we have a common denominator of (1 + RS) and the result becomes:
RSI = (100 + 100RS - 100) / (1 + RS)
Now we can go ahead and work out the math for the nominator as usual [100 - 100 = 0] and the result becomes:
RSI = 100RS / (1 + RS)
That is the final simplified formula.
As you can see, to calculate the RSI using the above formula -- specifically, the simplied formula -- we first need to calculate the Relative Strength or RS. Once we have the RS we can easily calculate the RSI.
To calculate the RS, we need to calculate the average gain of an underlining during a specified timeframe and also we need to calculate the average loss of an underlining during that same specified timeframe.
In other words, we need to calculate the average closing prices of a stock (or other underlining) that were up during the specified timeframe and also we need to calculate the average closing prices that were down during that same specified timeframe.
So we find the average closing price of an underlining that went up during a certain timeframe and also we find the average closing price of an underlining that went down during that same timeframe.
For example, if the timeframe is for 30 trading days and 20 of those trading days were up and 10 of those 30 trading days were down, we can calculate the average gain of up periods during that 30 trading days timeframe as:
Add all the 20 closing prices that went up and divide them by 20. Now we got the average gain.
And also we can calculate the average loss of down closing prices during that 30 trading days timeframe as:
Add all the 10 closing prices that went down and divide them by 10. Now we got the average loss.
Once you have the average gain and the average loss, you can find the RS by dividing the average gain by average loss. Here is the RS formula:
RS = Average gain of up periods during the specified timeframe / Average loss of down periods during the specified timeframe.
Once you have the RS, you can plug that RS value in the RSI formula shown earlier.
The RSI provides a relative evaluation of the strength of a security's recent price performance, thus making it a momentum indicator. RSI values range from 0 to 100. The default timeframe for comparing up periods to down periods is 14, as in 14 trading days.
Traditional interpretation and usage of the RSI is that RSI values of 70 or above indicate that a security is becoming overbought or overvalued; and therefore, may be primed for a trend reversal or corrective pullback in price. An RSI reading of 30 or below is commonly interpreted as indicating an oversold or undervalued condition that may signal a trend change or corrective price reversal to the upside.
RSI is a very powerful indicator to use to indicate a trading pattern. As you might know, stocks rarely go up or down in a straight line; meaning, stocks move up to the resistance level and fall back to the support level and then move up back again to the resistance level and then back down again to the support level, repeating and bouncing like a ball in a container. Most of the stocks behave in this pattern for awhile before breaking out to either extremes [higher than resistance level or lower than the support level].
Once the stocks break out pass these resistance/support levels, the RSI becomes your powerful tool to use to indicate overbought/oversold territories.
What is a foreign reserve?
A foreign reserve is the foreign currency that a country has in its possession or in its bank vault. For example, China has trillions of U.S. dollars stored in its bank vault. Actually, most of the trillions of U.S. dollars China has on its book are in the form of U.S. Treasury Securities (which it can be turned into U.S. dollars at any time).
That is China's foreign reserve. It's a foreign money it has in its possession or in its bank vault.
Many other countries also hold currencies of other countries as well, particularly the U.S. dollars, as their foreign reserve.
So a foreign reserve is a foreign money a particular country has in its possession or in its bank vault.
Remember that a country typically has its own currency, e.g., the United States has the dollar as its own currency, Great Britain has its own currency called the Pound, China has its own currency called the Yuan, Japan has its own currency called the Yen, the 12 European countries: France, Germany, Italy, etc., have their own currency called the Euro dollar.
For the most part, each currency can be used inside its own country only; for example, the Chinese Yuan can be used only inside China, and likewise, the European Euro dollar can be used only inside the 12 European countries and nowhere else.
When people travel to a foreign country, they have to exchange their own country's currency with of that foreign country's currency.
For example, if you go to China or any other country for that matter, once you arrived at the country's airport you need to exchange your U.S. dollar with that country's currency so that you can use it to buy things while you're in that country. Another example, when you go to France (or any one of the 12 European countries that carry the Euro dollar), you need to exchange your U.S. dollar with the Euro dollar so that you can use it to buy things in those countries.
Likewise, when businesses invest or trade with a foreign country, they have to exchange their own country's currency with of that foreign country's currency.
For example, when Walmart Corporation and other U.S. companies buy Chinese products to sell in their stores in the U.S., they need to exchange their U.S. dollar with the Chinese Yuan so that they can use the Chinese Yuan to buy those Chinese products because the Chinese government barred the use of foreign currencies inside China.
Most countries do this as well, e.g., you can't use the Euro dollar to buy things in the United States either.
When U.S. companies buy products from Chinese companies, Chinese companies take those U.S. dollars and deposit them in their bank accounts in Chinese banks or more specifically in Chinese cenral bank, which is controlled by the Chinese govenment.
And those U.S. dollars, in turn, get converted by the Chinese central bank into Chinese Yuans, giving Chinese companies their actual Chinese currency -- and not in U.S. currency.
Well, most likely U.S. companies need to convert U.S. dollars into Chinese Yuans first and then buy Chinese products using Chinese Yuans instead.
Anyhow, the effect is still the same: China has lots and lots of U.S dollars -- trillions of it!
Japan also has lots and lots of U.S dollars -- trillions of it -- due to its longstanding trading surpluses with the United States for decades and decades.
Among of all the countries of the world, Asian countries have the world's largest holdings of U.S. dollar reserves (in the form of foreign reserve) -- a legacy of the 1997 Asian financial crisis where policymakers fretted about dollar shortages and free-falling local currencies.
In reserve holdings (as of January 1, 2022), China towers above them all with a cash pile above $3 trillion but peer countries in the region have also been formidable accumulators, predominantly in the US dollar. They include Japan ($1.4 trillion), Singapore ($426 billion), India ($604 billion), Taiwan ($550 billion), and South Korea ($457.8 billion).
Like other big economy countries, including the U.S., the Chinese goverment can print money out of thin air without fearing of inflation or de-value(ing) their currency by printing money out of thin air whenever they want.
So to convert the U.S. dollars into the Chinese Yuans, the Chinese goverment can print more Chinese Yuans and credit Chinese companies in exchange for their U.S. dollars.
In effect, China has lots and lots of U.S dollars -- trillions of it!
The United States is notorious in the business of money printing, particularly in the 1929 Great Depression, the Federal-Aid Highway Act of 1956 (which was used to build The Interstate Highway System), the 2008 Financial Crisis (commonly known as The Great Recession), and most recently, the COVID-19 Pandemic Crisis of 2020 (and the aftermath of the COVID-19 Pandemic Crisis).
From January 2020 to June 2022, the United States alone printed $7 trillion and we are not done printing money yet (as of June 2022).
So as a result, both the U.S. and China have lots of money supply floating around (particularly the U.S.), with the U.S. Federal Reserve printing money supply to buy bonds sold by U.S. companies; while China has trillions of U.S. dollars (and other country's currencies as well) on its book because of the trade surpluses with other countries, particularly the United State.
All of these events (the money printing and exchanging of currencies) create a system of foreign reserve.
This system of foreign reserve, particularly, the exchanging of currencies is called the foreign exchange market.
What is a Foreign Exchange?
A foreign exchange is a place where you can exchange your currencies for other currencies. It is like a stock exchange but instead of buy stocks, you buy other currencies using your own country's currency to buy other countries' currencies.
If you travel to other countries, you exchange your U.S. dollars using the foreign exchange market, which physically handles the exchange of the currencies.
Trades are the main source of the foreign exchange market (i.e., Walmart buying Chinese goods), causing each country's currency to fluctuate (or rise/fall in value) according to the supply and demand of the currency.
For example, the U.S. dollar is typically in high demand by traders all over the world and therefore it is more valuable than other currencies.
Keep the supply/demand principle in mind when you deal with the foreign exchange market, because it is based on the supply and demand of the currencies involved in the trade or exchange.
This trading of currencies in the foreign exchange market is where countries are so worried/abcessed with the concept of foreign reserve--they have to!. Their economy depends on it!
Why countries are so worried/abcessed with the concept of the Foreign Reserve?
The answer to that question may surprise you and may even put you on edge if you're from a country that has low foreign reserve.
Two examples that come to mind is in 1992 when George Soros broke the Bank of England and another occurred in 1997 during the Asian financial crisis, particularly in Thailand after the Thai baht plunged in value.
Now we're on to the description of the foreign reserve concept in depth.
I'm little lazy, so I'm going to refer you to some excellent tutorials on the Web, which can explain better than I can.
As you watch the following videos, keep the trading of currencies in the foreign exchange market in mind because it is all about trading of currencies.
Also, don't forget to keep the supply/demand principle in mind as well.
To understand the concept of foreign reserve in depth, you have to at least finished watching the third video in the list below. The first two videos are just introductions to warm you up for the concept of the foreign reserve. Here are the video tutorials:
Ex-Dividend Date
When a company declares a dividend, it sets a record date when an investor must be on the company's books as a shareholder in order to receive the dividend. Once the company sets the record date, the stock exchanges or the National Association of Securities Dealers, Inc. set or fix the date set by the company and called it as "ex-dividend date." The ex-dividend date is normally set for stocks two business days before the record date.So there are two dates to be considered here:
- Record date: the deadline date the company sets on its books for investors to be on to qualify for the dividend.
- Ex-dividend date: the date the stock exchanges or the National Association of Securities Dealers, Inc. set to two days prior to the record date set by the company. So the "ex-" (in theory) stands for extra -- as in extra or in addition to the company's date.
Well, because the stock exchanges and/or the National Association of Securities Dealers, Inc. cannot clear their books in time to meet the deadline set by the company, so the the stock exchanges and/or the National Association of Securities Dealers, Inc. set a new date to give them the time needed to settle trading transactions and clear their books.
So you have to pay close attention to two dates if you want to qualify for dividend. The most important date is the date set by the stock exchanges, although the date set by the company also somewhat important; however, pay close attention to the date set by the stock exchanges since it back-stepped the date set by the company by two days.
You get the dividend if you purchased a stock before the ex-dividend date -- the date set by the stock exchanges. If you purchased the stock on its ex-dividend date or after, you will not receive the next dividend payment. Instead, it is the seller who gets the dividend. So it is very important that you pay close attention to the date set by the stock exchanges.
What is a SPAC?
A SPAC (Special Purpose Acquisition Company), also known as a "blank-check" company, is a publicly listed company with no operations that raises money from investors via an IPO for acquisitions.
SPACs raise funds in an IPO to acquire a private company, which then becomes public as a result of the merger.
In other words, SPAC firms raise capital through an initial public offering with the intention of using the cash to acquire a firm and take the merged entity public.
A SPAC has no commercial operations, but exists solely to raise money by listing on the stock exchange, with the hope of finding and buying a profitable and fast-growing company to acquire. After the SPAC lists, it has a set time period in which to buy a target private company.
Typically, when you start a company you have some sort of products or services to offer to your consumers or clients. The normal process is that you would file a registration to begin the start of your company to begin the process of the "on going" business activities.
Once you're approved of the application, then you can begin the process of the "on going" business activities, such as building/creating products or services.
Most companies start out at its inception as a private company and later after the company has gained a foothold in the business world or be well-known and well-established in the business world as a well-respected company then it might want to go public in the form of an IPO.
In a SPAC, you file the registration to go public [the same way a well-established company does] as if you had gained a foothold or be well-known and well-established company already, and having some products or services to offer to your customers or clients. But in fact, you don't! No products or services! None! Just a blank-check company applying to list on the exchange for the public to own some shares.
Since the prospect or promise of buying a very good and profitable company to merge with [this blank-check company] is so enticing, many big pockets investors pore their abundance of money on the blank-check company hoping to get rich quick. And a lot of them have gotten rich, very rich, in fact!
Never mind that, you have a newly registered publicly traded (IPO) company that contains/has nothing - and never mind that this "blank-check" company only words of assurance is the promise of looking to acquire a good and profitable private company to merge with. Never mind all that -- big and small investors alike jump at the chance of making quick bucks.
Once it is registered as a SPAC and listed on the exchange as a publicly traded IPO company, you can go out and raise funds from investors and then use those funds to acquire a private company, and merging the acquired company with the blank-check company to form the combine (two) companies as one publicly traded company.
In the two years (of 2019 and 2020) we have seen market favorites including Virgin Galactic, DraftKings, and Nikola go public through such deals.
Blank-check IPOs exploded in 2020 as firms looked to take advantage of a surge in participation from retail investors and hopes for an economic recovery. More than $74 billion has been raised across 218 SPAC debuts in 2020, according to data from SPACInsider.com. That compares to just $13.6 billion raised across 59 deals in 2019.
Why the need for a SPAC?
To answer that question, let's go a little deeper into the detail of SPAC.
Here is an article that appeared on March 30, 2021 by POLITICO. We'll come back to my SPAC details after the article.
The shell companies (or holding companies or companies containing nothing -- or SPACs) that many private firms use to go public on the country's stock exchanges have been all the rage on Wall Street for more than a year (specifically 2019 and 2020). Now, just as their explosive growth shows signs of waning, they are coming under scrutiny from lawmakers and regulators.
Special purpose acquisition companies, or SPACs, which have no business operations and whose only purpose is to acquire a private company to then list on an exchange, have become so popular that they have outstripped traditional initial public offerings. The attraction of these so-called blank check companies, which have been backed by everyone from Shaquille O'Neal and A-Rod to Serena Williams? They get to bypass the costly IPO process, where companies must undergo vetting by the Securities and Exchange Commission before they can sell stock.
Now, lawmakers and consumer advocates are increasingly raising alarms about the risks facing unwitting investors, particularly retail buyers who might not be able to spot a bad deal on their own. And the SEC, which has been pressed by investor advocates for months to take steps to protect investors, is moving in.
"You shouldn't be able to use a SPAC to evade the disclosures and liabilities inherent upon taking a company public," said Rep. Brad Sherman (D-Calif.), chair of the House Financial Services subcommittee that oversees capital markets and investor protection.
Sherman said he thinks "a chunk" of companies are using the process to do just that, a concern shared by other Democrats on the committee, including Rep. Bill Foster of Illinois.
The SEC is looking into potentially illegal activity related to SPACs, according to people with knowledge of the inquiry. The probe was earlier reported by Reuters, which cited letters from the SEC to banks and other underwriters asking about their SPACs activity related to these offerings.
A banker familiar with the situation confirmed to POLITICO (the author of this article) that the SEC had sent a letter to the bank. Another banker said their company was aware that letters were going out on SPACs and that a probe is taking place.
The SEC declined to comment. But the agency this month issued a statement calling on investors to ignore celebrity endorsements of these vehicles. That came after earlier warnings from the regulator, including an investor bulletin in December -- "What you need to know about SPACs."
But just as policymakers and the SEC move to investigate, the performance of these companies appears to be faltering, according to data tracking their performance on the New York Stock Exchange and Nasdaq.
Data on SPAC performance 30 days out from a deal to take a private company public show the companies are performing worse on average in 2021 compared to 2020. While investors continue to show keen interest in buying stock in these SPAC shells before a deal, the declining performance suggests that finding a good deal to take a private firm public could be getting more difficult.
That could be a problem given all the new companies that are out there looking for deals.
Less than three months into 2021, SPAC IPO activity has already surpassed all of 2020, the year that the investment vehicles took up roughly half the market for new public company listings, in terms of deals and dollars raised. By comparison, the previous peak was 14 percent of the market in 2007, according to research firm SPAC Analytics.
Behind the surge is the prospect of a good deal for those who get in early, usually large, institutional investors. SPACs generally list on public markets with the proviso that they must acquire a private company in two or three years with the help of a sponsor who collects fees for a successful deal. That's when it tends to draw lots of small investors. If the SPAC fails to bring a private company public, it must return the money to investors, making the potentially lucrative investment appear relatively low risk.
But advocates fear many of these newly established companies will be under pressure to strike a bad deal instead of none at all, so early investors get a big return, sponsors get their fees and then retail investors take the loss when share prices plummet.
"Now all of a sudden, you own a garbage company," said Andrew Park, senior policy analyst at Americans for Financial Reform, a progressive investor advocacy group that has been warning policymakers for months about the dangers of SPACs.
Combined with growing animosity - particularly from private equity - toward the rigors of the traditional public offering process, interest in the companies soared along with the rising stock market. That has fed concern that there's a bubble ready to pop in SPACs.
"One of the clear dangers here is that there are going to be too many SPACs, chasing too few merger targets, that we're going to see some truly bad deals struck," said Foster, the Illinois Democrat. "This boom will just cause them to scrape the mud off the bottom of the of the pool."
Companies consult with the SEC when putting together the proxy and registration statements to take the private company public, and the agency can comment on their drafts. If there are enough shareholder votes to approve the acquisition, a financial disclosure to the SEC is then required of the combined entity. But during the initial listing process, a SPAC has little to offer except the promise of big future plans. That's a major reason why it has been so easy for them to crop up on public exchanges.
From January to mid-March (2021), there were 264 SPAC offerings on the Nasdaq and the NYSE raising $76.8 billion, according to a POLITICO analysis of listing data for the nation's two largest exchanges. That eclipsed traditional IPOs, which had just 74 deals and raised $30.1 billion over the same time period.
"The SEC's been warning investors now for months about the risks of SPACs, but that hasn't made a dent," said Tyler Gellasch, executive director of investor advocacy group Healthy Markets Association. "I expect the SEC and Congress are going to try to pop the speculative bubble soon, and a quick way to do that would be to restore some basic liability on those involved in the deals."
Proponents of SPACs say the transactions offer retail investors the chance to see bigger returns that might otherwise be reserved for the private market. They also view the boom in public offerings as positive for the market, regardless of whether companies fail, because it means more businesses are going public and providing financial disclosure to the SEC.
Those supporters include U.S. climate envoy John Kerry, who earlier in March said the investment vehicles are valuable because they could help finance green energy companies - a remark that drew a sharp rebuke from AFR.
"They provide spectacular windfalls for insiders while performing very poorly for most investors. They're not the solution to the climate crisis," AFR said in a tweet directed at Kerry.
Republican SEC Commissioner Hester Peirce has warned against regulating the new offerings too quickly. Doing so could reduce the cost-effectiveness of SPACs, she said this month during a meeting of the SEC's Investor Advisory Committee.
"Let's certainly look at what's going on, and try to get our arms around what's going on. The 'why now' questions I think are good questions to ask," Peirce said in an interview. But "we need to appreciate the potential for SPACs."
AFR and the Consumer Federation of America want policy changes that would require more disclosure and ensure legal protections for investors. The groups also say the SEC should conduct more research into what kinds of investors bear the most losses when these companies fail.
Carson Block runs a hedge fund that has bet against companies going public through SPACs, citing research on flimsy company fundamentals. But his warnings have been met with resentment from retail investors.
"This is clearly a situation in which unsophisticated retail is being preyed upon," Block said. "It's because there's euphoria, it's because the markets are being artificially stimulated, and I have seen this movie before, most closely in the late '90s to 2000s Internet bubble. The cure for it is to learn hard lessons."
John Jenkins, a veteran corporate lawyer, said regardless of what regulators do, the boom reflected a fundamental problem in the market.
"You can hammer on the disclosure side, you can hammer on making sure that the conflicts of interest are out there and laid out, but these things are prospering because there's kind of something wrong with the IPO process in general," he said.
But Sherman said the demand is a sign that regulators need to focus on the issue more.
Many companies "don't like the process of going public," the California lawmaker said. "If we can protect investors and make it easier to go public, that's what we should do. But, on the other hand, you don't need a backdoor that evades all of our efforts to protect investors."
[END OF POLITICO ARTICLE]
NOW ONTO MY SPAC IN-DEPTH DETAILS
The SPACs are Stacking the Deck
Remember when you played card games with your brother, or sister, or cousin? Or maybe your son or daughter?
At some point they would have to use the bathroom, or get a drink of water, and bam! When no one was looking, you had your chance to stack the deck for the next round.
That's 4 aces or a royal flush in five card hold'em. Of course I could never keep a straight face afterward.
Several new SPACs have stacked the deck for their "founders" and warrant holders. And they're not joking around and always keeping a straight face before, during, and afterward while at the same time laughing all the way to the bank.
SPAC Structure: Do as I Do
SPACs (or Special Purpose Acquisition Companies) (also known as Blank Check Companies) organize as if they were part of the fashion industry.
Nowaday (particularly 2021), you couldn't read a business article without coming across SPAC mania. SPACs have been all the rage on Wall Street for more than a year now (specifically 2019, 2020, and into 2021).
Someone comes up with the latest hot color to wear, or style of shoe, and then you see it everywhere.
SPACS are no different. Some underwriter, or attorney, will come up with a tweek to make the structure different.
"We're going to do one-half warrant per unit, in order to minimize dilution," etc., etc., etc.
Then every SPAC after that does one-half warrant per unit - and everybody jumps on the "copycat" bandwagon and everything is catching on like wildfire. As long as the rules are followed for the overall structure, nobody really cares.
The offering to sell SPAC units to the public is typically advertised in a press release that looks like the following:
NEW YORK, Aug. 24, 2020 /PRNewswire/ -- Far Point Acquisition Corporation (NYSE: FPAC.UN) a special purpose
acquisition company, announced today that it is offering 23,000,000 units (including 3,000,000 units granted
to underwriters' over-allotment option in full) at $10.00 per unit, resulting in gross proceeds of $230,000,000.
The units will begin trading on the New York Stock Exchange Capital Market ("NYSE") under the symbol
"FPAC.UN" on November 13, 2019.
Each unit consists of one share of Class A common stock and one-third of one warrant.
Each whole warrant is exercisable to purchase one share of Class A common stock at a price of $11.50 per share.
Only whole warrants are exercisable. Once the securities comprising the units begin separate trading,
the Class A common stock and warrants are expected to be listed on the NYSE under the symbols "FPAC" and "FPAC.WS,"
respectively.


What the Newswire press release is saying is that this SPAC is announcing to the general public
that it is selling "Units" of the SPAC to anyone interested in buying the Units.
Each unit consists of one share of Class A common stock and one-third of one warrant -- meaning,
you buy one Unit at a price of $11.50, you get one share of Class A common stock and
one-third of one warrant.
So you have to buy at least three Units to make your warrant worth one whole warrant,
which can be exchange for one share of Class A common stock.
Just to be clear, I'm speaking from a trading perspective. I have not done an exhaustive study of SPAC structures and how they benefit shareholders / investors, etc.
Bottom line, once a fashion is established in SPAC IPOs it tends to stick. But for how long will the fashion can sustain its attractiveness? According to the POLITICO article above, a bubble looms on the horizon.
The New "Founders Shares" Structure
When I think of a "founder" I think of the guy or gal who is working 18 hours a day to get a business off the ground. Basically someone who has put in some sweat equity - someone who has some ideas to make things happen.
But I'll turn it over to the experts. This is what Forbes has to say:
Founder is a label with some amount of prestige. It carries connotations of creativity and innovation, determination, native intelligence, and a sense of fearlessness. Founders create something from nothing.
And they go on to add:
Strictly speaking, in business the founders are the people who establish the company -- that is, they take on the risk and reward of creating something from nothing.
You may ask, if we're talking SPACs, a pool of money raised from investors to buy an existing business, then why the talk of founders? Founding what?
There have been countless SPACs gone public to much fanfare, and it turns out, they have added a new fashion statement: founders shares.
Founders shares
The first prospectus I saw mention founders shares (and there are already others) was for Far Point Acquisition Corporation. Even if you don't follow SPACs, you may have heard of this one.
It made some mainstream headlines because it is being led by former NYSE head, Tom Farley. According to a Bloomberg article (not included a link here), Mr. Farley did a lot to make SPACs easier to list.
Given that I hadn't seen founders shares before in a SPAC, I was intrigued. I assumed it was a new way to pay management of the SPAC a little extra money. Nothing out of the ordinary there.
And, the structure is fairly simple. Some "founders" provided money to the fund to set it up in return for stock. In this case it is class B stock, which is convertible into class A stock when the SPAC actually buys another company.
Class A stock is the common stock that the public got in the stock offering. OK, again, nothing earth shattering.
Then I started looking at the numbers. My first thought was, "holy expletive expletive Batman!"
My next thought was, "this SPAC is going to complete an acquisition, or somebody's getting kneecapped."
Why the Founders Shares Matter?
If the SPAC, for whatever reason, cannot do an acquisition (can't find the right company, the shareholders don't like the deal, etc.) then the SPAC warrants become worthless. Zero, nil, zilch, zip, nada, none.
This makes SPAC warrants somewhat like a lottery ticket. They are either worth something (a deal is announced, then approved) or they are worth nothing (no deal, SPAC dissolved).
It follows that anything that influences whether a deal is more or less likely impacts the value of the warrants.
Now let's talk numbers.
The "founders" of Far Point Acquisition Corporation (which includes Dan Loeb and his hedge fund, Third Point) put $25,000 into the fund which before that "had no assets, tangible or intangible."
No, I didn't leave off a zero on that, it's twenty-five thousand with a T. (So you don't have to come back and reread it.)
So what do you think the founders get in return for that $25,000 if an acquisition is done? How about a 10X return? That's pretty good, but come on, you're a Wall Street insider here, think bigger.
100X? Now we're talking. Show me the money! (that credit card commercial has totally messed up the Jerry Maguire reference). But no, wrong again.
OK, here I'm going to make an assumption. I'll make it quick, stick with me. The Units went public at $10 a share.
The units include one share of common (class A, or what our class B can be converted into) and one-third of a warrant. (Even half-warrants aren't fashionable this year.)
Some of the warrants were sold in a private placement (more on that below) at $1.50 per warrant.
For those of you who are not familiar with warrants: A warrant is like a stock option where you have the right to convert the warrant units into real common stock (usually class A) shares. And some of the warrants are traded publicly on the stock exchanges and some are privately sold in a private placement depending on when the warrant gains a public listing.
So if the Units went public at $10 a share and a warrant costs $1.50 per warrant at a private placement, and that warrant can be converted into class A common stock at $10 a share, you can do the math yourself as to how much money you make [with hands over fist].
So, I'm going to put the value of a share of common stock (A and B are equivalent for this purpose) at $9.50 per share ($10 minus $.50 for one-third warrant).
So, where does that get us? OH YEAH, how many shares of common stock did the "founders" get for their $25,000?
In March 2018 the founders got 11,500,000 shares of stock. Hang on, don't do the math yet.
Because in June 2018, before the SPAC came public, before it had identified or acquired a company .... basically before it had done anything, the "founders" paid themselves a stock dividend.
TWO dividends in fact. The result, the founders received 15,812,500 shares for their $25,000.
Yeah, me too. I can only guess at what was said in the discussion to do the stock dividend.
Maybe, "We just got Mr. Farley from the NYSE to sign on to lead this thing. Who's going to question ANYTHING that we do. Another scotch Jimmy, and what the hell, let's pay ourselves a stock dividend."
Whatever the discussion, at $9.50 a share, the founders are looking to make $150,218,750 (minus their $25,000 investment, I'm not even going to bother subtracting that). BTW, that's over 6,000X their original investment. Hey guys, can I be a founder next time, please, please, please, please?
BUT, remember, they only get this money if Far Point actually acquires a company. So ... my bet is they WILL acquire a company, and the Far Point warrant is going to be a winning lottery ticket.
But Wait, There's More
Far Point added a few additional incentives to make sure a deal is done.
First, the founders have agreed to vote for a deal if a target is selected. Those founders are swell guys.
Remember, if a SPAC selects a target, the SPAC must still put it to the shareholders to vote whether they want to do the deal or get their money back. The Far Point Structure, in which the founders own 20% of the SPAC, means they only need a little over 32% of the shareholders to vote favorably.
Well, at least the founders didn't evade the democracy process in approaching this thing. The founders adhered to the democracy principle by allowing majority opinion wins.
So let's do the math: 20% + 32% is 52%. That's a majority opinion and anything above 50% is a majority opinion. This is a democracy principle.
But the founders don't have a majority opinion on their 20% holding -- do they? Read on!
Second, Third Point agreed to purchase 9,766,667 warrants (presumably at no more than 25 cents per Unit -- hey, you're the buyer and seller -- buying and selling to yourself, and thus, you can set whatever price you want).
These newly purchased warrants are addition to Third Point's original stake in the founder shares, and if no deal is done all these warrants will go to zero.
Third, there is an agreement between Third Point (or Cloudbreak Aggregator, an affiliate of Third Point in the Cayman Islands) and the SPAC, that Third Point will purchase shares of the SPAC which are redeemed by public shareholders.
Remember that SPACs are funded and owned by public investors -- big or small. And if these investors don't like the deal they can sell their SPAC shares in the public market.
Basically, if enough of the public shareholders don't like the deal and want their money back, Third Point will purchase those shares and vote them for the deal. YEAH! RIGHT! The rich get richer!
Fourth, and finally, I've pointed out having a single owner of a block of SPAC shares may make a deal more likely. In other words, you look to attract enough big pocket investors so that you can convince them to vote for the deal because big pocket investors can sway the voting scale quickly as appose to small investors where you need lots and lots and lots of them to vote in favor to sway the outcome of vote.
If that owner has experience with special situations and arbitrage even better. In other words, you can do a backroom deal with that big pocket investor by promising them lucrative terms on the deal and get that investor to vote for the deal.
If we could pick one person to want to own our SPAC shares, and add more likelihood of a deal, it might be this guy, Daniel Och. Who better than a former Goldman Sachs risk arb guy. Mr. Och and his funds have purchased 15,000,000 of the Far Point units.
What it All Means?
Given all the various structures that comprise the Far Point Acquisition Corporation, this SPAC IS going to acquire a company. One of the main risks in owning SPAC warrants prior to the announcement of an acquisition is that if the SPAC does not do a deal and the warrants go to zero. That will not happen here. (This article was written in 2019)
Update on Far Point Acquisition Corporation
Here is a press release from Far Point Acquisition Corporation: August 24, 2020
NEW YORK, Aug. 24, 2020 /PRNewswire/ -- Far Point Acquisition Corporation (NYSE: FPAC, FPAC.UN, and FPAC.WS) a special purpose acquisition company ("FPAC"), announced that its stockholders voted to approve the proposed business combination transaction (the "Transaction") with Global Blue Group AG ("Global Blue") at a Special Meeting held for this purpose on August 24, 2020. Holders of 53,505,646 shares of FPAC's Common Stock, or approximately 67.68% of the issued and outstanding shares, voted in favor of the Transaction. The parties expect the closing of the Transaction to occur August 28, 2020. FPAC also announced that stockholders holding 48,708,994 shares of FPAC's Class A Common Stock have elected to redeem their shares in connection with the closing of the Transaction.
What is a bond?
A bond is a loan that companies borrow to be used to fund the company's operation. A bond is simply an IOU -- a debt security or a promisory note that promises to pay back the principal along with the periodic interest payments. Bonds are issued by corporations, governments, and some times individuals (like rock singers Sting and Rod Stewart and Mick Jagger, etc). The most typical issuers of bonds are companies and governments. Individuals who issue bonds are rare.When firms need cash to run its operations, they can either sell stock in the form of IPO or in the form of secondary offerings. But selling more stocks to the general public means that creating more supplies in the market; and therefore, diluting current shareholders' value. That might not be the best case scenario for a company.
A better alternative is to issue bonds to raise cash. If a firm needs small amount of cash, it usually issues promisory notes or mortgages backed by the firm's real estate properties or other assets. When it needs larger amounts -- usually millions of dollars -- it needs to borrow from the general public by issuing bonds.
When goverments need cash to build bridges, sewages, schools, repair roads, and provide other essential services to the general public, it needs to borrow from the general public by issuing bonds.
When companies or goverments need to raise cash, they will offer the general public a deal. It's called floating an issue. In essence, floating an issue is another way of testing the market to see if the bond is appealing to investors at an acceptable interest rate.
A common expression for testing something in the market (particularly bonds) is: "Let's see if it floats." Thus, floating an issue. In other words, let's test to see how receptive our bonds are before we issue the bonds. If the bonds have a high enough rating and high enough percentage offerings, the chance of those bonds will float is high.
So bond issuers usually advertise their float first to see if their bonds will float and then once they receive enough inquiry from prospective bonds buyers, then they decide to issue the bonds and sell to the public. If the bonds are not well-received, then they might scrap the offerings and do another test float by raising the interest rate on the bonds and/or collaterize the bonds with more assets to calm investors' nerve.
When you buy stocks, you gain equity in the company and become a part-owner. When you buy bonds, you own debt in the company and become a creditor to the company because you have loaned money to the company or government (or individual).
Investors lend money to corporations and governments to earn interest on the money that they loaned. The bond is just a piece of paper called a bond certificate that signifies that they had loaned the money to the corporation or government. In other words, investors that buy bonds become lenders and corporations and governments that sell bonds become borrowers.
As with most loans, the borrower pays interest to the lender. A bondholder usually receives regular interest payments from the issuer of the bonds. Unlike stock dividend payments, which change along with company profits levels, interest payments on a bond are usually fixed.
For example, a corporation or government may floating an issue in the open market for a bond that pays 8% annual interest over 15 years. This quarantees that the annual interest rate stays fixed for the whole life of the bond, which is 15 years.
The wording of the floating an issue over the electronic newswire looks similar (but not exactly) to this:
|
|
What that means is that XYZ Corporation is announcing to the general investing public that it plans to offer to sell a bond worths a total of $20,000,000 that pays 8% annual interest rate over the life of the bond, which is 15 years, in increment of $1,000 lot.
If the general investing public likes the deal in a floating an issue, then they would inquire about the floating of the issue and offer to buy those denominations or units. Notice that you do not need to have hunreds of thousands or millions of dollars to buy a bond: you only need to have a minimum amount of the lot, usually $1000, to buy a bond.
If enough demands for the floating an issue, then the XYZ Corporation might go ahead and issues the bond. If not enough demands for the floating an issue, then the XYZ Corporation might cancel the floating of the issue and issues another floating issue with a higher annual interest rate to entice the general investing public to accept the deal.
Corporations usually offer in denominations or units of $1,000 lot. But, governments -- especially federal government -- issue some bonds in denominations or units of $1,000, $500, $250, $100, and $50. Again, you do not need to have hunreds of thousands or millions of dollars to buy a U.S. government bond: you only need to have a minimum amount of the lot, $50 in this case, to buy a bond.
Bond Certificates
When a corporation or government needs to issue a bond, it hires an investment banker that specializes in writing and handling bond issues. An investment banker writes a bond indenture, or agreement, that shows in detail the terms of the bond -- such as annual interest rate and the life of the bond -- and the rights and duties of the borrower and other parties to the contract. [A bond indenture is an agreement or term]
Remember that a bond is just a loan and the loan needs to have terms and agreement for both the lender and the borrower to agree on and signed into a contract. You can say that a loan is a contract between two parties. Bond certificates is the contract that signifies you signed a contract with the other party.
Most bonds are issued with three essential pieces of information:
- Interest Rate is the percentage rate of Par Value that will be paid in interest to the bondholder on a regular basis. For example, this $1,000 bond would pay 12 3/8%, or $123.75 a year.
- Maturity indicates when the term of the loan expires ("is due") and the bond will be retired ("paid off" in full).
- Par Value is the amount the bondholder will be repaid when the loan is over. Usually, par value is $1,000. A Baby Bond is a bond with a par value of less than $1,000. Governments -- especially federal government -- usually issue Baby Bonds in par value (denominations or units) of $500, $250, $100, and $50.
Who Issue Bonds?
Only corporations can issue stocks, but bonds can be issued by corporations or governments or individuals.
The most typical governments that issue bonds are:
- Federal governments. The U.S. Federal government always issue bonds to pay for a wide range of federal government activities: defense spending, war costs, catastrophic events (hurricans, floods, eartquakes, etc), infrastructures, federal aid to states, and so forth.
- Federal government agencies. Bonds issued by federal government agencies are indirect obligations of the U.S. government. Some of the most well-known are the U.S. Postal Service, which borrows heavily to fund its operation; FANNIE MAE, FREDDIE MAC, GINNIE MAE, FHA, and the Tennessee Valley Authority.
- Municipal governments. States, cities, counties, and towns issue bonds to pay for a wide range of publicly beneficial projects: schools, roads, sewage systems, other infrastructures (bridges, camp/play ground), stadiums, and so forth.
- Foreign governments. Many foreign governments issue bonds specifically to U.S. investors. Just like U.S. governments, foreign governments also issue bonds to pay for a wide range of publicly beneficial projects and other essential services.
- (U.S. and Foreign) Corporations. For corporations, bonds are a primary way of raising cash to fund its operations. The money raised pays for expansion, modernization, acquisitions, and other expenses.
You may hear a bond's interest referred to as coupon. That's because some bond certificates come with detachable slips similar to car payment slips. The detachable slips contain the bond's interest payment schedule and other information pertaining to the bond. With these coupons or slips, you can actually clip a coupon and send it in the appropriate time to receive your interest payment. That was in the old days before the electronic age caught a storm. Nowaday, everything is done electronically and investors don't have to do anything, but the use of the term coupons still exists.
Bonds are backed by the full faith of the issuer. If the issuer of the bond pledges property as collateral for the loan (as in a mortgage bond), the bond indenture or term names a trustee or agent to hold the title to the property serving as collateral. The trustee acts as the representative of the bondholders and is usually a bank or trustee company.
The issuer of the bond (borrower) or trustee appoints an agent (usually a bank or trustee company) to act as registrar and disbursing agent. When it comes to making payments, the issuer of the bond deposits interest and principal payments with the disbursing agent, who distributes the funds to the bondholders.
To provide some protections to bondholders, bond indentures typically limit the bond issuer's right to declare dividends and make other distributions to company's shareholders. Well, if you're a bond buyer you don't want the bond issuer to spend money wildly that can cause the company to default on your bonds. It makes a lot of sense.
What Is a Bond Worth?
All bonds carry a fixed interest rate. But interest rate in the market usually fluctuates according to market conditions. Bond prices also do fluctuate according to market condition. For example, a corporation issues a bond that has a value (or price) called par value of $1,000 that pays 8% annual interest rate for 5 years.
During the life of the bond, which is five years, the interest rate in the market may fluctuate up or down more or less than 8% in one month, two months, three months, two quarters, three quarters, or one or more years.
All those scenarios could happens while the interest rate on that bond is staying fixed at 8% annual interest rate during the life of the bond.
Changes in interest rates, such as when the Fed raises or lowers its Fed Funds rate, effect the prices of the bonds. Issuers of the bonds often offer to pay investors (bondholders) a rate of interest which is competitive with other bond rates at the time. As a result, the rate on a new issued bond is usually similar to other interest rates: prime rate, mortgage rates, personal loan rates, etc.
After a bond is issued, however, interest rates in the economy may change -- making the rate on the (old) issued bond (which can't change) more or less favorable to investors. If the (old) issued bond is paying more interest than the generally available elsewhere, investors will be willing to pay more to own it. On the other hand, if the (old) bond is paying less interest than the generally available elsewhere, investors will not be willing to pay more to own it. They can go somewhere else to get a better deal.
Originally, bonds were not meant to be traded on the open market as a secondary market. Bonds were intended to be sold by the issuers--and not by the freewheeling investors.
As often the case, the law of economics prevails. The higher the yield on the bond the more people wanting to buy the bond from a secondary market. As the interest rate fluctuates, the bonds become favorable or non-favorable for the original bondholders, creating a secondary market for the (old) issued bonds.
In general, consequently, interest rates and bond prices fluctuate like two sides of a seesaw -- when one side move the other react in opposite. This is the law of economics at work. When interest rates drop, the value of existing bonds become favorable for investors because the rates on new issued bonds are usually similar to other interest rates: prime rate, mortgage rates, personal loan rates, etc.
If existing bonds become favorable for investors, in other words, if the existing bonds become such a high demand, investors would bid up the prices of existing bonds, making the prices of the existing bonds go higher than its par value. When interest rates rise, the reverse is also true.
Let's say, for example, that XYZ Corporation floats a new issue of bonds offering 6 3/4% interest. You--the bond buyer -- decide this is a good rate compared to what else you could invest in. So you buy some bonds at full price (par value), $1,000 per bond.
Now three years later, interest rates in general are up. If new bonds costing $1,000 are paying 8% interest, no buyer is going to pay you $1,000 for your 6 3/4% XYZ bond. To sell, you'll have to offer your bonds at a discount to induce buyers to buy your bonds that are carrying lower than the going rate.
Of course, you can hold your bonds to maturity and keep receiving a 6 3/4% interest throught the life of your bonds. But as an investor, that doesn't make any sense tying your money to receive almost two percent lower that you could if you hold new bonds. So a prudent thing to do is to sell your bonds at a discount and replace them with higher interest bonds.
Now consider the reverse situation. If new bonds selling for $1,000 offer only a 5 1/2% interest rate, you'll be able to sell your 6 3/4% XYZ bonds for more than what you'd paid--say, you could sell them for $1,200 per bond -- since buyers will be willing to pay a premium to obtain your higher interest rate bonds.
A side note: In the financial jargon, you will often hear people mention the terms discount or at a discount and premium or at a premium quite a lot. A discount is to buy/sell something (usually stocks or bonds) less than the original price. A premium is to buy/sell more than the original price.
A bond contains value to investors. Two factors usually determine a bond's value:
- Yield. How much you'll earn from interest payments compared to what you could earn from other investments. The higher the yield on your bond the more money you earn, and also the more people wanting to buy your bond from you. Bonds are tradeable securities.
A bond's yield is not the same as its interest rate. The term yield describes what you'll actually earn from a bond, based on a simple calculation. Investors determine bond values largely by comparing yields.
Dividing the amount of money a bond will pay in interest by the price of the bond gives you a bond's yield. For example, if a bond value (or price) is $1,000 that pays 8% annual interest rate for 5 years, so $80 / $1,000, youll receive $80 a year from this bond. It would yield 8% on that bond. In this case, a bond's yield is the same as its interest rate.
If, however, a year later, the bond loses value and it's sold in the secondary market for $800, the new buyer would still receive the $80 a year in interest payments from the bond issuer. Remember that the par value of that bond is still $1,000, but the same bond is sold for only $800 in the secondary market, a difference yield of 2.1% per year.
Now the $200 difference yields a 2.1% per year (200/800)/12. You hold the bond only for 4 years, and therefore, the total percentage return on that is 8.4% (2.1 X 4).
Now that was just the return on the $800 investment principal. What about the interest payments for four years? Don't they get counted as return on investment?
The correct answer is, "Yes, they all get counted as return on investment." So, since the bond was sold for only $800 the yield for interest payment for each of the four year is 10% (80/800). Add the two yields (2.1% + 10%) together and you would get 12.1%. The new buyer would receive a 12.1% return on investment (or yield).
As you can see, a bond's yield is not the same as its interest rate. The interest rate for the bond is 8% while the yield for that bond is 12.1%.
On the other hand, should the bond be sold in the secondary market -- a year later -- for a premium, say $1200, the new buyer would still receive the $80 a year in interest payments from the bond issuer. Remember that the par value of the bond is still $1,000, but the same bond is sold for a premium at $1,200 in the secondary market. This means that when the same bond is due, you will get only $1,000 (not $1,200).
Now the $200 difference yield a negative of 2.1% per year (200/800)/12. Meaning that your return on your investment is 2.1% lower than you would have gotton had the same bond had been sold for the same amount of $1,000 in the secondary market. You hold the bond only for 4 years, and therefore, the total percentage return (or yield) on that $200 is 8.4% lower (-2.1 X 4).
Now that was just the return (or yield) on the $1,200 investment principal. What about the interest payments for four years? Don't they get counted as return on investment?
The correct answer is: yes, they all get counted as return on investment. So, since the bond was sold for $1200 in the secondary market, the yield for interest payment for each of the four year is 6.67% (80/1200). Add the two yields (-2.1% + 6.67%) together and you would get 4.67%. The new buyer would receive a 4.67% return on investment (or yield).
As you can see, a bond's yield is not the same as its interest rate. The interest rate for the bond is 8% while the yield for that bond is only 4.67%. - Safety. How safe is your bond? In other words, how sure are you that the issuer will repay the loan when it comes due? High safetyness also attracts other investors wanting to buy your bond from you.
A yield to maturity is a more precise measurement of bond value. The figure takes into account is the interest rate in relation to the price; the purchase price versus the par value; and the number of years left until maturity. So, if the par value of a bond is $200 more than you paid, that eventual profit will be added to your interest in calculating the yield to maturity.
Yield to maturity isn't easy to calculate and you almost need to be a PhD in mathematics to be able to calculate the yield to maturity. It's computed according to a complicated mathematical formula that is beyond my scope of expertise. Nevertheless, you should know a bond's yield to maturity before you make a decision to buy. Your broker can provide you with this information.
The Jargon of Bonds
The jargon of bonds (or language/terminology of bonds) can be hard to understand if you're not familiar with some common bond features and terminology. Bonds have many names and types. Bills, notes (senior notes), T-Notes (Treasury Notes), promisory notes, T-Bills (Treasury Bills), zero-coupon, debenture, etc., are all bonds.
All bonds are IOUs or debts that are generally issued by governments or corporations. Bonds differ according to their maturity period -- the length of time until they become due. Bills mature in one year or less. Notes in 1-10 years, and bonds in over 10 years.
Municipalities and corporations only issue notes, bonds, and debenture, but never Bills. Bills are only issued by the U.S. Federal government.
For investment safeguard, investors often turn to T-Bills (Treasury Bills) for their investment. T-Bills are the safest in the world -- because they are backed by the U.S. government. But T-Bills are often offer you little return on investment.
During times of volatile interest rates, investors often turn to T-Bills with their short maturities to avoid being locked into a rate for a long time.
Debenture Bonds
Another form of bonds is called debenture (de`ben`cher). Debenture has a simple meaning. It refers to any bond which is backed by only the good credit (credit worthyness) of the organization issuing it. The term debenture means an unsecured loan certificate issued by a company, backed by general credit rather than by specified assets. So debenture bonds are bonds that have good credit worthyness.
In other words, the issuer doesn't put up any specific collateral assets to assure repayment of the loan. As a bond buyer, you rely on the issuer's full faith and credit (credit worthyness) as your only assurance of being paid the interest and principal on your loan.
This isn't as risky as it may seem. When issued by reliable institutions, debentures are usually relatively safe investments.
Subordinated Bonds
Another form of bonds is called subordinated bond.
Remember, buying a bond makes you a money lender to the organization issuing the bond. You are a creditor--they owed you money and they must pay you back the money that you lend to them. You and other lenders -- individuals and institutions -- have equal rights to receive the repayments of the loan should the organization issuing the bonds default on the loan or go out of business.
The assets of the organization issuing the bonds are usually liquidated and the proceeds are divided up among the creditors -- you and other lenders (individuals and institutions).
When you buy a subordinated bond makes you a subordinated money lender to the organization issuing the subordinated bond. You are a subordinated creditor, and you receive the repayments of the loan after other creditors got theirs -- should the organization issuing the bonds default on the loan or go out of business.
The organization issuing the subordinated bonds is obligated to pay its debts to some other creditors -- such as non-subordinated bondholders -- first before paying you. Your rights are subordinated to the rights of some others.
Asset-Backed Bonds
Another form of bonds is called asset-backed bond. Asset-backed bonds are bonds that are backed by specific assets. The organization issuing the asset-backed bonds pledges specific assets as collateral for the bonds. The most common asset-backed bonds are mortgage-backed bonds.
For these asset-backed bonds, the issuer promises to mortgage properties, if necessary, to repay the loan. Other kinds of asset-backed bonds are bonds backed by equipments or collateral trusts -- security holdings (usually stock holdings) from other institutions.
Floating-Rate Bonds
Another form of bonds is called floating-rate bond. Usually, a bond carries a fixed interest rate throughout its life. Floating-rate bonds are bonds that are periodically adjusted to reflect the fluctuation of the interest rates. This is similar to an adjustable rate mortgage (or ARM) for homeowners holding an adjustable rate mortgage for their homes.
Zero-Coupon Bonds
Another form of bonds is called zero-coupon bond. Most bonds pay out regular interval interest payments. In bond jargon, the term coupon means interest. Zero-coupon means zero interest (or no interest). Therefore, zero-coupon bonds are bonds that pay no interest while the loan is still outstanding. Instead, interest accrues (builds up) and is paid all at once at maturity.
You buy zero-coupon bonds at prices far lower than par value, called deep discounts. Any time the bonds are selling far lower than their par value, say $800 of the bond that has a par value of $1,000, people rush to buy the bonds in droves.
When the bond matures, you receive all the accrued interest plus your original investment called capital, which together add up to the bond's par value. This means that if you buy a bond that has a par value of $1,000 (not necessarily that you paid $1,000), you will get your full payment (accrued interest plus your original investment called capital) in the amount of $1,000--not more.
Callable Bonds
Another form of bonds is called callable bond. Many bonds come with a string attached: the issuer may call (recall or retire) the bonds -- pay off the debts -- any time after a certain number of years, usually after five years into the life of the bond, but not before that.
It's the same idea as refinancing your house to get a lower interest rate and make low monthly payments. This process is called redemption -- redeeming the callable bonds. If only some of the bonds of a specific issue are to be redeemed, those to be called are chosen by lottery.
US Savings Bonds
Another form of bonds is called US Savings bond. Unlike the other kinds of bonds discussed thus far, US Savings bonds are not marketable (tradeable) in the secondary market. They can be bought only from the US government and cannot be traded among investors in the open market.
So US Savings bonds are somewhere between the an investment and a savings instrument -- but they remain an important and popular choice for millions of individual Americans.
In one way, US Savings bonds are the original zero-coupon bonds: you buy them at a discount from par value and, upon maturity, the government pays you the full face value.
For example, if you'd ever bought a $50 US Savings bond as a wedding or other gifts, you might recall paying about $37.50 for it. During the 10-year maturity period, the government paid no interest on that US Savings bond that you bought; however, the person whoever received the gift was able to redeem it for $50 upon maturity.
Actually, the government paid interest on all US Savings bonds, but the interest is factored in the US Savings bond when you bought it.
Convertible Bonds
Another form of bonds is called convertible bond. When you buy a convertible bond, you receive regular interval interest payments just like any other bond. But the difference between a convertible bond and a regular bond is that a convertible bond gives you the option to convert your bond into company stock as repayment of the loan principal instead of cash.
The terms of conversion is alway specified at the time you buy a convertible bond. Make sure to read the terms of conversion before making a decision to buy.
You might ask, "Why not take the cash and use that cash to buy the same stock?" After all, the stock costs you cash (any way you look at it).
But wait, the caveate is in the terms of conversion. The terms of conversion specifies when you'll be allowed to make the conversion -- usually after a couple of years into the life of the bond -- and how much stock each bond can be exchanged for.
The most caveate of all is in the 'how much stock each bond can be exchanged for,' since the price of stock fluctuates -- allowing you to determine whether it is a good investment to convert or not to convert. This is similar to a stock option where a set price called strike price is specified at the time of the granting of the option. Similarly, the price of the stock is specified at the time you buy a convertible bond.
After a couple of years into the life of the bond, the stock price may fluctuate way up, making a conversion seems a good investment. Note also that when you buy a convertible bond there is a chance that you can cash out your bond sooner than if you buy regular bonds.
For example, if you buy a convertible bond and two years into the life of the bond that has a 10-year maturity, you can convert that bond into company's stock and immediately sell your stock holding and realizing the profits instantly along with receiving your principal money in full in just two years [without having to wait 10 years to receive your principal money if you had bought a regular bond].
Yes, convertible bonds can be very profitable if condition is right, and most importantly, you don't have to tie up your principal money very long either if conversion scenario is in your favor.
Let's take a look at an example of Tesla Convertible bond in the amount of $920 million due March 1, 2019. Here is an excerpt of the term on the bonds that Tesla reported in its 2017 10-K filing with the SEC:
"Each $1,000 of principal of these notes is initially convertible into 2.7788 shares of our common stock, which is equivalent to an initial conversion price of $359.87 per share, subject to adjustment upon the occurrence of specified events. Holders of these notes may elect to convert on or after December 1, 2018...."
What it means is that bondholders can elect to receive its principal amount in Tesla's stock for $359.87 a share. If you divide $1,000 by $359.87 equals to 2.7788 shares of Tesla common stock. So each $1,000 of principal that bondholders have can be converted into 2.7788 shares of Tesla common stock.
Speculation on Tesla's Financial Woes:
The wide spread speculation on Wall Street is that Tesla is having huge problem with cash and several bonds are coming due quickly, one in November 2018 in the amount of $320 million (convertible), two on March 1, 2019 in the amount of $920 million (convertible), and as well a $180 million term loan comes due at the end of June, 2019, while about $566 million in convertible bonds mature in November 2019 and several in 2021 and beyond.
The $320 million (convertible) due in November 2018 was issued in October 2013 by it subsidiary SolarCity and carries a 2.75% convertible notes. Conversion price of $560.64 -- meaning -- Tesla stock has to trade at least $560.64 a share up to the due date in order for Tesla to be able to convert the $320 million bond into shares of Tesla. As of right now (August 10, 2018), it doesn't look like the stock will reach that convertible level. So most likely Tesla will have to come up with $320 million in cash to pay off the bond.
As with the $920 million due in March 2019 (March 1, 2019), it was issued by Tesla itself in March 2014 and carries a 0.25% convertible notes. Conversion price of $359.87 -- meaning -- Tesla stock has to trade at least $359.87 a share up to December 1, 2018, the earliest date the bond can be converted into stock. If the stock is not at $359.87 by December 1, 2018, the deadline for conversion is still March 1, 2019, if the stock can reach the coversion price. So both parties have until March 1, 2019, to execute the conversion in the event that stock price reaches the conversion level. Otherwise, Tesla will have to come up with the $920 million to pay off the bond.
One of the speculation is that Elon Musk was trying to drive up Tesla's stock price above $359.87 a share so that he doesn't have to use cash to pay back the bondholders in principal payments when he tweeed on August 7, 2018, that he has a plan to take Tesla private with a price tag of $420 per share. Initially Tesla's stock price jumped up to $380 a share but as investors realized that Musk's plan was not going to work, the stock dropped back to around $350 a share.
If Tesla's stock price is trading above $359.87 by December 1, 2018 -- the earliest date the bond can be converted into stock -- and possibly stays above $359.87 until March 1, 2019, the bondholders would most likely convert their bonds into shares of Tesla because it is more profitable than receiving cash for their principal investment. So the higher the stock price the more profitable the bondholders stand to benefit if they hold a convertible bond.
Note that the 2021 bonds are non-convertibles, where the principal is always repayable in cash, but the 2018 and 2019 convertibles may be redeemed wholly in shares (at Tesla's option and if the requisite conversion ratio has been met). So, it all looks very simple - if the share price goes above $359.87 by December, Tesla can escape the payment by issuing shares instead, but if the price is below, as currently seems likely at this writing August 10, 2018, Tesla will have to come up with the cash, right? Well, not exactly.....
Tesla can issue more stock to sell to the public and use that cash to pay off the bondholders. But having stock prices higher benefit Tesla because Tesla can sell less shares to earn more cash. On top of that, if Tesla's stock is higher than$359.87 Tesla doesn't have to issue more shares to sell -- they can just elect to convert the bonds into shares of Tesla's stock.
So having Tesla's stock stay high has many benefits to Tesla and that's why Wall Street was speculating that Musk's motive was to drive up Tesla's stock when he tweeted about taking Tesla private.
Now in about two years later, Tesla's stock was trading above $2,000 in July and in much of the early August of 2020, making the convertible bonds talk above a moot point or non-issue.
In other words, Tesla and Elan Musk won the battle against critics particularly short sellers who bet against him and his company and lost their shirts to the tune of $38 billions in 2020 alone.
And my gosh, Elan Musk won big against his critics and at the same time propelled himself to the tune of being the richest people on earth (worth $194.8 billion as of January 7, 2021), beating Jeff Bezos ($185.8 billion) of Amazon for the top spot.
Update: August 12, 2020. Tesla stock came down to earth to: $1,374/share after Tesla's stock price climbed above $2,000 recently.
On August 12, 2020, Tesla announced a five-for-one stock split set to take effect at the end of August 2020 after Tesla's stock price climbed above $2,000 recently.
Every Tesla shareholder will receive four additional shares for every share they currently own when trading ends on August 28, 2020, the company said in a press release. The value of all five shares will equal the stock's pre-split closing price from that same day.
Trading of Tesla shares on a split-adjusted basis will begin on August 31, 2020, and is expected to be right around of Tuesday's (August 11 2020) closing level, in which the newly split shares would be worth right around roughly $274 each. The split alone won't change Tesla's market cap. Yet cutting the barrier to entry for smaller investors to buy in could boost Tesla's share price.
Update: December 31, 2020. Tesla stock: $706/share up from the post split of $274 a share on August 28, 2020.
Looking to add bonds to your portfolio?
How to Invest in Bonds: A Step-by-Step GuideIf you're looking to get started with bond investing, here's a step-by-step guide that will teach you everything you need to know.
- Understand the basics of how bonds work. To get yourself up to speed on how bonds work, familarize yourself in my other tutorial called "Introduction to Bonds."
- Decide which type of bonds to buy. Not all bonds are created equal. In fact, there are several types of bonds you might choose to buy:
- Corporate bonds are those issued by companies to raise money for things like research and capital improvements. The interest you receive from corporate bonds is taxable at both the state and federal level.
- Municipal bonds are those issued by cities, states, and other localities to finance public projects and increase public services. The interest you receive from municipal bonds is always tax-exempt at the federal level, and if you buy bonds issued by your home state, you can avoid state and local taxes as well.
- Treasury bonds, or T-bonds, are those issued by the U.S. government. The interest you receive from T-bonds is taxable at the federal level, but exempt from state and local taxes.
- Convertible bonds are bonds issued by publicly traded corporations. In other words, convertible bonds are bonds that can be converted into publicly traded stocks. Convertible bonds can be a very lucrative investment if you happen to find convertible bonds issued by explosive growth companies, because stocks of growth companies tend to grow explosively along the companies themselves. So make sure you do your due diligence on the companies and its future prospect and don't forget to read the bond's debenture or terms.
- Choose an investment horizon or maturity date. While you're not required to hold your bonds to maturity, if the value of your bonds falls after you buy them, you may have no choice but to retain them long term to avoid taking a hit on your principal investment.
That's a big reason why you'll need to put some thought into your ultimate investment horizon. Because bonds come with differing terms (10 versus 20 versus 30 years, for example), setting some investment goals can help you determine how long to potentially lock your money away for.
Remember that you can sell your bonds at any time and you don't have to hold them to maturity, but be aware that the price of your bonds may fluctuate according to market conditions.
- Research your investments. You'll often hear people making statements like these: "Bonds are a safe investment, and stocks aren't." But it's rarely that simple.
While bonds are typically less volatile than stocks, choosing the wrong bonds could expose you to more risk than you may have bargained for. That's why it's important to look at bond ratings when choosing a company or municipality to invest in. The higher the rating, the less likely your issuer is to default on its obligations.
On the flip side, bond investors tend to be rewarded for taking on more risk, so if you buy bonds from an issuer with a lower rating, you'll typically snag a higher interest rate.
If you don't want to shoulder the risk of buying individual bonds, you could always invest in a bond fund instead, which gives you instant diversification. Think about it: If you buy bonds from a single issuer and that issuer defaults, you're out of luck. But if you buy a bunch of bonds and a single issuer defaults, you'll continue to make money from the rest of the bonds in that pool.
The downside of bond funds, however, is that your income stream will be less predictable, as you won't get those same steady interest payments that holders of individual bonds collect. One of the reasons is that bond funds are actively managed by fund managers who buy/sell bonds the moment they feel the bonds are in/out of favor.
In other words, like stock fund managers, bond fund managers buy/sell bonds actively and rarely hold their bonds to maturity.
You can also check out the rating agencies such as Moody's Investors Service, Fitch Ratings, Standard and Poor Ratings, and learn their rating classification.
No matter your age, bonds can play a big role in helping you meet your investment goals. Just make sure to weigh the pros or cons of bonds versus other instruments so that your choices align with your ultimate objectives. - Just like investing in stocks, you don't need thousands or millions of dollars to invest in bonds. It can be as little as $50 to invest in individual bond. Just like in stock, in which, you have to have a minimum amount of money to buy a share worth of stock, in bonds, you have to have a minimum amount of money to buy a lot or unit worth of bond as well. Bonds are sold by the lot or unit just like stocks are sold by the share.
Corpoate bonds are sold in lot or unit denomination of $1,000, which means that all you have to have is a $1,000 to buy any corporate bond.
Goverment bonds (issued by the U.S. government or by municipalities like cities, states, and other localities) are sold in lot or unit denomination of $50, $100, $1,000, which means that all you have to have is $50 to buy any government bond.
- The best place to get your feet wet with bond investing is to signup a trading account with one of the brokerage services. Check out an instruction that I put out called "Get Started Trading Options." Once you have an account, you can trade stocks, bonds, options, mutual funds, etfs, etc.
As always, if you have any question you can ask your brokerage representative on how to invest in bonds or any other investment (for that matter).
What is a yield curve and why is everybody talking about it so much?
Before I answer that, let's see the synopsis:- If you invest in equities, you should keep an eye on the bond market.
- If you invest in real estate, you should keep an eye on the bond market.
- If you invest in bonds (or bond ETFs), you should definitely keep an eye on the bond market!
So everything with yield curve has to do with bond yields -- and bond yields have to do with the economics principle supply and demand.
The higher the bond yield, the lower the demand for that bond. Likewise, the lower the bond yield, the higher the demand for that bond.
Say what? The higher the bond yield, the lower the demand for that bond? Does it make any sense?
Take it this way: When you see stores with advertisement that says something like 30% off, 40% off, 50% off, or 60% off, they're telling you that their products are not in high demand and to get rid of those products, they have to lower prices to entice customers to buy them.
Bonds work the same way: When there are lack of demand for the bonds, their yields are typically higher because seller(s) of those bonds will offer bond buyers with higher interest rates to entice bond buyers to buy those bonds; and therefore, making those bonds having higher yields. Make sense?
So the yield curve is the graph that plotted the bond yields. Economists use charts and graphs to interpret the activities of the economy and bond yields is a very important key that drives economic activities.
In the graph illustrated below shows the yield curve for the 10-year bonds, and it is not upward slopping, but rather, it is flattening, which means that the demand for 10-year bonds are in high demand, driving their yields down, hence the flattening of the yield curve. In other words, people are buying more 10-year bonds than they're buying 2-year bonds.
The bond market is a great predictor of future economic activity and future levels of inflation, both of which directly affect the price of everything from stocks and real estate to household items.The yield curve is a curve on a graph in which the yield of fixed-interest securities (typically bond yields) is plotted against the length of time they have to run to maturity. So bond yields are used in the graph to plot the curve at various length of maturity. A yield curve is almost always upward sloping, a sign that the economy is functioning properly.
The bond yield curve has in the past been a signal of an impending recession. When the interest yield on the 10-year US Treasury bond becomes the same as the two-year bond, recessions have often followed. The "curve" is the line that plots the difference between them over time. Right now (year 2018) that line is
trending toward zero, or flat. See the graph below:
As you can see, the graph should be sloping upward considering how well the economy is doing right now (2018). Is the downward sloping telling us there is an impending recession? There are both sides of this debate.
The horizontal line that has number 0 (zero) can be viewed as the benchmark 2-year bond yield (for easier interpretation). It is actually a line representing maturity dates, however. A 10-year bond is plotted against this horizontal zero-line with varying maturity periods.
If the plotted graph representing a 10-bond goes below zero -- an "inversion" in which the yield on the two-year bond would be greater than the 10-year -- that traditionally signals something is very wrong in the market.Why?
Because a flat or negative yield curve suggests investors believe keeping your money in short-term bonds is more uncertain than bonds that pay off a decade from now. Think about it. That position doesn't make sense. Why would you be more certain about 2028 than 2020?
Thus, when the curve inverts or crosses the ten-year U.S. Treasury bonds yield, it signals something very risky is happening in the near-term asset markets.
To best understand the yield curve, put yourself in the shoes of the lender, the borrower, and the investor. Each entity is rational and looking to do what's best for their bottom line.
Lender's Perspective
Due to inflation, the value of a dollar tomorrow is worth less than the value of a dollar today. Therefore, in order to profitably lend money, you must charge an interest rate. The longer the lending term, the higher the interest you should charge, hence the upward slope of the yield curve.
Make note that the 10-year bonds should always have higher interest rate than the two-year bonds. But according to the graph above, the 10-year bonds yield curve is trending toward the two-year bonds yield curve. Something fishy is going on!
If the borrower has a poor credit score, runs an unstable business, has large job gaps in his resume, not well-versed in the financial market, or doesn't have many assets, then you need to charge an even higher rate to account for credit risk. If you can get a borrower to pay back an interest rate higher than your competition, you're making superior economic returns. That's the goal of the lenders.
If you are a bank, your main source of funding is from saving deposits. For the privilege of holding such deposits, you pay customers an interest rate and hope to lend out their deposits at a higher interest rate for a positive net interest margin. If the yield curve is upward sloping, banks have an easier time achieving such profitability as appose to the yield curve is trending in a downward sloping.
In other words, the upward slope of the yield curve tells us that banks are able to borrow and lend money at a profitable margin. If that is the case, banks would surely continue to borrow and lend, making the economy forging along ahead.
Besides using depositors money, banks borrow money from other sources as well at short-term rates (usually at very low interest rates) and turn around and lend it at higher interest rates for longer-term periods. The greater the difference between the two, the more profitable it is for banks to borrow and lend money. However, when this gap shrinks causing the yield curve to flatten, it becomes less enticing for banks to borrow and lend. And when the yield curve inverts, banks have virtually no desire to lend money, leading to a halt in growth and a recession.
Borrower's Perspective
A rational borrower is incentivized to:
- borrow as much money.
- for as long a period of time.
- at the lowest interest rate possible to get rich.
The more you borrow, the more you will likely invest. When the borrowing rate is equal to or below the inflation rate, a borrower is essentially getting a free loan.
The classic borrower example is the homebuyer. After putting down 20%, the buyer borrows the remaining 80%. The lower the interest rate, the more inclined the borrower is to take on more debt to buy a bigger, fancier house. When homebuyers want to stretch, they take out short-term adjustable rate mortgages (ARM) with lower interest rates versus 30-year fixed loans with higher rates. In a declining interest rate environment, taking out an ARM is an optimal move.
In addition to homebuyers, there are companies large and small, that borrow money to grow their businesses. If interest rates are lower at every duration, businesses will tend to borrow more, invest more, hire more, and consequently boost GDP growth.
Given the motivations of the borrower and the lender, the investor sees the yield curve as an economic indicator. The steeper the yield curve up to a point, the healthier the economy. The flatter the yield curve, the more cause for concern given the borrower's doubt about the near future.
If there is a lack of demand for short-term bonds, pushing short-term yields higher, perhaps there is doubt about short-term economic growth. Similarly, if investor demand for long-term bonds keeps long-term yields low, this may mean investors don't believe there are inflationary pressures because the economy isn't viewed as trending stronger.
A Side Note: In general, interest rates and bond prices fluctuate like two sides of a seesaw--when one side move the other react in opposite. This is the law of economics at work. In other words, when interest rates move higher bond prices move lower -- or vice versa. So if there is a lack of demand for short-term bonds, short-term bond prices move lower because no one is buying them and causing their prices to drop while at the same time pushing their short-term yields higher. The law of economics at work.
Short-term yields are also artificially pushed up by the Federal Reserve since the Fed Funds rate is the overnight lending rate -- the shortest of the short. An investor needs to make a calculated guess as to how often and how aggressively the Federal Reserve will raise its Fed Funds rate and how the bond market will react to such moves.
The bond investor wins if inflation comes in below expectations. Inflation comes in below expectations when economic growth comes in below expectations. The stock investor wins if economic growth comes in above expectations, generating stronger corporate earnings growth, while interest rates remain at a level high enough to contain faster-than-expected inflation while not choking off investment growth.
Why A Flattening Yield Curve Is A Warning Sign
Depending on who you talk to, flattening yield curve means different thing to different people. Some say a flattening of yield curve is a signal of an impending doom of the economy, but some skeptics say the curve has been distorted by central banks' bond-buying programs, which have artificially made the curve flatter than it might have been. So the curve is a bad signal to predict the health of the economy, they say.
Some strongly believe that an inverted yield curve is a clear signal that some sort of recession is forthcoming. They point out that every recession since the 1950s has been preceded by a yield curve inversion. While the lag between inversion and recession has varied between six months and two years, the one has always followed the other, with only one exception in the mid-1960s, they say.
"Historically, an inverted curve has been the single best indicator of market expectations," said Thanos Bardas, a managing director at Neuberger Berman. "The pattern moves from higher inflation to excessive tightening to an inversion and then a recession."
Normally, the Fed intends for that pattern to occur in order to slow an overheating economy. With inflation finally trending near the Fed's stated target of 2 percent; however, it can hardly be characterized as high. Bardas, too, believes that the Fed should be responsive to market forces and not risk an inversion of the yield curve. "If the curve continues to flatten, the Fed may need to pause [its rate hikes]," he said.
Why is the yield curve flattening? The simple answer is the rapid rise of the 2-year Treasury yield. It has risen much faster than changes in the Fed funds rate because the market now believes that the Fed's policy path is more certain given the strong economy.
But some believe otherwise, "... this time it's different," a UBS economist told clients (in a tongue-in-cheek way). He called the curve signal a "myth."
So who's to believe?
A sensible answer to that question is probably: both.
In other words, be wary and proactive and always taking steps to protect your investment.
Investments can be made profitable when the market goes up, down, or sideway, if you are willing to just learn a few simple options strategies to take advantage of the market conditions. Use options is the most profitable way to take advantage of the market conditions when it is falling.
You don't even need to know ahead of time if the market is in a recession, you only need to watch the market periodically and when the market sentiment is trending lower you can put your strategies to work during the down turn cycle, because bear market stays for a while and it doesn't just go down in or two days -- it usually moving gradually lower and lower. This way, you can catch its downward spiral and make money in the process. So yes, bear markets can be a profitable investment if you take time to learn a few strategies using options.
Take a look at the yield curve below for today August 2018 versus the yield curve in 2017 and 2016. It's clear the yield curve has flattened as short-term rates have risen faster than long-term rates.
As you can see from the diagram above, the top line in dark purple color is the U.S. Treasury 10-year yield and the bottom line in light blue color is the U.S. Treasury 2-year yield.
Short-term (U.S. Treasury 2-year) rates are rapidly equaling long-term (U.S. Treasury 10-year) rates. See the below graph:
If the Fed raises the Fed Fund rate by another 0.5% in the next 12 months the yield curve will be completely flat if not inverted by 2019 if long-term rates stay the same.
With a flat yield curve, you are disinclined to lend money over a long duration because the return is too low relative to the short-end. As a result, you tighten up lending standards and lend to only the most creditworthy people. You'd rather lend money for as short a time as possible because the interest rate you can receive is similar to the long-end. A shorter lending time horizon is also less risky than a longer time horizon.
Unfortunately, borrowers think exactly the opposite. Borrowers are less inclined to borrow capital short-term if the interest rate is very similar to long-term interest rates. They'd rather borrow at the same rate for a longer time period, but are often shut out due to more stringent lending standards.
If the yield curve inverts, i.e. when short-term interest rates are higher than long-term interest rates, the rational borrower slows or stops his borrowing. Only the most desperate (least creditworthy) borrower takes out a short-term loan at a higher interest rate (e.g. credit card and loan shark borrowers). This ultimately ends up hurting both the lender and the economy long-term due to higher default rates.
A cascade of defaults by overstretched mortgage debtors is exactly what took the housing market down between 2007-2010. There will eventually be an interest rate inflection point where the borrower not only stops borrowing, but starts saving more. With borrowers saving more, investment, by definition slows down. Multiply this action across millions of people throughout the country and the economy will turn south.
This Time Is NOT Different
In economics and finance, everything is rational long term. Investors take action to enrich themselves, while doing their best to avoid actions that will make them poor.
The tricky part is not forecasting if a recession will happen once the yield curve inverts. The tricky part is forecasting when the recession will happen. If the Fed raises its Fed Funds rate by more than 50 basis points over the next 12 months, the yield curve will most likely be inverted as I'm of the belief long bond yields stay flat.
Therefore, the logical conclusion based on history is that a possible recession will arrive by 2020. I want to caution and emphasize the word "possible" but also be mindful that it is not likely to happen in 2020. Maybe beyond 2020 looks like more realistic given the Fed's anormous power to steer the economy. Of course, long bond yields can rise to prevent the inversion, but higher rates slow down economic growth. Therefore, either way, strong head winds are coming, whether it happens in 2020 is not known.
Yes, banks have taken measures to shore up their balance sheets and tighten lending standards since the last recession. But we cannot underestimate greed or the stubbornness of the Fed to over-tighten to prevent inflation from getting out of control. Everyone should be paying attention to a flattening yield curve and take precautionary measures to protect their wealth.
Do you ever wanted to know how they calculate indexes?
Synopsis: We (Economists) love indexes and know how to create and calculate indexes. It's a requisite!An index is a number that measures the change in value over time. In other words, an index is a measure of value over time; the change in value over time. For example, an index number is used to measure changes in national income, employment, production, prices, wages, etc., over a period of time.
Some well-known examples of indexes include the Consumer Price Index (CPI), Standard & Poor's 500 stock index, better known as the S&P 500, and of course, the Dow Jones Industrial Index, also better known as the Dow or Dow Jones.
Working with a group of large numbers is sometimes inefficient and confusing, and an index allows you to use a simplified value to easily compare and track against other data points over time.
For example, the U.S. as a whole provides about 140 million jobs. Using an index to simplify the numbers, you can easily compare its percentage job growth over time to that of other states, such as of Texas, even though Texas has only about 20 million jobs.
Converting the data to index values makes it easier to see the percentage change each year when comparing the two sets of data side by side, even though the magnitude of jobs for the whole U.S. dwarfs the number of jobs in Texas.
When using an index to track changes over time, you may find that the data changes and becomes less comparable to the original, or base data. For example, when tracking unit sales of a product over time, the price may experience a permanent increase. Although unit sales of the product haven't actually grown, the index shows growth because of the products new, higher price.
In terms of an index measuring changes over time using a market basket of goods and services, such as the CPI, some goods or products may increase in price, change in quality or other features that make them no longer comparable against the original base value of the index or its earlier data points. Compensating for this issue, although not a perfect solution, would require updating the base basket of goods and earlier data points periodically to reflect and compensate for these types of changes.
The Base Calculation
To start an index, you have to start with a base value so that you can compare the changes in actual value over time against this base value.
An index starts with a base value, typically set at 100, regardless of whether the index measures data units in dollars, euros, or headcount, for example. Each subsequent value in the index is then normalized to this base value. When looking at the percent change between different calculated index values, you will find that it's exactly the same as the un-normalized or non-indexed data percent change.
Using an index to measure changes in data allows you to calculate the percentage change between the points in the index without the need to know the actual data numbers. The index points become normalized when dividing each number by its base value, meaning that the values on different scales become converted into a common scale for ease of comparison.
Calculate Index Values
The first step in constructing an index involves setting the base value. For a time series of annual company sales, for example, say the first year, sales were $150,000. This base-year amount is set to equate to the starting index value of 100. Each added value becomes normalized against the base value. In other words, each added value is the change of value from the base value. If you multiply this change in value by 100, you'll get the percentage value that is changed or different from the base value. See the following examples to get a better idea.
To calculate the value of the next data point in this indexed time series, let's say, the second year of annual sales equates to $225,000. You would divide the new data point ($225,000) by the original one ($150,000), multiplying the result by 100 as follows to get a year 2 index value of 150.
(Year 2 sales of $225,000 / Base year sales of $150,000) * 100 = 150
What does the number 150 represent?
Well, you could look at it this way and say the annual sales has increased by 50% (base value is 100 plus half that value in year 2 to equal 150). The number 150 is the index number for the second year representing the annual sales. Had the annual sales gone down, say to $75,000, the index number would have reflected this decrease in value of 50% to an index value of 50.
Remember that the base value of the index is 100 and the second year index is 50 -- dropping half of its base value. Indexes go both ways, up or down following the real world activity. Likewise, the Dow Jones has gone up from the base value of 100 at its inception more than 100 years ago to right around 25,000 as of this writing (October 2018).
Each new year of data is subsequently normalized against the base year of $150,000 in the same fashion. If years 3, 4 and 5 had sales of $325,000, $385,000 and $415,000, the corresponding calculated index values would be 217, 257 and 277, respectively. For example:
(Year 3 sales of $325,000 / Base year sales of $150,000) * 100 = 217
(Year 4 sales of $385,000 / Base year sales of $150,000) * 100 = 257
(Year 5 sales of $415,000 / Base year sales of $150,000) * 100 = 277
Let's see another example to help you understand better. Suppose that in your own household you buy food items on a regular basis for your household consumption. To track how those prices rise or fall, you can create and calculate an index called it a Household Price Index (or HPI) similar to the well-known CPI index. Since this index is for your own household consumption purposes, it only contain a few food items.
Let's say year one these items cost:
- pork costs $6.89 per pound. This base-year amount is set to equate to the starting index value of 100.
- fish cost $14.99 per pound. This base-year amount is set to equate to the starting index value of 100.
- bread costs $4.89 per loaf. This base-year amount is set to equate to the starting index value of 100.
- milk costs $5.49 per cart. This base-year amount is set to equate to the starting index value of 100.
- lettuce costs $2.89 per head. This base-year amount is set to equate to the starting index value of 100.
Here, we are tracking five items so we have to calculate each item's index first and then average them to get the final index number. To calculate the subsequent years you can create an index formula chart for easy calculation and plug the prices you get from the store into this chart. For example, if year 2 comes around and you go to the store and get the exact new prices and plug them in this chart and calculate them accordingly. For example:
- For pork: (new price / base price of $6.89) * 100 = ?
If new price is $6.99, then the index for pork is 101.45. - For fish: (new price / base of $14.99) * 100 = ?
If new price is $15.59, then the index for fish is 104. - For bread: (new price / base of $4.89) * 100 = ?
If new price is $4.99, then the index for bread is 102.50. - For milk: (new price / base of $5.49) * 100 = ?
If new price is $4.99, then the index for milk is 90.89. Notice that the price of milk has gone down 9.11% from the previous year. This will effect the overall index number. - For lettuce: (new price / base of $2.89) * 100 = ?
If new price is $2.99, then the index for lettuce is 103.46.
Now to get the final index number we have to average the five index numbers by first adding: 101.45 + 104 + 102.50 + 90.89 + 103.46 = 502.30 and then dividing the result by 5. For example:
502.30 / 5 = 100.46
What does the number 100.46 mean?
Well, this number is the index number for the HPI in the second year of the existence of the HPI. It tells us that the food prices as a group of five items have increased only 0.46% from the year before. Hardly any changes. However, if you look at the individual item the general food prices has gone up about 3% and only one particular item (milk) that has gone down significantly about 9.11%.
That one item pulls down the final index number significantly and that's why the CPI uses a lot of food items (several hundreds of them) in their calculation so that if any one item rises or falls dramatically it won't effect the overall (final) index number that much.
Any subsequent/given year down the road, you can just get the actual new prices from the store and plug them in the chart and calculate them accordingly as it was done above.
Conclusion: The Dow Jones Industrial Index (containing 30 stocks) and the Consumer Price Index (containing a basket of food items) are calculated in similar fashion. Now you know how indexes work and know how to create and calculate them. You can use this example to create and calculate your own indexes to suit your objective. It's a powerful method of measuring things. Have a go at it!
Do you ever wonder how analysts get all the information about a particular publicly traded company?
The first place to get the information about a particular company is not at the company itself, but at the Security Exchange Commission webiste. Publicly traded companies report all information to the SEC and the SEC makes all information available to the public.At the SEC website, you can find a company's financial statements and information about its operations. Companies making a new offering of securities, e.g., IPO, secondary offerings, must disclose information about the company's financial condition and its operations in a registration statement.
Each year companies must file an annual report about its financial condition and its operation. The annual report filed on Form 10-K is the primary document you can use to research a company's financial condition and its operations. The Form 10-K includes audited financial statements, a discussion of products and services, a review of operations, management discussion and analysis, and a discussion of the company's major markets.
The condensed financial statements included in the filings provide the company's assets, liabilities and earnings per share. Since the passage of the Sarbanes-Oxley Act of 2002, an issuer must include certifications from the issuer's CFO and CEO concerning the accuracy of the Form 10-K (and Form 10-Q as well). These certifications (the Sections 302 and 906 certifications) generally are attached to the filings as Exhibits 31 and 32.
In addition to the annual report, companies must also file quarterly reports using Form 10-Q. The quarterly reports filed on Form 10-Q will include unaudited financial statements as well as additional information about the company's current financial position and operations.
The SEC has a wealth of databases information about companies and the information is searchable using keywords or phrases. The SEC has a specialized database engine called EDGAR (an acronym for Electronic Data Gathering, Analysis and Retrieval).
EDGAR is the electronic filing system created by the Securities and Exchange Commission for easy and flexible to use while helping increase the efficiency and accessibility of corporate filings. The system is used by all publicly traded companies when submitting required documents to the SEC. Corporate documents are time sensitive, and the creation of EDGAR has greatly decreased the time it takes for corporate documents to become publicly available.
Here are typical questions that have been asked:
Where can I find market information about a company, including market risk?
The primary sources for market information are the registration statements, prospectuses and annual reports filed on Form 10-K. In addition to providing a description of the class of securities, these documents will disclose:
The primary market(s) where the security is traded. If there is no established public trading market, the issuer will make a statement to that effect.
Where can I find information about a company's business (including segments)?
Registration statements, prospectuses, and the periodic reports filed on Form 10-K and Form 10-Q will provide a general description of a registrant's business, its subsidiaries, and any predecessors over a five year period (or less if the company has not been in operation for five years). The filings will disclose:
- The year the company was organized.
- The company's form of organization.
- Principal products produced, the principal markets for the products, and the methods of distribution.
- Number of employees and anticipated material changes in the number of employees in various departments.
- Competitive Conditions.
- Research and Development.
Information concerning material pending legal proceedings other than "ordinary routine litigation incidental to the company's business" must be disclosed in the company's registration statements and periodic reports filed on Form 10-K and Form 10-Q. In general, claims for damages do not have to be disclosed if the amount, exclusive of interest and costs, does not exceed 10 percent of the registrant's current assts. However, the issuer must disclose information concerning any material bankruptcy, receivership, or similar proceeding (including those involving a subsidiary).
Under current rules, a company also must disclose the filing of a bankruptcy petition on Form 8-K (Item 1.03) four days after the event.
Where can I find a company's articles of incorporation and by-laws?
Although they may be incorporated by reference, you can find a company's articles of incorporation and by-laws in Exhibit 3 to registration statements filed on Forms S-1, S-4, S-11, F-1, F-4, 10, and periodic reports filed on Form 10-K and Form 10-Q.
Where can I find a list of a company's officers and directors?
Registration statements and periodic reports filed on Form 10-K and Form 10-Q include the names and background information about the registrant's executive officers and directors. An issuer may incorporate this information by reference to either the proxy materials or to the annual reports to shareholders. A company must disclose the resignation of a board member in Item 5.02 of Form 8-K (prior to August 23, 2004, these changes were disclosed in Item 6 of Form 8-K).
Where can I find a list of a company's subsidiaries?
A list of subsidiaries must be disclosed to the SEC as Exhibit 21 to registration statements filed on Forms S-1, S-4, S-11, F-1, F-4, 10, and the annual report filed on Form 10-K.
What types of "material contracts" must an issuer file as Exhibit 10 to a registration statement or periodic report?
Items 601(b)(10) of Regulation S-K and Regulation S-B describe what constitutes a material contract. Examples of material contracts include:
- Asset Purchase Agreements.
- Bridge Loan Agreements.
- Cash Bonus Plans.
- Director Fee Agreements.
- Director Indemnification Plans.
- Employment Agreements.
- Executive Compensation Plans and Incentive Plans.
- Financial Services Agreements.
- Joint Venture Agreements.
- Lease Agreements.
- Letters of Intent.
- License Agreements.
- Pension Plans.
- Profit Sharing Plans.
- Purchase Agreements.
- Stock Option Agreements.
- Stock Purchase Agreements.
- Termination Agreements.
Where can I find information about the compensation of a company's officers?
The easiest place to look up information on executive pay is the annual proxy statement. Definitive proxy materials generally are identified in SEC's database provider called EDGAR as form types DEF 14A. For filings in compliance with the changes to the disclosure provisions adopted in 2006, investors should look at the Summary Compensation Table and the Compensation Discussion and Analysis.
Insider Transactions
When must corporate insiders disclose their transactions in the issuer's securities?
Forms 3, 4 and 5, describes the disclosure requirements for corporate insiders. In general, changes in ownership are reported on Form 4 and must be reported to the SEC within two business days (this reporting time frame became effective on August 29, 2002).
Can I search for insider transactions by the individual's name?
Yes. You can search the EDGAR database by typing in the individual's last name and first name in the box marked company in the Companies and other Filers search page. You also can search by the individual's CIK number.
Must all corporate officers disclose their transactions?
No. Rule 16a-1(f) defines who is an "officer" for purposes of filing Forms 3, 4, and 5. These individuals include, but are not limited to, the issuer's president, principal financial officer, principal accounting officer, and the vice-presidents of the issuer's principal business units or divisions.
Can I search EDGAR only for insider forms?
Yes. You can limit a search to the insider transaction forms by clicking the radio button marked "only."
Can I find a list of all insider transactions for a specific time period?
Yes. In addition to doing a header search by form type and date, you can find insider transaction reports for previous five business days by using the current events analysis. However, you will not be able to limit your search to only Forms 3, 4 and 5.
Why can't I find Forms 3, 4, and 5 filed prior to June 2003?
Prior to June 30, 2003, the SEC did not require that Forms 3, 4 and 5 be filed electronically through EDGAR, although filers had the discretion to do so. You can submit a request for a hard-copy of these manually-filed forms.
Business Combinations
Can I obtain a list of companies involved in mergers and acquisitions through EDGAR?
No. EDGAR does not organize filings in this fashion. However, you can do header searches for specific periods of time to find filings used in connection with mergers and acquisitions such as the Form S-3, Form S-4 and proxy materials.
Can I find the terms of a specific merger or acquisition in EDGAR?
Yes. You can look at Form 8-K. Item 1.01 of this form requires disclosure of information concerning the entering of material definitive agreements; Item 1.02 requires disclosure of the termination of such agreements. Item 2.01 requires the disclosure of information relating to the completion of the acquisition or disposition of corporate assets. You also can look for exhibits to periodic reports filed on Form 10-K and Form 10-Q.
If the merger or acquisition required a vote by shareholders, the agreement also is available in the proxy material file with the SEC on Schedule 14A.
Initial Public Offerings
Can I find a list of upcoming IPOs on EDGAR?
No. Although you can search for registration statements filed during specific time periods, the data available through EDGAR is not organized by upcoming IPOs. If a registration statement is effective, you may want to check the exchange or market where the security will be listed or quoted to see when the IPO is scheduled.
How do I find out the date of an upcoming IPO?
An issuer must file both a registration statements and a prospectus with the SEC. However, these documents will not include the intended date of the IPO. Rather, the company determines the date of the IPO once it meets the listing requirements of the exchange or market where the securities will be listed or quoted.
Where can I find historical information about IPOs?
EDGAR does not include a list of historical IPOs. However, if you are looking for the IPO date for an offering made by a specific company, you can check the periodic reports filed near the time of a registration statement to see if they reference the date of the IPO.
If a company files a registration statement with the SEC, when will the IPO occur?
The filing of a registration statement does not mean that the IPO will occur. First the registration statement may be amended one or more times before it is effective. Even after the registration statement is effective, the company may not pursue the IPO.
What is a "shelf" registration?
Issuers may use a Form S-3 registration statement for securities to be offered on a delayed or continuous basis. Issuers use "shelf" registrations when they want securities to be offered as quickly as possible once funds are needed or market conditions are favorable.
Since December 2005, "automatic shelf registrations" have been available for certain issuers (i.e. "well-known seasoned issuers"). Automatic shelf registration permits automatic effectiveness, pay-as-you-go registration fees, and the ability to exclude additional information from base prospectuses.
Bankruptcy
Where can I find the date a company filed a bankruptcy petition?
You can find this information in Form 8-K. Prior to August 23, 2004, the disclosure was in Item 3 of the Form. The information is now disclosed in Item 1.03 of the Form. The information also may be reported in Form 10-Q and Form 10-K.
Where can I find the identity of the Court where a company has filed its bankruptcy petition?
An SEC registrant must disclose in Form 8-K the identity of the Court where it filed its bankruptcy petition.
Where can I find information about a company's reorganization or liquidation plan after filing for bankruptcy?
A company must disclose the material features of a reorganization or liquidation plan in the Form 8-K. A copy of a plan as confirmed by the Court must be disclosed as Item 9.01 of Form 8-K.
Are SEC registrants relieved of their obligation to file periodic reports with the SEC?
No. Companies in bankruptcy are not relieved of their reporting obligations. Neither the United States Bankruptcy Code nor the federal securities laws provide an exemption from Exchange Act periodic reporting for issuers that have filed for bankruptcy.
However, the SEC generally will accept the monthly reports an issuer must file with the Bankruptcy Court under Rule 2015 in lieu of Form 10-K and Form 10-Q filings. The issuer must file each monthly report with the Commission on a Form 8-K within 15 calendar days after the monthly report is due to the Bankruptcy Court.
Here is how to get started programming for beginners
If you ever wanted to learn how to program computer programs, particularly learning how to build a website of your own, this tutorial helps you get started and points you in the right direction to achieving your programming goal. This tutorial is not meant to teach you everything about how to program, but rather, a 'get started' guide that guides you in the right direction to help you get started.
For a complete and specific area of programming, such as a particular language you are interested in learning, please check out tutorials on the Web by Googling it. There are lots of free tutorials on the Internet, particularly YouTube.com and the HTML as noted in the following.
A good place to get started is the W3Schools
And here is another good place to get started:
Learn How to Code OnlineAnd here is a forum for the above site where you can ask the experts on programming topics:
Learn How to Code Online: Codecall Programming Forums!As listed in the W3Schools mentioned above, you need to start with HTML and CSS first, and then proceed to server-side languages such as PHP and then to the client-side languages such as Javascript, and then you should learn databases as well, such as PDO and MySQL, and then to specialized languages such as jQuery and Ajax, in that order. So the order you should follow is: HTML, CSS, PHP, Javascript, PDO, MySQL, jQuery, Ajax.
Also as a programmer, you should also get yourself familarized with CURL as CURL is one of the core technologies that is a "must know" for any programmer, if you're going to be able to program interactive applications effectively.
CURL is an interactive client-server technology (or model) that enables you to make request/response to and from the client and server. In other words, in a client-server model, you use a client-side language like Javascript to send a request for content stored on the server and you use a server-side language like PHP to send the content back to the client. So this is called a request/response or client-server model.
cURL stands for client URL.
For more on CURL, please Google it and start from there.
If you have time, you should learn DOM as well. For an introductory course on DOM, see chapter 3 to 7 of my Ajax book called Introduction to Ajax.
If you mastered all the languages mentioned above, you should be able to build any sophisticated Web applications easily. After that, if you want to learn other languages as well, then you should learn those languages listed in the W3Schools mentioned above in no particular preferential order guideline.
W3Schools above listed category under Javascript, which includes Node.JS and other excellent server-side languages as well, but you really only need to learn PHP is enough for a while. PHP is the most popular server-side language out there, but Node.JS is getting more popular as it is very good in streaming applications, such as movie shows and other live streaming applications.
However, you can accomplish the same thing using PHP, but it is easier to program streaming applications using Node.JS than PHP as Node.JS is specifically built for streaming applications.
If you want to learn how to program sophisticated desktop applications, start with Java, and then C++, and then either Python or C# (pronounce 'see sharp') or even Delphi if you dear to venture into the deep end of the programming language world. But the first three or four listed above is sufficient and you can accomplish any sophisticated desktop applications just fine.
If you just want to learn only one desktop language, Java is a very good choice to learn.
If you dear to venture into the deep end of the programming language world for desktop, here is a link to an excellent language called Delphi
Furthermore, if you dear to venture into the deep end of the programming language world for desktop and for cross-platform mobile applications such as building apps for smartphones (i.e., iOS and Android platforms) using Delphi, here is a link to an excellent tutorial titled: Building your first Native Mobile Applications for iOS and Android
Typically, you would need to find an iOS platform SDK to build your iPhone mobile applications that can run on an iOS platform and then you would need to find an Android platform SDK to build your mobile applications that can run on Android platform.
With Delphi mobile platform, you can build both iOS and Android mobile applications using only one SDK platform. This is very convenient and powerful and not to mention the simpicity of having to learn only one platform for building cross-platform mobile applications.
Again, if you dear to venture into the deep end of the programming language world for both desktop and mobile, start with the free and full-featured Community Editions of Delphi and C++Builder. Community Editions of Delphi and C++Builder are designed to help you get started programming. These powerful IDEs provide all the features you need to quickly explore robust app development.
When Community Edition launched it made all the features of the Professional Edition of Delphi and C++Builder free to students and hobbyists in the community: including mobile platforms, desktop database, and the full source code for the runtime libraries. Now the 10.4.2 Sydney update brings the absolutely latest features and updated platform support to Delphi & C++Builder Community Edition.
There's no better way to build powerful native applications for iOS, Android, Windows, and macOS from a single codebase than using the robust and easy-to-learn Delphi language. This makes it the ideal choice for students or anyone who just wants to get things done.
C++Builder is your choice if you want to master the mysteries of the curly brace (see illustration below). It unlocks a huge variety of C++ standard libraries, while still giving you access to the powerful runtime libraries included in Delphi. This is a winning combination for C++ development.
Note that in Delphi, the syntax is slightly different than with other languages, for example, in other languages you use curly braces or brackets '{}' to group your block of code, such as the beginning and ending of a block of code. For example:
In other languages:

class MyClass
    {
     public function aMethod()
          {
           // code block

           if (true)
              {
               //code block
              }
          }
    }

In Delphi:

Type

    TMyClass = class
         public
               class function aMethod()
               begin
                   // code block

                   if (true)
                       begin
                           //code block
                       end; // end if (true) block
               end; // end function aMethod()
    end; // end class TMyClass block

// Notice that in Delphi it uses keywords 'begin' and 'end', followed by a semicolon ';', to seperate
// between blocks.

// Note also that in a main program (not shown here) the final 'end' should be a period '.' instead of
// a ';' to end the whole program.
The Community Editions of Delphi & C++Builder are designed for students and hobbyists. If that is you, and you are new to programming, then download the free Community Edition of your choice [Delphi 10.4.2 CE or C++Builder 10.4.2 CE] and register for the free Learn to Code Summer Camp.
Community Editions are available free of charge to developers, and organizations with fewer than five developers. Here are the download links Start Learning Delphi for Free: Delphi & C++Builder FREE Community Editions Start Learning Delphi for Free: Download the FREE Delphi Community Edition Start Learning Delphi for Free: Download the Free C++Builder Community Edition
If W3Schools doesn't have the topics I mentioned here, just Google around and you'll get plenty of results for you to get started. The same thing is also true for begining Delphi programmers: Just Google around and you'll find plenty of resources to get you full speed learning Delphi. Have fun learning!
Here are the steps on how to get started programming for beginners:
First, you need an editor to write your programs with. There are lots of free editors on the Web such as NetBeans IDE, a free, open-source Integrated Development Environment for software developers, particularly for desktop applications. You get all the tools you need to create professional desktop, enterprise, web, and mobile applications with the Java language, C/C++, and even dynamic languages such as PHP, JavaScript, Node.JS, Groovy, and Ruby.
NetBeans IDE is easy to install and use straight out of the box and runs on many platforms including Windows, Linux, Mac OS X and Solaris.
So if you are interested in learning to program desktop applications and as well as Web applications, NetBeans IDE, unlike many other editors mentioned below, is suiteable for both applications.
Other text editors that are very popular among beginners are Notepad++, Sublime Text, Atom, Ultra Edit, TextMate, BBedit, MAX's HTML Beauty++, etc. Please Google them to learn more about them. Or you can just Google the term 'free text editors' and you'll get a bunch of results.
Personally, I have been using two text editors simultaneously: one is NetBeans IDE because I need to compile and run programs written in Java for desktop applications and another is MAX's HTML Beauty++ for doing non-desktop applications for the Web, such as Javascript, Node.JS, HTML, CSS, etc. MAX's HTML Beauty++ is perfectly suitable for these Web languages.
As noted above, MAX's HTML Beauty++ is only suiteable for building Web applications and NetBeans IDE is suiteable for both desktop and Web applications.
What I like about MAX's HTML Beauty++ old version is that it color-codes all PHP code in yellow and leaving all other programming languages code as a default color, which is a non-color black and white.
Using MAX's HTML Beauty++ old version, you can preview your webpages instantly while you're still building it by switching back and forth between a "preview" and an "edit" mode. This is a great feature for beginners trying to learn how to program Web applications.
If you are not into building sophisticated desktop applications, here is MAX's HTML Beauty++ download that will do the job just fine for building Web applications.
The download above is an older version, which happens to be my favorite version that I am still using it to this day, and I prefer this older version over the newer version, which is a 2004 version. If you prefer the newer 2004 version, here it is: http://www.htmlbeauty.com/bsetup.exe download
As a matter of fact, any text editor, including Microsoft NotePad that comes with your Windows operating system, will do just fine for building Web applications.
Also all these downloaded text editors come inside an archive compression zip file. You need to extract them once you've downloaded them using any archive unzip application. There are lots of free archive zip applications available on the Internet. See the following.
Once you've downloaded your favorite text editor, including my favorite text editor MAX's HTML Beauty++, extract it using free zip extracting applications like WinZip ZIP Extractor Express Zip WinRAR or WinRAR here! PeaZip
The archive zip application is a compression program that compresses the content into a small version of the original plain text content so that it can be sent over the Web easily and faster. It compresses the content and decompresses (or extracts) that same content once you extract it. Think of the archive zip program as a plastic zip bag that you put food in it and then seal it to protect the food from spoiling.
Once you've downloaded your favorite archive zip application, you need to install it as you normally would with any other applications by following the installation instruction. It shouldn't be that hard to install the archive zip application. You can install it in any directory of your choosing and it doesn't need to be in a particular directory at all.
Just make sure that you say "yes" when it prompts (you) if you want the installation program to create an icon in the desktop for that particular archive zip application. If you said "yes," it will create an icon for that archive zip application and it will put that icon on your desktop pane. Self-explanatory!
Actually, you don't even need to have the icon shown on your desktop pane unless you need to open it to create an archive zip application to put your files in to send your files to the server. In that case, you definitely need to have an icon shown on your desktop pane.
So basically, after you'd installed your favorite archive zip on your laptop/desktop you can use it to extract your downloaded text editor that came inside the zip archive by clicking on your "raw zipped" downloaded favorite text editor.
Remember that all downloaded applications come inside an archive compression zip application -- it is totally zipped or compressed. So you need to extract/uncompress the downloaded text editor, which came inside the archive compression zip application.
Just clicking on the "raw zipped" downloaded text editor in raw format and it will open up (automatically) the archive zip application that you had installed on your computer. You see, this is why you don't need to create an icon on your computer pane because you don't need to click it to open it. It opens the archive zip application automatically every time you click on the "raw zipped" downloaded application.
Say you just downloaded a text editor called MAX's HTML Beauty++ and all you have to do is double click on that downloaded apllication and it will automatically open up your favorite zip archive application and extract your downloaded text editor for you without you having to find your zip archive application icon to double it and open it. It opens automatically for you once you double click on the downdloaded text editor.
Once it opens up the archive zip application it should show that your text editor is inside the archive zip application. In that archive zip screen, it shows a lot of options you can do, such as "create archive" for creating archive zip application packages, and "extract" option, which is to extract the (current) downloaded application. Follow the on-screen instruction and you'll be fine! It is very easy to use archive zip applications.If for some reasons you need to send files to the server, you can open the archive zip application by just clicking on the icon shown on your computer pane and it will open the archive zip application for you to use. This is why you need to allow the installation program to create an icon on your computer pane so that you can open it and use it easily.
Let's say you have some photos, or any other content for that matter, and you want to send them to a remote server, you can put those photos/content/files in an archive zip application and send them to your remote server or any server you have accessed to. And then create a link to that archive zip file name and your users will be able to download those content from your website.
Once your users downloaded the photo content they can decompress (or extract) that photo content from the archive zip application to be viewed at their own leisure.
For example, say you have a bunch of photos and you want to create an archive zip application by opening the archive zip application and then clicking on "create archive" or for some archive applications just say "create", and it will open a screen to allow you to create the archive zip application. From there, just follow the on-screen instructions and you'll be fine.
Among the instructions is that it asks for a file name for the archive zip application you're creating; for example, you can name it as "myphoto" without any extension and it will create an empty archive zip application without any content in it.
From there, you can put your photos/content inside that newly created archive zip application by copy and paste them or if the photos/content/files are on the computer pane, you can drag and drop them easily. It is very easy to create and move content into the archive zip applications.
Now you have your photos/content/files inside your newly created archive zip application with a file name for that archive zip application and ready to go. Next, you can upload the entire newly created archive zip application to your server so that your users can download them.
To allow your users to download them, you need to create a link to that particular archive zip application that you just uploaded to your server. For example, say you upload your archive zip application to your website, which has a directory called "download," you can create a link somewhere on your website page like this:
<a href="http://www.mywebsite.com/download/myphoto.zip">download my photos!</a>. That is it!Pay special attention to the extension, which in the above case, it is a "
.zip" extension. So you need to specify the exact extension in order for it to work. Different archive compression applications have different extensions and they are named accordingly in a variety of extensions, i.e.,.zip,.ar,.rar,.pea, etc. Check your particular archive compression applications for the extension they use.The process just described is how you allow your users to download anything from your website -- the same sort of thing you see other websites allow their users to download some content from their websites.
Well, the first step is a little too lengthy than I would have liked but I just wanted to be very clear and precise to help you along!
Next, you'll need a local webhost to build and test your applications offline -- that is, you're using a fake web server to build and test your web applications offline on your computer without having to rent a live "real" web server. Once you've built and tested your web applications offline, you can decide to get a real web server to host your web applications online so that your website can be viewed by people all over the world.
As a matter of fact, most experienced programmers, including myself, use "fake" server to build and test applications on a daily basis. So I strongly recommend beginning programmers to do the same and use localhost to build and test your web applications. Once you finished building and testing your applications and then you can find a real web server to host your websites. Google around using phrases like this: "free webhosting services" to find a real web hosting service provider to host your websites. There are lots of them out there.
Check out my other tutorial at the bottom of this page titled: 'Migrating your website to a real live server' for a free web hosting service provider that I found on the Internet when I Googled around using phrases like this: "free web hosting services".
That free web hosting service provider that I found is one of the best free web hostings out there. I used that free web hosting to host one of my websites as well. You, too, can signup for a free web hosting account with them and use it to host your website just like I do.
Please DO NOT use free web hosting to build and test your web applications because it slows down other people using the same host. All free web hostings are shared hosting: meaning all users of the shared hosting are routed through the same bandwidth and if lots of people use their live hosting to build and test their web applications, it slows down the shared hosting traffic.
So please use your localhost to build and test your web applications.To get a "fake" web server, usually called localhost, you can search the web using a term like "localhost webserver", or you can Google a specific term like "WAMP server", "XAMPP server", "MAMP server", "VAGRANT server", or DOCKER.i.
Once you've identified which one you want, go ahead and download and then install it on your local machine, preferably on your laptop/desktop. You can choose to install it in any location on your desktop/laptop and it doesn't matter; however, for ease of use, choose the default setting shown on the installation prompts.
Once you've installed your localhost web server, you're ready to build and test your web applications just like if you had rented a real live web server from a hosting vendor. The only difference is that your "fake" web server is locally run and is not visible on the web like a real web server does. Most of the instructions on the web are self-explanatory and are very easy to follow even for beginners who never know how to program a single program. You can check out Youtube.com on tutorials on these topics as well.
Here is a very brief tutorial on how to download and install a localhost called WAMP server.
First off, for all beginners, it is essential to understand the purpose of using WAMP and the significance of WAMP. Basically, WAMP stands for Windows (operating system), Apache (web server), MySQL (database), and PHP programming language: all bundled into a single platform called WAMP.Once you've installed a WAMP local host web server, all the required applications, such as the Apache (web server), MySQL (database), PHP programming language, and as well as the PHPmyAdmin (a MySQL application), are all bundled and installed completely into your local laptop/desktop to work with each other seamlessly.
In WAMP, you can work with databases using MySQL to store and retrieve data, as well as using PHP programming language to program your web applications. WAMP is not restricted to just PHP, however -- you can use other languages as well.
WAMP is a popular alternative of XAMPP for Windows. However, you can use XAMPP as well and it doesn't take much time to install XAMPP either. But developers may prefer to use WAMP since it is specifically crafted for Windows only -- unlike, XAMPP, which can be used for Linux and Mac OS as well.
However, both platforms are equally stable and provide the same functionality.
So you can choose any platform amongst the two to fulfill your objective. But all those who are searching for guidance on how to install WAMP on Windows system should follow the below-given steps. So let's get going!!
How to Install WAMP on Windows
Download the WAMP Server: Wampserver 64 bit x64
You want to choose a 64 bit version. The 32 bit is for older computers or laptops, which is outdated in today's programming world. If you're using computers that is still using a 32 bit, by all mean choose 32 bit version. To check what version your computer is running on, go to the status bar at the lower left corner of your computer screen and type in the search box: control panel and press enter.
The "Control Panel" screen should pop up. In that screen, look for a section called "System and Security" or "System and Maintenance" or anything that has a word "System" on it. For Windows 7, 8, 10, it should says "System and Security." Click on that topic and a "System and Security" screen should pop up.
Next, look for the topic "System" and click on that topic and a "System" screen should pop up. In that screen under the "System" section it lists the "System type" which should say a "64-bit Operating System or 32-bit Operating System, depending on your computer. If it says "64-bit Operating System, your computer is running on a 64-bit operating system. "32-bit Operating System", otherwise.
Initiate WAMP Server Installation Process. I'm being lazy and for the rest of the installation instructions, I will refer to an excellent instruction on the web: here it is: click here!
In that instruction, be careful in step 2. WAMP server looks for a version of Microsoft Visual C++ re-distributable package already installed on your laptop/desktop. Most of the laptops/desktops come with a Microsoft VC++ re-distributable package already pre-installed, so you don't have to do anything. However, for some odd reasons, some laptops/desktops came without that Microsoft Visual C++ re-distributable package pre-installed.
In that case, you might have to search the web for "Microsoft Visual C++ re-distributable package" and download it and install it using default settings contains in its installation application. When you install Microsoft Visual C++, it is very easy and self-explanatory, the same way you install a WAMP server -- they both are self-explanatory, allowing you to just use default settings.
FYI: If you look in the "Control Panel" screen mentioned earlier, it should shows Microsoft Visual C++ installed already; and in that case, WAMP server will find it and use it to complete the installation process, and thus, you don't need to do anything on your part, sparring you from having to search the web.
Once you get through the Microsoft Visual C++ re-distributable package installation process and proceeds to the end of the installation process, the last thing the WAMP server installation guide will prompt you to do is, to enter/choose a text editor. You can accept a default text editor in the prompt or choose your favorite text editor to use with your newly installed WAMP server. It looks something like this:
It's okay one way or another as it is not very significant if you do not choose a particular text editor or not as a default text editor for the WAMP server to use. It won't effect/harm your WAMP server at all. For beginners, I suggest that you choose the default text editor chosen by the installation.
However, I strongly recommend you just select a text editor of your choice or just leave it as a default text editor that the WAMP server chooses, which is a Microsoft notepad. In other words, by choosing a particular text editor doesn't restrict you from using other text editors with your WAMP server.
It also will prompt you to enter/choose a default web browser to use with your newly installed WAMP server. Likewise, by choosing a particular web browser doesn't restrict you from using other web browser with your WAMP server either. So it looks something like this:
Once you've finished the installation process, you can use the "fake" web server to build and test your web applications offline as you normally would with a "live" real web server. To start, click on the arrow or status icon usually on the lower right corner of your laptop/desktop screen to activate the tap that shows the "fake" web server options listing.
Note: From time to time, if you're using Windows operating system, Windows operating system usually runs updates to update its software drivers and the rest of its system files automatically and periodically. If you're using Windows OS, you may have experienced this update many times already and it's kind of annoying as well, but it's a necessary task for Windows OS, according to Microsoft.
One of the annoying things that this update causes is that it causes the WAMP server to not function properly once the update is completed.
If you experienced this and having issues with your WAMP server to not function properly, just un-install your WAMP server completely from your system and then re-install it again and it should work properly.
Yes, it is very annoying having to un-install and re-install your WAMP server every time a Windows operating system runs its update.
Make sure that you move all of your "projects" in the "www" directory to a different location (or directory) before un-installing your WAMP server; because if you don't, it will delete all of your projects in the "www" directory.
Let's continue on:
It should show an icon that looks something like below with a status icon that usually appears on the lower right corner of your laptop/desktop screen, but with a particular color on it. A green color (as shown below) signifies as the wampserver is ready to use; a grey or pink color, it is not activated; a yellow, it is partially ready and in the process of being ready as it is finishing the loading process.
So in essence, every time you start/load or turn on your wampserver, it goes through a series of steps to initialize the wampserver, showing the colors of its readiness from grey to pink to yellow to green. Green means the wampserver is ready for usage.
If it is inactive, all you have to do to fire up your wampserver is to double click on the default icon on your laptop pane that looks something like below:

Usually, when you turn off your laptop, WAMP server is also turned off and no longer active and the green status icon you see above is not shown. When it is turned off, the status icon that usually appears on the lower right corner of your laptop/desktop screen doesn't show the WAMP server icon because it is not activated.
To activate it or turn on your WAMP server, double click on the default icon on your laptop pane to get it activated.
Once your "fake" server is up and running, you can do pretty much just about anything you do with a "live" server. You can click on the arrow next to the green status icon to reveal other options, such as a PHP icon to see what version of PHP is installed on your "fake" server; as well as clicking on PHPmyAdmin to work with database.
Note that PHPmyAdmin in your "fake" server doesn't require you to enter a password, although you can if you want -- but why bother to complicate yourself in having to enter a password every time you try to access your PHPmyAdmin? So just enter 'root' for the username and don't enter a password on the password field. Leave it blank as it is!
Just click "Go" without entering a password and it will open the PHPmyAdmin panel for you.
In the PHPmyAdmin, you can create databases and tables and do pretty much just about anything about database programming.
As stated above, when a localhost is up and running the status icon usually appears on the lower right corner of your laptop/desktop screen. Click on the arrow to reveal the the localhost options. In this option window, you can find a lot of options to choose from, such as PHPmyAdmin, just to name one.
You can click on the particular option to work with it. For example, among the options there is a "localhost" option. Click on that "localhost" option and it will open up a screen that looks something like the following:
As you can see, it shows the configuration status of the localhost such as what version of various entities: Apache, PHP, MySQL, etc. Most of them are really not useful for beginners. Experienced programmers can make use some of these configurations.
The diagram above combines with the one listed below is what it should looks like inside a real server. This localhost web server mimmicks what a real server looks like but on an offline mode.
The localhost also contains a section in the lower half that lists content that is more relevant to beginning users of Wampserver, such as tools and your actual projects that you had created. For example, below it lists three projects that I've created: advanced, framework, noon2noon.com:
If you click on one of the projects it will execute/load the project. For example, if I click on the project called
noon2noon.comit will load and display my website callednoon2noon.com.However, you can load your website on the browser's url bar as well, the same way you normally would with your regular "live" server. That is the typical usage of localhost: you don't need to load your website through localhost option window, but instead, through a normal loading process in the browser's url bar.
You should try to create a very simple website and click on it in the project section to see what it looks like on your "fake" server. When you create your projects, place them in a directory where you installed your Wampserver. For example, in my case, I installed my Wampserver in a directory that looks like the following:
As you can see, my root directory is called "Desktop" followed by a directory that I named it as "wamp64" followed by a directory called "www." This directory called "www" is created automatically by the installation, so you really don't have to create it yourself. The only directory that you need to create and specify during the Wampserver installation is the "wamp64" part or whatever name you choose. I chose to name it "wamp64."
Any projects you build have to be placed inside the "www" directory in order to be visible by your localhost. For example, in my case, I placed my projects in that "www" directory and inside my project
noon2noon.comit contains content that looks like the following:
One particular content worths mentioning is the index.php file. This is the main starting script file that the server/localhost calls first thing when you try to load the website by typing in your url bar like
http://www.noon2noon.com. However, that is for your real live web server when you migrate your website to a real web server.But for this tutorial, you're using a fake server called localhost; and therefore, you have to type in the browser bar using localhost instead of www.
So you can simply replace the domain specification 'www' with 'localhost' and just type the name of the folder following it as, in my case,
http://localhost/noon2noon.comor simply just localhost/noon2noon.comand it will load the website automatically.For my project advanced, which its inside content looks similar to my other two projects framework and noon2noon.com, I can just do the same like this
http://localhost/advanced, and likewise for the other onehttp://localhost/framework, and both websites will load automatically.Notice that you can include an
index.phporindex.htmlfile as well since it doesn't require you to specify an extension of either a.phpor a.htmland it will work just fine. For examples:http://localhost/noon2noon.com/index,http://localhost/advanced/index,http://localhost/framework/index, and all websites will load automatically.Please note that when you migrate your websites to a real web server, you have to abide by your web hosting's rule, which tells you what kind of an extension of either a
.phpor an.htmlthat their server is using. If they're using a.phpextension, you'll have to rename yourindexfile with that extension. Likewise, if they're using an.htmlextension, you'll have to rename yourindexfile extension as such.For a
localhost, it doesn't matter. It will read from either.phpextension or.htmlfile extension.For starter, in your case, just create an
index.phporindex.htmlfile and throw it in a folder and place that folder inside the "www" directory and typehttp://localhost/ follows by your folder name in the url browser bar to see your website comes alive. Try it!If your website doesn't come alive and showing a weird screen that looks like the following, it means that for some reason the localhost cannot read your index file. Or it means that the route in the url bar that you typed is incorrect. The localhost can't find the file contains in the route that you typed in the url bar:
As you can see, there is no index file listed in the main folder. I deleted it on purpose and the localhost can't find the file contains in the route that I typed in the url bar.
Localhost server is very vague in their error messaging system and that's a source of frustation for a lot of new programmers.
Remember that each website has to have only one index file as a main starting application file. So make sure that you have a functional index file and it has to be only one index file. No index.php and index.html at the same location vying as the main starting application file.
Once you are finished building and testing, you can migrate your projects to your live real web hosting server. For example, in my case, I just take the folder containing the particular project, i.e., noon2noon.com folder, and upload the entire folder to my real live server. That's how you get started in developing website applications.
For starter, you can create a folder and name it and then create an
index.phporindex.htmlfile as well as other files/folders and put them inside that folder that you just created which contains other files/folders as well and upload the entire folder using FileZilla. See my other tutorial on how to use FileZilla.That is it! Very simple to have your own "fake" server. And from here, the possiblities are endless! Have fun programming!
Building a Website for Beginners
For beginners, building a website is a daunting task, even for very simple websites that don't have ordinary bells and whistles and are still very challenging to say the least. Fortunately, the folks at the W3Schools.com provide all sort of examples and ready-made web site templates to help beginners get started.
Let's take a look at one template and illustrate how you (beginners) can build your own web site using the ready-made template and customize it to suite your taste.
First go to https://www.w3schools.com/w3css/w3css_downloads.asp and download the css definition (or file) and place it in a folder called css. The default file name is w3.css. You can rename the css file if you like, say css.css or style.css. If you do, don't forget to change the css file name accordingly in your index.php file at the css area at the top of the index.php file to reflect the change in the css file name.
Next, in the same page where you're downloading the css, look on the left side under the category name Examples and try to find a topic name called W3.CSS Templates. Or you can go to https://www.w3schools.com/w3css/w3css_templates.asp
You can scroll down to see the various templates available to use. Pick one and go from there!
If the templates mentioned in the above link is not enough for your tastes, you can find more templates to use right here!
Once you decided which one you want to use, go ahead and click on the "Try it Yourself" button to see the actual code.
Next, copy the actual code, character by character, without missing any character. In other words, no typos in your part or else your web site won't look as intended. If your web site doesn't look like it is intended, try to go back and see if you had any typos in your copied code.
The folks at W3Schools.com used some sort of techniques, such as disabling the "hot link" ability, to disable the copy and paste ability from the web browser. So you can't actually use your web browser to copy and paste the code shown in the templates. You'll have to use advanced editors or tools to copy and paste the code in the templates.
For beginners, advanced tools are out of reach, so just try to copy it manually by hand character by character until you completely copied everything in the template. Yes, it is a pain, but that is what you have to do to learn. Name that template as either index.php or index.html. This is your main index file -- or your main web site file.
Once you have the css file downloaded as well as the template copied and name it as either index.php or index.html, then you need to create a main folder as well as a css folder.
Next, create another folder called image and put all the images/photos that you want to use in your website in that image folder.
You can name them whatever names you like for any folders you create, i.e., MyWebsite, MyFirstProject (for the main folder), css, style (for the css folder), image (for the image folder), etc.
You need to put the index.php or index.html as well as the css folder and the image folder in the main folder. The css file containing the css definitions should be inside the css folder, while the image folder contains all images you need to use. Self-explanatory!.
So your main folder contains everything you need. So you need to put everything in this main folder, including other folders as well such as css, image, etc. The index file should be among the css and image folders as peers at the same level.
That's all you need for this simple website. Three folders: main folder (i.e., MyWebsite or MyFirstProject, or whatever), css folder, and image folder. Plus the index.php/index.html and all three are peers -- meaning they are at the same level in directory. For example:
Of course, you can have more folders and other contents as well as your website gets sophisticated, but for this simple website the three items are all you need for now.
As you can see, I put my main folder called MyWebSite inside the www localhost folder for building and testing web applications. The index.php file contains the content listed below and the actual rendering page content is shown in the following.
Let's see one particular template called "Social Media Template" taken from W3Schools.com website in the W3.CSS Templates category, but I customized it slightly. Here it is:
Here is the actual code along with the commented out code that contained in the original template shown in the W3Schools.com:
File: index.php
<!-- all HTML document start with a !doctype -->
<!-- it is a Document Type declaration to tell the web browser of -->
<!-- what version of the HTML markup language in which a web page -->
<!-- is written. -->
<!-- every time a browser reads a document such as an HTML document it -->
<!-- needs to know what version the HTML markup language is written in -->
<!-- so that it can parse it correctly. -->
<!DOCTYPE html>
<html>
<head>
<title>Template</title>
<!-- a meta (<meta>) tag provides metadata information about -->
<!-- the HTML document. -->
<!-- a metadata information will not be displayed on the page, -->
<!-- but will be machine/browser parsable. -->
<!-- metadata elements are typically used to specify page description, -->
<!-- keywords, author of the document, last modified, and other metadata. -->
<!-- you put metadata in <meta> tags-->
<!-- meta (<meta>) tags are documents for the browsers to read and -->
<!-- used the meta content, for example, you can specify a view port -->
<!-- device dimension such as width. -->
<!-- the word "meta" means self or itself, referring to itself or -->
<!-- a self-referential. -->
<!-- so a self-referential. -->
<!-- meta tags can contain attributes, i.e., name and content. -->
<!-- the two most frequently used in a meta tag are name and content -->
<meta charset="UTF-8">
<meta name="viewport" content="width=device-width, initial-scale=1">
<!-- the following link is the css link stored in folder named css -->
<link rel="stylesheet" href="./css/mobile.css">
<!-- the following two links were broken down to fit the screen display -->
<!-- these two links are specialized css stored in cloudflare.com -->
<!-- you only need to incude these links if you use awesome fonds and -->
<!-- bootsrap code like form input boxes, textarea, and dialog boxes -->
<!-- you can check out bootstrap tutorials on W3Schools as well! -->
<link rel="stylesheet"
href="https://cdnjs.cloudflare.com/ajax/libs/font-awesome/4.6.3/
css/font-awesome.min.css">
<link rel="stylesheet"
href="http://cdnjs.cloudflare.com/ajax/libs/twitter-bootstrap/
3.2.0/css/bootstrap.min.css">
<!-- the following three lines link to jquery, bootstrap, and -->
<!-- my own Javascript files -->
<script src="https://code.jquery.com/w3/1.4.5/jquery.w3-1.4.5.min.js">
</script>
<script type="text/javascript" src="js/bootstrap.min.js"></script>
<script type="text/javascript" src="javascript/javascript.js"></script>
</head>
<!-- this is the start of the web site body -->
<!-- the 'class' attribute specifies the css that this body uses to -->
<!-- beautify itself -->
<!-- disregard the theme class, but make use of the color class -->
<!-- this is where you set your body background color, light grey, in this -->
<!-- case! -->
<!-- check out the list of pre-made colors at the bottom of this listing -->
<!-- in this body is where you also set your text size using w3-tiny -->
<!-- w3-small, w3-medium, w3-large, w3-xlarge, w3-xxlarge, -->
<!-- w3-xxxlarge, w3-jumbo -->
<!-- as you use W3Schools templates, you can put multiple css classes in an
element, i.e., <body>, <div>, <span>, <p>, <a>, <button>, <img>, etc. -->
<body class="w3-theme-l5 w3-light-grey">
<!-- some of the following codes were broken down into multiple lines -->
<!-- to fit the screen display -->
<!-- Navbar -->
<!-- this is the div that wraps around the navbar -->
<div class="w3-top">
<!-- in the navbar you can style the look-and-feel using css classes. -->
<!-- for example, you can make the navbar thicker or thiner by specifying -->
<!-- the class as w3-padding-tiny, w3-padding-small, -->
<!-- w3-padding-large, etc. -->
<!-- in the example site illustrated above I style the navbar as w3-blue! -->
<div class="w3-bar w3-theme-d2 w3-left-align w3-small w3-blue">
<a class="w3-bar-item w3-button w3-hide-medium w3-hide-large w3-right
w3-padding-small w3-hover-white w3-small w3-theme-d2"
href="javascript:void(0);" onclick="openNav()">
<i class="fa fa-bars"></i></a>
<!-- notice that the anchor tags contain "#" used in place ---->
<!-- of the actual url that you need to provide! ---->
<!-- the "#" is just a placeholder for the real url! ---->
<!-- so don't forget to replace "#" with the actual url! ---->
<!-- for example: "http://www.example.com/homefolder/myfile.php" ---->
<a href="#" class="w3-bar-item w3-button w3-padding-large w3-theme-d4">
<i class="fa fa-home w3-margin-right"></i>Logo</a>
<a href="#" class="w3-bar-item w3-button w3-hide-small w3-padding-large
w3-hover-white" title="News"><i class="fa fa-globe"></i></a>
<a href="#" class="w3-bar-item w3-button w3-hide-small w3-padding-large
w3-hover-white" title="Account Settings"><i class="fa fa-user"></i></a>
<a href="#" class="w3-bar-item w3-button w3-hide-small w3-padding-large
w3-hover-white" title="Messages"><i class="fa fa-envelope"></i>
<div class="w3-dropdown-hover w3-hide-small">
<button class="w3-button w3-padding-large" title="Notifications">
<i class="fa fa-bell"></i>
<span class="w3-badge w3-right w3-small w3-green">3</span>
</button>
<!-- here is again the use of "#" as a placeholder for the real url! ---->
<div class="w3-dropdown-content w3-card-4 w3-bar-block"
style="width:300px">
<a href="#" class="w3-bar-item w3-button">One new friend request</a>
<a href="#" class="w3-bar-item w3-button">John Doe posted on
your wall</a>
<a href="#" class="w3-bar-item w3-button">Jane likes your post</a>
</div>
</div>
<a href="#" class="w3-bar-item w3-button w3-hide-small w3-right
w3-padding-medium w3-hover-white" title="My Account">
<img src="./image/paul_tuon.jpg" class="w3-circle"
style="height:23px;width:23px" alt="Avatar"> </a>
</div>
</div> <!-- end div class="w3-top" -->
<!-- the following code block is the code that gets used instead of the -->
<!-- above navbar when a mobile device is used to load -->
<!-- this web site -->
<!-- Navbar on small screens -->
<!-- here is again the use of "#" as a placeholder for the real url! ---->
<div id="navDemo" class="w3-bar-block w3-theme-d2 w3-hide
w3-hide-large w3-hide-medium w3-large">
<a href="#" class="w3-bar-item w3-button w3-padding-large">Link 1</a>
<a href="#" class="w3-bar-item w3-button w3-padding-large">Link 2</a>
<a href="#" class="w3-bar-item w3-button w3-padding-large">Link 3</a>
<a href="#" class="w3-bar-item w3-button w3-padding-large">My Profile</a>
</div>
<!-- now the navbar code is done! -->
<!-- at this point there are 0 open <div> tag -->
<!-- Page Container -->
<!-- remember that there are typically four sections in a web site: -->
<!-- the head section, the navbar section, the main body content, -->
<!-- and the footer -->
<!-- so the following is the start of the main content of the web site, -->
<!-- and this section is the biggest section. -->
<!-- this main container has a maximum width of 1400 pixels -->
<!-- and spaces between the navbar and the start of the main -->
<!-- container or content is 80 pixels. -->
<!-- take a look at the gap in the web site above for a visual guide! -->
<!-- for a better practice is to use percentage as in 100% -->
<!-- of the screen width rather than specifying the exact width! -->
<!-- that way it works much better on different screen sizes! -->
<!-- pay special attention to one class: w3-container -->
<!-- 'container' is sort of a basket to hold something, in this case, -->
<!-- it holds a grid of column layout -->
<!-- in a later case, it holds a (small) profile container area! -->
<!-- as you can see, class w3-container can be used inside -->
<!-- another container area as well -->
<!-- in this case, this w3-container class acts as the main content -->
<!-- holder, holding everything in the body of the entire page! -->
<!-- remember that the whole website has four sections: navbar section, -->
<!-- head section, the main body section, and the footer section! -->
<!-- so this div has a w3-container class to hold the entire content -->
<!-- and this entire content is actually the 3-column layout grid! -->
<div class="w3-container w3-content" style="max-width:1400px; margin-top:80px">
<!-- The Grid -->
<!-- W3Schools provides grid system for us to use! -->
<!-- for a complete in depth tutorial see W3Schools on this topic! -->
<!-- pay special attention to a class called w3-row -->
<!-- so two classes that are central to W3Schools framework are -->
<!-- w3-container and w3-row -->
<!-- you'll make use of these two classes very often! -->
<!-- basically, the grid must be inside the container: w3-container! -->
<!-- and the container, w3-container, can contain rows of content! -->
<!-- this grid starts with a class w3-row -->
<!-- this is sort of the anchor div to hold the entire grid or one row! -->
<!-- class w3-row is a grid system. think of w3-row as a table row where -->
<!-- you can arrange grid data content in it. so if you have data content -->
<!-- that are normally arranged in rows in a table, you can use this -->
<!-- w3-row to hold those data content in table rows-like display! -->
<!-- however, in this website we have only one row of a table row! -->
<!-- if we have more data content that needs another table row, all we -->
<!-- have to do is create another div containing this w3-row class and -->
<!-- put it after the closing of this div shown below! -->
<!-- see the closing of this div later! -->
<!-- if you look at the website illustrated above, you'll see the -->
<!-- whole content body is inside a div that contains the class w3-row. -->
<!-- this is one row of content containing a three-column layout. -->
<!-- after the closing of this div w3-row, you can create more rows -->
<!-- of content by creating more divs that contain the class w3-row. -->
<!-- for each div that contains w3-row you can format your grid layout -->
<!-- any way you like, say, a four-column layout or whatever layout -->
<!-- configuration you desire! -->
<!-- here is the row! -->
<div class="w3-row">
<!-- here is inside the row! -->
<!-- now inside the anchor div or more specifically, -->
<!-- the w3-row (or grid) there are columns layout: a one-column -->
<!-- display, a two-column display, a three-column display, etc. -->
<!-- in this case, we have a three-column layout web site! -->
<!-- Left Column -->
<!-- this is the left column in the web site: see profile area column! -->
<!-- m3 is short for medium 3 out of 12 columns: 3-twelfth of the grid -->
<!-- W3Schools uses three sizes: small (s), medium (m), large (l) -->
<!-- so if you see s1 means a small scale grid with one-twelfth of -->
<!-- the grid. m7 is a medium scale layout with 7/12 of the total -->
<!-- grid layout. -->
<!-- likewise, an l2 (that is "L" and 2) means 1arge scale layout-->
<!-- with a two-twelfth of the total grid layout! -->
<!-- here, we have a medium scale with 3/12th of the total grid layout -->
<!-- as you can see, this left column has a class w3-container to hold -->
<!-- the entire left side area! -->
<!-- as stated above, class w3-container can be used inside this -->
<!-- container area as well! sort of containers within container! -->
<div class="w3-col m3 w3-container">
<!-- Profile -->
<!-- w3-card is a class to make the profile looks like a deck -->
<!-- of cards, w3-round will make the deck of cards rounded -->
<!-- edges on all 4 corners -->
<div class="w3-card w3-round w3-light-blue">
<!-- here is where class w3-container gets used to hold-->
<!-- a profile area -->
<div class="w3-container">
<h4 class="w3-center">My Profile</h4>
<p class="w3-center"><img src="./image/paul_tuon.jpg"
class="w3-circle" style="height:106px;width:106px"
alt="A Profile Picture"></p>
<hr>
<p><i class="fa fa-pencil fa-fw w3-margin-right
w3-text-theme"></i> Designer, UI</p>
<p><i class="fa fa-home fa-fw w3-margin-right
w3-text-theme"></i> Minneapolis, MN (US)</p>
<p><i class="fa fa-birthday-cake fa-fw w3-margin-right
w3-text-theme"></i> April 1, 2020</p>
</div>
</div>
<br>
<!-- Accordion -->
<!-- this block of code contains an accordion-like feature -->
<!-- when a user clicks on an item it slides down to reveal the content! -->
<!-- class w3-card is a css that made to look like a deck of cards -->
<div class="w3-card w3-round">
<div class="w3-pale-blue">
<!-- when a user clicks on "My Groups" it calls myFunction() -->
<!-- and it displays an accordion style revealing the content -->
<!-- you might want to experiment using other elements such -->
<!-- as div or span or other elements instead of button! -->
<button onclick="myFunction('Demo1')" class="w3-button
w3-block w3-theme-l1 w3-left-align">
<i class="fa fa-circle-onotch fa-fw w3-margin-right">
My Groups</i></button>
<!-- here is again w3-container gets used! -->
<!-- note that w3-hide hides the content inside the -->
<!-- div when the page is loaded! -->
<!-- it will only reveal the content when a user clicks -->
<!-- on "My Groups"! -->
<div id="Demo1" class="w3-hide w3-container">
<p>Some text..</p>
</div>
<!-- when a user clicks on "My Events" it calls myFunction() -->
<!-- and it displays an accordion style calendar of events -->
<!-- by sliding down to reveal the content -->
<!-- you might want to experiment using other elements such -->
<!-- as div or span or other elements instead of button! -->
<!-- right here where you might want to place a break: "<br>" -->
<!-- to make the gap between the two accordion item elements! -->
<!-- so instead of using "<br>" you might want to use -->
<!-- css styling to specify how much gap you want because -->
<!-- "<br>" might be bigger/smaller gap than you like! -->
<!-- so using css to style the gap is probably a good idea! -->
<button onclick="myFunction('Demo2')" class="w3-button w3-block
w3-theme-l1 w3-left-align"><i class="fa fa-calendar-check-0
fa-fw w3-margin-right"> My Events</i></button>
<!-- here is again w3-container gets used! -->
<!-- again w3-hide hides the content inside the -->
<!-- div when the page is loaded! -->
<!-- it will only reveal the content when a user clicks -->
<!-- on "My Events"! -->
<div id="Demo2" class="w3-hide w3-container">
<p>Some other text..</p>
</div>
<!-- likewise, when a user clicks on "My Photos" it calls -->
<!-- myFunction() and it displays an accordion style album -->
<!-- of photos by sliding down to reveal the photos in a -->
<!-- two-column layout -->
<!-- if you provide photos in the below container: a photo -->
<!-- album container, it will display them when a user -->
<!-- clicks on "My Photos" -->
<!-- you might want to experiment using other elements such -->
<!-- as div or span or other elements instead of button! -->
<!-- right here where you might want to place a break: "<br>" -->
<!-- to make the gap between the two accordion item elements! -->
<!-- so instead of using "<br>" you might want to use -->
<!-- css styling to specify how much gap you want because -->
<!-- "<br>" might be bigger/smaller gap than you like! -->
<!-- so using css to style the gap is probably a good idea! -->
<button onclick="myFunction('Demo3')" class="w3-button
w3-block w3-theme-l1 w3-left-align">
<i class="fa fa-user fa-fw w3-margin-right"> My Photos
</i></button>
<!-- class w3-container is used to hold the photos album layout -->
<!-- w3-hide is a class to hide the element: diplay: none -->
<!-- as you can see, when the web site is loaded, "Demo3" is -->
<!-- not shown! -->
<!-- it will only be shown when a user clicks on -->
<!-- "My Photos" button! -->
<div id="Demo3" class="w3-hide w3-container">
<div class="w3-row-padding">
<br>
<!-- the following is where you put your photo album! -->
<!-- class w3-half is a grid layout as a two-column -->
<!-- layout relative to the class w3-container used -->
<!-- in the album layout so the photos are arranged -->
<!-- side by side as a two-column layout -->
<!-- inside the div or img tags you can embedd inline css to style your layout: width, height, etc. -->
<!-- for example: <div class="w3-half" style="width: 100px; height: 50px"> ... </div> -->
<div class="w3-half">
<img src="./image/paul_tuon.jpg" style="width: 100%; height: 50%"
class="w3-margin-bottom">
</div>
<div class="w3-half" style="width: 200px; height: 150px">
<img src="./image/graduation.jpg"
class="w3-margin-bottom">
</div>
<!-- this is another two-column grid stacking below the above photos -->
<div class="w3-half">
<img src="./image/paul_tuon.jpg" style="width: 100%"
class="w3-margin-bottom">
</div>
<div class="w3-half">
<img src="./image/graduation.jpg" style="width: 100%"
class="w3-margin-bottom">
</div>
<!-- this is another two-column grid stacking below the above photos -->
<div class="w3-half">
<img src="image/example5.jpg" style="width: 100%"
class="w3-margin-bottom">
</div>
<div class="w3-half">
<img src="image/graduation.jpg" style="width: 100%"
class="w3-margin-bottom">
</div>
</div> <!-- end div class="w3-row-padding" -->
</div> <!-- end div id="Demo3" -->
</div> <!-- end div class="w3-white" -->
</div> <!-- end div class="w3-card w3-round" -->
<!-- this is the end of an accordion-like feature! -->
<!-- at this point there are still 3 open div -->
<!-- Interest: the miscellaneous content of interest! -->
<!-- w3-hide-small is to not display the content when mobile -->
<!-- device is used to load the web site! so "Interests" content -->
<!-- won't be loaded if mobile device is being used to load -->
<!-- this web site -->
<div class="w3-card w3-round w3-teal w3-hide-small">
<div class="w3-container">
<p>Interests</p>
<p>
<span class="w3-tag w3-small w3-theme-d5">News</span>
<span class="w3-tag w3-small w3-theme-d4">W3Schools</span>
<span class="w3-tag w3-small w3-theme-d3">Labels</span>
<span class="w3-tag w3-small w3-theme-d2">Games</span>
<span class="w3-tag w3-small w3-theme-d1">Friends</span>
<span class="w3-tag w3-small w3-theme">Games</span>
<span class="w3-tag w3-small w3-theme-l1">Friends</span>
<span class="w3-tag w3-small w3-theme-l2">Food</span>
<span class="w3-tag w3-small w3-theme-l3">Design</span>
<span class="w3-tag w3-small w3-theme-l4">Art</span>
<span class="w3-tag w3-small w3-theme-l5">Photos</span>
</p>
</div>
</div>
The following block of code contained in the original template
<!-- Alert box -->
<!-- when a user clicks on this div area an alert box pops up -->
<!--
<div class="w3-container w3-display-container w3-round w3-theme-14
w3-border w3-theme-border w3-margin-bottom w3-hide-small w3-red">
<span onclick="this.parentElement.style.display='none'"
class="w3-button w3-theme-13 w3-display-topright">
<i class="fa fa-remove"></i>
</span>
<p><strong>Hey,</strong></p>
<p>People are looking at your profile. Find out who!</p>
</div>
-->
</div> <!-- end left column -->
<!-- at this point there are still 2 open <div> tags -->
<!-- start middle column -->
<!-- this is the start of the middle column. -->
<!-- size m7 means 7/12 of the grid -->
<!-- as you can figure it out: there are 12 columns in the entire grid -->
<!-- if the left side column is m3, meaning 3/12 of the grid, -->
<!-- and middle column is 7/12 of the grid, -->
<!-- the right column has to be 2/12 of the grid! -->
<div class="w3-col m7">
<!-- right here where I add some new content to the middle column -->
<!-- I add a scrolling message board to make it more flashy. for example: -->
<div class="w3-row-padding">
<!-- notice that you need to use the entire length of the grid: m12 -->
<!-- meaning the entire middle column -->
<div class="w3-col m12">
<div class="w3-card-2 w3-round w3-white">
<div class="w3-container w3-padding">
<marquee bgcolor=white width="100%" height="50">
<font size="5" color="#FF66FF">
Welcome to the 21st century and beyond where digital mobile rules!</font>
<font size="5" color="#1883FF">More content to scroll!</font>
</marquee>
</div>
</div>
</div>
</div>
<div class="w3-row-padding">
<div class="w3-col m12">
<div class="w3-card w3-round w3-white">
<div class="w3-container w3-padding">
<h6 class="w3-opacity">Social Media Template</h6>
<p contenteditable="true" class="w3-border
w3-padding">Status: Feeling blue!</p>
<button type="button" class="w3-button w3-theme">
<i class="fa fa-pencil"></i> Post
</button>
</div>
</div>
</div>
</div>
<div class="w3-container w3-card w3-round w3-blue w3-margin">
<img src="./image/paul_tuon.jpg" alt="Avatar" class="w3-left
w3-circle w3-margin-right" style="width:60px">
<span class="w3-right w3-opacity">1 min</span>
<h4>John Doe</h4>
<hr class="w3-clear">
<p>This is just an ordinary content! You can put whatever
content you want!</p>
<div class="w3-row-padding" style="margin:0 -16px">
<!--
<div class="w3-half">
<img src="./image/graduation.jpg" alt="just a picturer"
style="width: 100%" class="w3-margin-bottom">
</div>
<div class="w3-half">
<img src="./image/paul_tuon.jpg" alt="another picture"
style="width: 100%" class="w3-margin-bottom">
</div>
-->
</div>
<button type="button" class="w3-button w3-theme-d1 w3-margin-bottom">
<i class="fa fa-thumbs-up"></i> Like</button>
<button type="button" class="w3-button w3-theme-d2 w3-margin-bottom">
<i class="fa fa-comment"></i> Comment</button>
</div>
<div class="w3-container w3-card w3-round w3-khaki w3-margin"><br>
<!--
<img src="./image/graduation.jpg" alt="Avatar" class="w3-left
w3-circle w3-margin-right" style="width:60px">
-->
<span class="w3-right w3-opacity">16 min</span>
<h4>Jane Doe</h4>
<hr class="w3-clear">
<p>Lorem ipsum dolor. Lorem ipsum dolor. Lorem ipsum dolor.
Lorem ipsum dolor. Lorem ipsum dolor.</p>
<button type="button" class="w3-button w3-theme-d1 w3-margin-bottom">
<i class="fa fa-thumbs-up"></i> Like</button>
<button type="button" class="w3-button w3-theme-d2 w3-margin-bottom">
<i class="fa fa-comment"></i> Comment</button>
</div>
The following block of code contained in the original template
<!--
<div class="w3-container w3-card w3-round w3-lime w3-margin"><br>
<img src="./image/paul_tuon.jpg" alt="Avatar" class="w3-left
w3-circle w3-margin-right" style="width:60px">
<span class="w3-right w3-opacity">30 min</span>
<h4>Angie Jane
<hr class="w3-clear">
<img src="./image/gradution.jpg" class="w3-margin-bottom"
style="width:100%">
<p>Lorem ipsum dolor. Lorem ipsum dolor. Lorem ipsum dolor.
Lorem ipsum dolor. Lorem ipsum dolor.</p>
<button type="button" class="w3-button w3-theme-d1 w3-margin-bottom">
<i class="fa fa-thumbs-up"></i> Like</button>
<button type="button" class="w3-button w3-theme-d2 w3-margin-bottom">
<i class="fa fa-comment"></i> Comment</button>
</div>
-->
<!-- on the left side column there is an accordion slide down/up -->
<!-- feature which contains three sections: My Groups, My Events, -->
<!-- My Photos! you can use that code example to place your -->
<!-- accordion feature anywhere on the website! -->
<!-- let's put that same accordion feature in the middle column at -->
<!-- the very bottom just before the start of the footer! -->
<!-- just remember that each accordion item must contains -->
<!-- a unique id, e.g., group, event, photo! -->
<!-- start accordion style feature! -->
<!-- Accordion -->
<div class="mobile-card mobile-round">
<div class="mobile-pale-blue">
<!-- when a user clicks on "My Groups" it will call -->
<!-- myFunction() and it displays an accordion -->
<!-- style revealing the content -->
<!-- you might want to experiment using other elements such -->
<!-- as div or span or other elements instead of button! -->
<button onclick="myFunction('group')"
class="mobile-button mobile-block mobile-theme-l1
mobile-left-align">
<i class="fa fa-circle-onotch fa-fw
mobile-margin-right"> My Groups</i>
</button>
<div id="group" class="mobile-hide mobile-container">
<p>Some text..</p>
</div>
<!-- when a user clicks on "My Events" it will call -->
<!-- myFunction() and it displays an accordion -->
<!-- style calendar of events by sliding down to -->
<!-- reveal the content! -->
<!-- you might want to experiment using other elements such -->
<!-- as div or span or other elements instead of button! -->
<button onclick="accordion('event')"
class="mobile-button mobile-block mobile-theme-l1
mobile-left-align">
<i class="fa fa-calendar-check-0 fa-fw
mobile-margin-right"> My Events</i>
</button>
<div id="event" class="mobile-hide mobile-container">
<p>Some other text..</p>
<div>
<!-- likewise, when a user clicks on "My Photos" it calls -->
<!-- myFunction() and it displays an accordion style -->
<!-- album of photos by sliding down to reveal the photos -->
<!-- in a two-column layout -->
<!-- if you provide photos in the below container: a photo -->
<!-- album container! it will display them when a user -->
<!-- clicks on "My Photos" -->
<!-- the below layout is a two-column layout displaying -->
<!-- two photos side by side! -->
<!-- in this example, there are six photos displaying -->
<!-- in pairs to make it three rows! -->
<!-- you might want to experiment using other elements such -->
<!-- as div or span or other elements instead of button! -->
<span class="hljs-string"><button onclick="accordion('photo')"
class="mobile-button mobile-block mobile-theme-l1
mobile-left-align"><i class="fa fa-user
fa-fw mobile-margin-right"> My Photos</i>
</button>
<div id="photo" class="mobile-hide mobile-container">
<div class="mobile-row-padding">
<br>
<div class="mobile-half">
<img src="./image/paul_tuon.jpg" style="width: 100%"
class="mobile-margin-bottom">
</div>
<div class="mobile-half">
<img src="./image/paul_tuon_graduation.jpg"
style="width: 100%" class="mobile-margin-bottom">
</div>
<div class="mobile-half">
<img src="./image/paul_tuon.jpg"
style="width: 100%" class="mobile-margin-bottom">
</div>
<div class="mobile-half">
<img src="./image/paul_tuon_graduation.jpg"
style="width: 100%" class="mobile-margin-bottom">
</div>
<div class="mobile-half">
<img src="image/paul_tuon.jpg"
style="width: 100%" class="mobile-margin-bottom">
</div>
<div class="mobile-half">
<img src="image/paul_tuon_graduation.jpg"
style="width: 100%" class="mobile-margin-bottom">
</div>
</div> <!-- end div class="mobile-row-padding" -->
</div> <!-- end div id="photo" -->
</div> <!-- end div class="mobile-pale-blue" -->
</div> <!-- end div class="mobile-card mobile-round" -->
<!-- end accordion style feature! -->
</div> <!-- end middle column -->
<!-- start right column -->
<!-- here it is: right column is 2/12 of the grid -->
<div class="w3-col m2">
<div class="w3-card w3-round w3-aqua w3-center">
<div class="w3-container">
<p>Upcoming Events:</p>
<img src="./image/image_105.jpg" class="w3-margin-bottom"
style="width:100%">
<p><strong>Holiday</strong></p>
<p>Friday 15:00</p>
<p><button type="button" class="w3-button w3-theme-14
w3-block">Info</button></p>
</div>
</div>
<div class="w3-card w3-round w3-pink w3-center">
<iv class="w3-container">
<p>Friend Request</p>
<!--
<img src="./image/graduation.jpg" class="w3-margin-bottom"
style="width:50%">
-->
<span>Jane Doe</span>
<div class="w3-row w3-opacity">
<div class="w3-half">
<button type="button" class="w3-button w3-block-14
w3-green w3-section" title="Accept">
<i class="fa fa-check"></i></button>
</div>
<div class="w3-half">
<button type="button" class="w3-button w3-block-14
w3-red w3-section" title="Decline">
<i class="fa fa-remove"></i></button>
</div>
</div>
</div>
</div>
<br>
<div class="w3-card w3-round w3-purple w3-padding w3-center">
<p>ADS</p>
</div>
<br>
</div> <!-- end right column -->
<!-- here is the closing div for class w3-row! -->
</div> <!-- end grid containing class w3-row -->
<!-- right here, if you have more table rows-like data content, -->
<!-- you can add another div containing a class w3-row -->
<!-- after all the data content for this particular row has been -->
<!-- included, you can close out this div containing class w3-row -->
<!-- you can keep repeating this pattern over and over as you -->
<!-- need to make your website looks like table rows-like content! -->
<!-- the rows have to be inside the closing of the div that -->
<!-- contains w3-container. -->
<!-- as you may remember that the two most important classes in the W3 framework -->
<!-- css are w3-container and w3-row. -->
<!-- this means that you can nest these two classes inside one another in many -->
<!-- levels deep inside one another to make your grid as small or big as you want! -->
<!-- just remember that class w3-row has to be inside class w3-container! -->
<!-- and inside this class w3-row it can contain class w3-container as well to -->
<!-- nest your container inside a row! sort of a row of table that contains a container! -->
<!-- now inside this class w3-container can also contains nested rows -- I mean many 'rows' -->
<!-- of content (or container, more specifically, w3-container classes) -->
<!-- you can keep repeating this pattern over and over as you -->
<!-- need to make your grid looks like table rows-like content! -->
<!-- this means that you can grid your grids to line up very close or far apart from each other! -->
<!-- you can grid your grids to place your content anywhere in the website to position your -->
<!-- content to suite the look and feel like a drag and drop items arrangement in a desktop pane! -->
<!-- just remember that the rows have to be inside the container that contains w3-container! -->
<!-- and they all can be nested! -->
<!-- here is the closing div that contains class w3-container! -->
</div> <!-- end page container -->
<!-- at this point all open div tags have been closed -->
<!-- so the grid system is very simple. -->
<!-- it only contains two classes: w3-container and w3-row -->
<!-- that's all! -->
<!-- anything inside the grid are just ordinary html elements: -->
<!-- div, p, span, etc. -->
<!-- as you can see from the above grid, -->
<!-- it contains only one w3-container and one w3-row -->
<!-- that's all! -->
<!-- here is the last section of the website: footer -->
<!-- start footer -->
<footer class="w3-container w3-theme-d3 w3-padding-16">
<div>Follow us on social medias: Facebook, Twitter, Instagram!</div>
<div class="w3-right">Contact: john@doe.com</div>
</footer>
<script>
// Accordion
function myFunction(id)
{
var x = document.getElementById(id);
if (x.className.indexOf("w3-show") == -1)
{
x.className += " w3-show";
x.previousElementSibling.className += " w3-theme-d1";
}
else
{
x.className = x.className.replace("w3-show", "");
x.previousElementSibling.className =
x.previousElementSibling.className.replace(" w3-theme-d1", "");
}
}
// used to toggle on smaller screen when clicking on the menu button
function openNav()
{
var x = document.getElementById("navDemo");
if (x.className.indexOf("w3-show") == -1)
{
x.className += " w3-show";
}
else
{
x.className = x.className.replace(" w3-show", "");
}
}
</script>
</body>
</html>
/* THIS ENDS THE WEBSITE DEMONSTRATION CODE */
/* The rest are just extra contents to help you learn more about programming */
/* Here is the listing of colors. see css file for more definitions */
/* Colors */
.w3-amber, .w3-hover-amber:hover{color:#000!important;
background-color:#ffc107!important}
.w3-aqua,.w3-hover-aqua:hover{color:#000!important;
background-color:#00ffff!important}
.w3-blue,.w3-hover-blue:hover{color:#fff!important;
background-color:#2196F3!important}
.w3-light-blue,.w3-hover-light-blue:hover{color:#000!important;
background-color:#87CEEB!important}
.w3-brown,.w3-hover-brown:hover{color:#fff!important;
background-color:#795548!important}
.w3-cyan,.w3-hover-cyan:hover{color:#000!important;
background-color:#00bcd4!important}
.w3-blue-grey,.w3-hover-blue-grey:hover,.w3-blue-gray,
.w3-hover-blue-gray:hover{color:#fff!important;
background-color:#607d8b!important}
.w3-green,.w3-hover-green:hover{color:#fff!important;
background-color:#4CAF50!important}
.w3-light-green,.w3-hover-light-green:hover{color:#000!important;
background-color:#8bc34a!important}
.w3-indigo,.w3-hover-indigo:hover{color:#fff!important;
background-color:#3f51b5!important}
.w3-khaki,.w3-hover-khaki:hover{color:#000!important;
background-color:#f0e68c!important}
.w3-lime,.w3-hover-lime:hover{color:#000!important;
background-color:#cddc39!important}
.w3-orange,.w3-hover-orange:hover{color:#000!important;
background-color:#ff9800!important}
.w3-deep-orange,.w3-hover-deep-orange:hover{color:#fff!important;
background-color:#ff5722!important}
.w3-pink,.w3-hover-pink:hover{color:#fff!important;
background-color:#e91e63!important}
.w3-purple,.w3-hover-purple:hover{color:#fff!important;
background-color:#9c27b0!important}
.w3-deep-purple,.w3-hover-deep-purple:hover{color:#fff!important;
background-color:#673ab7!important}
.w3-red,.w3-hover-red:hover{color:#fff!important;
background-color:#f44336!important}
.w3-sand,.w3-hover-sand:hover{color:#000!important;
background-color:#fdf5e6!important}
.w3-teal,.w3-hover-teal:hover{color:#fff!important;
background-color:#009688!important}
.w3-yellow,.w3-hover-yellow:hover{color:#000!important;
background-color:#ffeb3b!important}
.w3-white,.w3-hover-white:hover{color:#000!important;
background-color:#fff!important}
.w3-black,.w3-hover-black:hover{color:#fff!important;
background-color:#000!important}
.w3-grey,.w3-hover-grey:hover,.w3-gray,
.w3-hover-gray:hover{color:#000!important;
background-color:#9e9e9e!important}
.w3-light-grey,.w3-hover-light-grey:hover,.w3-light-gray,
.w3-hover-light-gray:hover{color:#000!important;
background-color:#f1f1f1!important}
.w3-dark-grey,.w3-hover-dark-grey:hover,.w3-dark-gray,
.w3-hover-dark-gray:hover{color:#fff!important;
background-color:#616161!important}
.w3-pale-red,.w3-hover-pale-red:hover{color:#000!important;
background-color:#ffdddd!important}
.w3-pale-green,.w3-hover-pale-green:hover{color:#000!important;
background-color:#ddffdd!important}
.w3-pale-yellow,.w3-hover-pale-yellow:hover{color:#000!important;
background-color:#ffffcc!important}
.w3-pale-blue,.w3-hover-pale-blue:hover{color:#000!important;
background-color:#ddffff!important}
.w3-text-amber,.w3-hover-text-amber:hover{color:#ffc107!important}
.w3-text-aqua,.w3-hover-text-aqua:hover{color:#00ffff!important}
.w3-text-blue,.w3-hover-text-blue:hover{color:#2196F3!important}
.w3-text-light-blue,.w3-hover-text-light-blue:hover{color:#87CEEB!important}
.w3-text-brown,.w3-hover-text-brown:hover{color:#795548!important}
.w3-text-cyan,.w3-hover-text-cyan:hover{color:#00bcd4!important}
.w3-text-blue-grey,.w3-hover-text-blue-grey:hover,.w3-text-blue-gray,
.w3-hover-text-blue-gray:hover{color:#607d8b!important}
.w3-text-green,.w3-hover-text-green:hover{color:#4CAF50!important}
.w3-text-light-green,.w3-hover-text-light-green:hover{color:#8bc34a!important}
.w3-text-indigo,.w3-hover-text-indigo:hover{color:#3f51b5!important}
.w3-text-khaki,.w3-hover-text-khaki:hover{color:#b4aa50!important}
.w3-text-lime,.w3-hover-text-lime:hover{color:#cddc39!important}
.w3-text-orange,.w3-hover-text-orange:hover{color:#ff9800!important}
.w3-text-deep-orange,.w3-hover-text-deep-orange:hover{color:#ff5722!important}
.w3-text-pink,.w3-hover-text-pink:hover{color:#e91e63!important}
.w3-text-purple,.w3-hover-text-purple:hover{color:#9c27b0!important}
.w3-text-deep-purple,.w3-hover-text-deep-purple:hover{color:#673ab7!important}
.w3-text-red,.w3-hover-text-red:hover{color:#f44336!important}
.w3-text-sand,.w3-hover-text-sand:hover{color:#fdf5e6!important}
.w3-text-teal,.w3-hover-text-teal:hover{color:#009688!important}
.w3-text-yellow,.w3-hover-text-yellow:hover{color:#d2be0e!important}
.w3-text-white,.w3-hover-text-white:hover{color:#fff!important}
.w3-text-black,.w3-hover-text-black:hover{color:#000!important}
.w3-text-grey,.w3-hover-text-grey:hover,.w3-text-gray,
.w3-hover-text-gray:hover{color:#757575!important}
.w3-text-light-grey,.w3-hover-text-light-grey:hover,
.w3-text-light-gray,.w3-hover-text-light-gray:hover{color:#f1f1f1!important}
.w3-text-dark-grey,.w3-hover-text-dark-grey:hover,
.w3-text-dark-gray,.w3-hover-text-dark-gray:hover{color:#3a3a3a!important}
/* can you make sense of the above color definitions? */
/* let's take the last color definition above: the last line! */
.w3-text-dark-gray,.w3-hover-text-dark-gray:hover{color:#3a3a3a!important}
/* format it like this for a better visualization: */
.w3-text-dark-gray,
.w3-hover-text-dark-gray:hover
{
color:#3a3a3a!important
}
/* there are two classes: one is w3-text-dard-gray and the other */
/* is w3-hover-text-dark-gray which is attached to a hover mouse event. */
/* both of these two classes are assigned a color of a dark-gray */
/* which is #3a3a3a */
/* disregard the word "!important" for now. you can learn more in */
/* the css tutorial provided by W3Schools */
/* if you decide to add your own css definition, just add them to */
/* the bottom of the w3.css file. */
/* for example, if you find that the pre-made colors provided by */
/* W3Schools are not enough to your liking, you can add more color */
/* definitions to w3.css file like this: */
.w3-slate-gray
{
/** don't forget to put "!important" as well! **/
color:#ebe2e1!important
}
/* you can add other definitions to w3.css file as well because */
/* w3.css is only a css file framework that contains the universal */
/* commonly used definitions. */
/* so you most certainly need to add your own css defitions to */
/* the w3.css file */
/* A SECRET TO MEMORIZING CSS ATTRIBUTES or PROPERTIES */
/* one of the most confusing things in CSS is memorizing */
/* attributes/properties */
/* what if you have an attribute that says: */
/* padding: 10px 5px 20px 10px */
/* what does that mean? */
/* it means the padding property has four values:
top padding is 10px
right padding is 5px
bottom padding is 20px
left padding is 10px
*/
/* so how do you remember them? */
/* by brute force? */
/* that's what most people do: remembering it by brute force! */
/* but there is an easier way to remembering them and here's how: */
/* first, think of all HTML elements as a box. well, to be honest */
/* all HTML elements (div, p, span, a, button, i, etc) are boxes! */
/* and boxes have four sides and four corners! */
/* when you style an HTML element using padding you actually are */
/* styling the four sides and four corners! */
/* note: all properties that receive dimension values, i.e., padding, */
/* padding-top (-bottom, -left, and -right), margin, */
/* margin-top (-bottom, -left, and -right), border, color, etc., have */
/* four sides and four corners! */
/* now back to the padding example! */
/* if you follow the definition above it says padding 10px 5px 20px 10px */
/* it basically tells you to follow the box sitting stationary upright */
/* think of it as an ordinary box that is square sitting stationary upright */
/* an ordinary square box has four sides and four corners */
/* starting from the top of the box, which is 10px in height, and then follow */
/* the box around (from left to right), which is to the right side of the box! */
/* the KEYWORD is "around" (around the box)! */
/* in the right side of the box is where you find a 5px wide space gap! */
/* now you're done with the top and the right side of the box, so you continue */
/* on "around" the box, which is to the bottom of the box containing 20px in */
/* height! */
/* do you see what's happening? */
/* you basically follow the box "around" until you end up at the same place that */
/* you started, which is at the top of the box sitting stationary upright */
/* remember that a box has four sides and four corners! */
/* so you need to follow the box around the four corners! */
/* now you're at the bottom of the box and you continue to follow */
/* the box around, which is to the left side of the box containing */
/* a 10px wide gap! */
/* There you have it! */
/* A secret to memorizing the CSS attributes! */
/* what if you have something like the following illustrations? */
/* the same thing: follow the box! well, sort of! but you get the idea!
if the padding property has three values:
padding: 25px 50px 75px;
top padding is 25px
right and left paddings are 50px
bottom padding is 75px
above, start at the top of the box and move to the right side of the box!
now since right and left are together, it is a common value for both!
from there, you continue on around the box until all four sides are met!
so it goes like this:
the browsers style it by first styling the top and then the right and the
left (together) and then finally the bottom and it needs not go to the left
because it already done so earlier!
if the padding property has two values:
padding: 25px 50px;
top and bottom paddings are 25px
remember the common sense of saying left and right are together?
well, the same thing is also true: top and bottom are together!
so right and left paddings are 50px
this is where the rule is broken and makes an exception, but still not
too far from the rule! but the common sense kicks in as well!
top and bottom go together and right and left also go together!
as you can see, you follow the same box rule logic!
and add common sense to it!
if the padding property has only one value:
padding: 25px;
all four paddings are 25px
this one is not obvious to the human eyes but the browsers style it
using the box rule by first styling the top and then the right and then
the bottom and finally the left side of the box using only one value!
YES, THIS IS TRUE THAT BROWSWERS FOLLOW THE BOX SHAPE AROUND!
Do you see how simple it is to remember something that is so hard?
*/
/* YOUR OWN CSS DEFINITIONS */
/* most likely you will need to create your own CSS definitions */
/* to fullfil your needs! */
/* when you create your own definitions make sure that you use your */
/* own prefix and not the 'w3' prefix so that to avoid conflict! */
/* the color, padding, margin size, and text size are probably the */
/* most definitions you might need to create to fullfil your needs! */
/* for example, in most cases, you might need to style the left side */
/* margin only by using a 'my-padding-left-10 or my-margin-left-20 or
whatever margin or padding size you need! for example:
.my-padding-left-10
{
/* here is where you specify the size */
padding-left:10px!important;
}
.my-margin-left-20
{
/* here is where you specify the size */
margin-left:20px!important;
}
*/
/* there you have it! */
/* please check out tutorials at the W3Schools.com for more */
/* on this topic! */
For more about colors, please see my tutorial called an introduction to colors!
To get your own color check this out: color picker!
As mentioned earlier, the best place to advance your programming skills is the W3Schools. One particular topic that you might want to spend some time on learning is the image tutorial. You can learn how to place background images on your website as well as learning how to make your images work on mobile devices. So there are lots of topics available for you to improve your programming skills.
While you're at it learning about images, you might want to spend some time learning this important CSS class that makes displaying images awesome. The CSS class is called "clearfix" and can be found here: https://www.w3schools.com/howto/howto_css_clearfix.asp
Also, while you're at it learning about CSS, you might find these topics interesting and useful as well. Check the following topics out:
Best Free JavaScript & CSS/CSS3 Libraries For Modern Web Design
For more good stuffs, particularly photo galleries, sliders and plugins, please check out these sites:
https://www.jqueryscript.net/ https://frontendscript.com/ Unslider Simplest Carousel Query LightSliderThe latter one is a very simple carousel slider that suites very well for beginning programmers to use and learn. Check it out and see the demo by clicking on the "Example" menu. Try it!!!
There you have it! So go at it!!!
Incorporate Photo Slider in a Website for Beginners
First, you need to visit the websites (particularly jqueryscript.net, https://frontendscript.com, Unslider Simplest Carousel) mentioned above and browse through their sliders. Once you've decided which one you want, go ahead and download their plugin and go from there. Each plugin has a demo for you to see a preview of what it should look like. It also has a tutorial to help you incorporate it in your website.
For this tutorial, I chose one of the jquery slider plugin that I found on the Internet and it is called CarouFredSel. Here is the link to that plugin: https://github.com/DivaVocals/carouFredSel
If you want to use this plugin, you need to download the plugin from the link mentioned above and extract it. The plugin as usual comes in a zip package, so you definitely need a zip software installed on your computer to extract it. See instruction on zip application earlier at the beginning of this tutorial.
Once you'd downloaded and extracted it, you can view the demo contains in file index.html inside the main folder called 'carouFredSel-master'. Just double-click on the file index.html and it will activate a demo screen showing the various styles of the slider that you can use to incorporate in your own website.
Let's incorporate that plugin in the example website shown above.
File: index.php
<!DOCTYPE html>
<html>
<head>
<title>Template</title>
<meta charset="UTF-8">
<meta name="viewport" content="width=device-width, initial-scale=1">
<!-- include jQuery + carouFredSel plugin -->
<!-- right here where you link to a jquery library that -->
<!-- is hosted in a Content Delivery Network or CDN -->
<!-- a CDN is just a central data network that mainly delivering -->
<!-- data content to users via a link! -->
<script type="text/javascript" language="javascript"
src="http://ajax.googleapis.com/ajax/libs/jquery/1.8.2/jquery.min.js"></script>
<!-- this CDN is owned by Google! -->
<!-- so Google is hosting the jquery library for everyone to link to -->
<!-- and use it instead of embedding that jquery library in their own script! -->
<!-- personally, I recommend that you embedd jquery library in your own -->
<!-- script instead of linking to a CDN! -->
<!-- to embedd a jquery library in your own script, do like the following -->
<!-- assuming you'd downloaded the jquery and place that library in a folder -->
<!-- called js/jquery -->
<script type="text/javascript" language="javascript"
src="js/jquery/jquery.min.js"></script>
<!-- to download the jquery library you -->
<!-- need to go to the jquery website: -->
<!-- https://jquery.com/download/ -->
<!-- click on the "Download the compressed, production" -->
<!-- and just hilight the whole file content and -->
<!-- copy and paste it in a blank file and name it accordingly! -->
<!-- in my case above, I named the jquery library file name to -->
<!-- 'jquery.min.js' -->
<!-- do not include both the CDN and the embedded library at the -->
<!-- same time because it might cause problems! -->
<!-- so use one or the other and not both of them at the same time! -->
<!-- next is the link to the carouFredSel library stored in the -->
<!-- plugin folder called carouFredSel-master -->
<script type="text/javascript" language="javascript"
src="jquery.carouFredSel-6.2.1-packed.js"></script>
<!-- optionally include helper plugins -->
<script type="text/javascript" language="javascript"
src="helper-plugins/jquery.mousewheel.min.js"></script>
<script type="text/javascript" language="javascript"
src="helper-plugins/jquery.touchSwipe.min.js"></script>
<script type="text/javascript" language="javascript"
src="helper-plugins/jquery.transit.min.js"></script>
<script type="text/javascript" language="javascript"
src="helper-plugins/jquery.ba-throttle-debounce.min.js"></script>
<link rel="stylesheet" href="./css/mobile.css">
<link rel="stylesheet"
href="https://cdnjs.cloudflare.com/ajax/libs/font-awesome/4.6.3/
css/font-awesome.min.css">
<link rel="stylesheet"
href="http://cdnjs.cloudflare.com/ajax/libs/twitter-bootstrap/
3.2.0/css/bootstrap.min.css">
<script src="https://code.jquery.com/w3/1.4.5/jquery.w3-1.4.5.min.js">
</script>
<script type="text/javascript" src="js/bootstrap.min.js"></script>
<script type="text/javascript" src="javascript/javascript.js">
</script>
<!-- start plugin onDocumentReady -->
<script type="text/javascript" language="javascript">
$(function()
{
// Responsive layout, resizing the items
$('#foo4').carouFredSel(
{
responsive: true,
width: '100%',
scroll: 2,
items:
{
// the sliding content's width
// if you set it to half the
// screen size it will show two
// images at a time.
// if you set it to full screen
// (1000 pixels) it will show one
// image at a time.
width: 400,
// commenting out the optionally
// resize item-height option
// height: '30%',
visible:
{
min: 2,
max: 6
}
}
}
);
}
</script>
<style type="text/css" media="all">
.list_carousel
{
background-color: #ccc;
margin: 0 0 30px 60px;
width: 360px;
}
.list_carousel ul
{
margin: 0;
padding: 0;
list-style: none;
display: block;
}
.list_carousel li
{
font-size: 40px;
color: #999;
text-align: center;
background-color: #eee;
border: 5px solid #999;
width: 50px;
height: 50px;
padding: 0;
margin: 6px;
display: block;
float: left;
}
.list_carousel.responsive
{
width: auto;
margin-left: 0;
}
.clearfix
{
float: none;
clear: both;
}
.prev
{
float: left;
margin-left: 10px;
}
.next
{
float: right;
margin-right: 10px;
}
</style>
</head>
<body class="w3-theme-l5 w3-light-grey">
<!-- some of the following codes were broken down into multiple lines -->
<!-- to fit the screen display -->
<!-- Navbar -->
<!-- this is the div that wraps around the navbar -->
<div class="w3-top">
<div class="w3-bar w3-theme-d2 w3-left-align w3-small w3-blue">
<a class="w3-bar-item w3-button w3-hide-medium w3-hide-large w3-right
w3-padding-small w3-hover-white w3-small w3-theme-d2"
href="javascript:void(0);" onclick="openNav()">
<i class="fa fa-bars"></i></a>
<a href="#" class="w3-bar-item w3-button w3-padding-large w3-theme-d4">
<i class="fa fa-home w3-margin-right"></i>Logo</a>
<a href="#" class="w3-bar-item w3-button w3-hide-small w3-padding-large
w3-hover-white" title="News"><i class="fa fa-globe"></i></a>
<a href="#" class="w3-bar-item w3-button w3-hide-small w3-padding-large
w3-hover-white" title="Account Settings"><i class="fa fa-user"></i></a>
<a href="#" class="w3-bar-item w3-button w3-hide-small w3-padding-large
w3-hover-white" title="Messages"><i class="fa fa-envelope"></i>
<div class="w3-dropdown-hover w3-hide-small">
<button class="w3-button w3-padding-large" title="Notifications">
<i class="fa fa-bell"></i>
<span class="w3-badge w3-right w3-small w3-green">3</span>
</button>
<div class="w3-dropdown-content w3-card-4 w3-bar-block"
style="width:300px">
<a href="#" class="w3-bar-item w3-button">One new friend request</a>
<a href="#" class="w3-bar-item w3-button">John Doe posted on
your wall</a>
<a href="#" class="w3-bar-item w3-button">Jane likes your post</a>
</div>
</div>
<a href="#" class="w3-bar-item w3-button w3-hide-small w3-right
w3-padding-medium w3-hover-white" title="My Account">
<img src="./image/paul_tuon.jpg" class="w3-circle"
style="height:23px;width:23px" alt="Avatar"> </a>
</div>
</div> <!-- end div class="w3-top" -->
<!-- Navbar on small screens -->
<div id="navDemo" class="w3-bar-block w3-theme-d2 w3-hide
w3-hide-large w3-hide-medium w3-large">
<a href="#" class="w3-bar-item w3-button w3-padding-large">Link 1</a>
<a href="#" class="w3-bar-item w3-button w3-padding-large">Link 2</a>
<a href="#" class="w3-bar-item w3-button w3-padding-large">Link 3</a>
<a href="#" class="w3-bar-item w3-button w3-padding-large">My Profile</a>
</div>
<!-- now the navbar code is done! -->
<!-- at this point there are 0 open <div> tag -->
<!-- Slider Container -->
<div class="w3-container w3-content" style="max-width:1400px; margin-top:40px">
<div class="list_carousel responsive">
<!-- right here where the content of the slider is placed -->
<!-- notice that you can put any kind of content such as -->
<!-- text, images, etc., and as many content as you wish! -->
<!-- the slider will circle through the content until the end and loops -->
<!-- back to the beginning of the list! -->
<!-- the display of the images is dependenced on the size of the window -->
<!-- you set in the options of the function carouFredSel() above! -->
<!-- in the example above it was set to width: 400! -->
<ul id="foo4">
<li><img src="image/picture1.jpg"></li>
<li><img src="image/picture2.jpg"></li>
<li><img src="image/picture3.jpg"></li>
<li><img src="image/picture4.jpg"></li>
<li><img src="image/picture5.jpg"></li>
<li><img src="image/picture6.jpg"></li>
<li><img src="image/picture7.jpg"></li>
<li><img src="image/picture8.jpg"></li>
<li><img src="image/picture9.jpg"></li>
<li><img src="image/picture10.jpg"></li>
<li><img src="image/picture11.jpg"></li>
<li><img src="image/picture12.jpg"></li>
<li><img src="image/picture13.jpg"></li>
<li><img src="image/picture14.jpg"></li>
<li><img src="image/picture15.jpg"></li>
<li><img src="image/picture16.jpg"></li>
</ul>
<!-- for more tutorial on class "clearfix" please visit -->
<!-- https://www.w3schools.com/howto/howto_css_clearfix.asp -->
<div class="clearfix"></div>
</div>
</div>
<!-- Page Container -->
<div class="w3-container w3-content" style="max-width:1400px; margin-top:80px">
<!-- The Grid -->
<!-- here is the row! -->
<div class="w3-row">
<!-- Left Column -->
<div class="w3-col m3 w3-container">
<!-- Profile -->
<div class="w3-card w3-round w3-light-blue">
<div class="w3-container">
<h4 class="w3-center">My Profile</h4>
<p class="w3-center"><img src="./image/paul_tuon.jpg"
class="w3-circle" style="height:106px;width:106px"
alt="A Profile Picture"></p>
<hr>
<p><i class="fa fa-pencil fa-fw w3-margin-right
w3-text-theme"></i> Designer, UI</p>
<p><i class="fa fa-home fa-fw w3-margin-right
w3-text-theme"></i> Minneapolis, MN (US)</p>
<p><i class="fa fa-birthday-cake fa-fw w3-margin-right
w3-text-theme"></i> April 1, 2020</p>
</div>
</div>
<br>
<!-- Accordion -->
<div class="w3-card w3-round">
<div class="w3-pale-blue">
<button onclick="myFunction('Demo1')" class="w3-button
w3-block w3-theme-l1 w3-left-align">
<i class="fa fa-circle-onotch fa-fw w3-margin-right">
My Groups</i></button>
<div id="Demo1" class="w3-hide w3-container">
<p>Some text..</p>
</div>
<button onclick="myFunction('Demo2')" class="w3-button w3-block
w3-theme-l1 w3-left-align"><i class="fa fa-calendar-check-0
fa-fw w3-margin-right"> My Events</i></button>
<div id="Demo2" class="w3-hide w3-container">
<p>Some other text..</p>
</div>
<button onclick="myFunction('Demo3')" class="w3-button
w3-block w3-theme-l1 w3-left-align">
<i class="fa fa-user fa-fw w3-margin-right"> My Photos
</i></button>
<!-- class w3-container is used to hold the photos album layout -->
<!-- "My Photos" button! -->
<div id="Demo3" class="w3-hide w3-container">
<div class="w3-row-padding">
<br>
<!-- the following is where you put your photo album! -->
<!-- class w3-half is a grid layout as a two-column -->
<!-- layout relative to the class w3-container used -->
<!-- in the album layout so the photos are arranged -->
<!-- side by side as a two-column layout -->
<div class="w3-half">
<img src="./image/paul_tuon.jpg" style="width: 100%"
class="w3-margin-bottom">
</div>
<div class="w3-half">
<img src="./image/graduation.jpg" style="width: 100%"
class="w3-margin-bottom">
</div>
<!-- this is another two-column grid stacking below above -->
<div class="w3-half">
<img src="./image/paul_tuon.jpg" style="width: 100%"
class="w3-margin-bottom">
</div>
<div class="w3-half">
<img src="./image/graduation.jpg" style="width: 100%"
class="w3-margin-bottom">
</div>
<!-- this is another two-column grid stacking below above -->
<div class="w3-half">
<img src="image/example5.jpg" style="width: 100%"
class="w3-margin-bottom">
</div>
<div class="w3-half">
<img src="image/graduation.jpg" style="width: 100%"
class="w3-margin-bottom">
</div>
</div> <!-- end div class="w3-row-padding" -->
</div> <!-- end div id="Demo3" -->
</div> <!-- end div class="w3-white" -->
</div> <!-- end div class="w3-card w3-round" -->
<!-- this is the end of an accordion-like feature! -->
<!-- at this point there are still 3 open div -->
<!-- Interest: the miscellaneous content of interest! -->
<!-- w3-hide-small is to not display the content when mobile -->
<!-- device is used to load the web site! so "Interests" content -->
<!-- won't be loaded if mobile device is being used to load -->
<!-- this web site -->
<div class="w3-card w3-round w3-teal w3-hide-small">
<div class="w3-container">
<p>Interests</p>
<p>
<span class="w3-tag w3-small w3-theme-d5">News</span>
<span class="w3-tag w3-small w3-theme-d4">W3Schools</span>
<span class="w3-tag w3-small w3-theme-d3">Labels</span>
<span class="w3-tag w3-small w3-theme-d2">Games</span>
<span class="w3-tag w3-small w3-theme-d1">Friends</span>
<span class="w3-tag w3-small w3-theme">Games</span>
<span class="w3-tag w3-small w3-theme-l1">Friends</span>
<span class="w3-tag w3-small w3-theme-l2">Food</span>
<span class="w3-tag w3-small w3-theme-l3">Design</span>
<span class="w3-tag w3-small w3-theme-l4">Art</span>
<span class="w3-tag w3-small w3-theme-l5">Photos</span>
</p>
</div>
</div>
</div> <!-- end left column -->
<!-- at this point there are still 2 open <div> tags -->
<!-- start middle column -->
<div class="w3-col m7">
<!-- right here where I add some new content to the middle column -->
<!-- I add a scrolling message board to make it more flashy. for example: -->
<div class="w3-row-padding">
<!-- notice that you need to use the entire length of the grid: m12 -->
<!-- meaning the entire middle column -->
<div class="w3-col m12">
<div class="w3-card-2 w3-round w3-white">
<div class="w3-container w3-padding">
<marquee bgcolor=white width="100%" height="50">
<font size="5" color="#FF66FF">
Welcome to the 21st century and beyond where digital mobile rules!</font>
<font size="5" color="#1883FF">More content to scroll!</font>
</marquee>
</div>
</div>
</div>
</div>
<div class="w3-row-padding">
<div class="w3-col m12">
<div class="w3-card w3-round w3-white">
<div class="w3-container w3-padding">
<h6 class="w3-opacity">Social Media Template</h6>
<p contenteditable="true" class="w3-border
w3-padding">Status: Feeling blue!</p>
<button type="button" class="w3-button w3-theme">
<i class="fa fa-pencil"></i> Post
</button>
</div>
</div>
</div>
</div>
<div class="w3-container w3-card w3-round w3-blue w3-margin">
<img src="./image/paul_tuon.jpg" alt="Avatar" class="w3-left
w3-circle w3-margin-right" style="width:60px">
<span class="w3-right w3-opacity">1 min</span>
<h4>John Doe</h4>
<hr class="w3-clear">
<p>This is just an ordinary content! You can put whatever
content you want!</p>
<div class="w3-row-padding" style="margin:0 -16px">
<!--
<div class="w3-half">
<img src="./image/graduation.jpg" alt="just a picturer"
style="width: 100%" class="w3-margin-bottom">
</div>
<div class="w3-half">
<img src="./image/paul_tuon.jpg" alt="another picture"
style="width: 100%" class="w3-margin-bottom">
</div>
-->
</div>
<button type="button" class="w3-button w3-theme-d1 w3-margin-bottom">
<i class="fa fa-thumbs-up"></i> Like</button>
<button type="button" class="w3-button w3-theme-d2 w3-margin-bottom">
<i class="fa fa-comment"></i> Comment</button>
</div>
<div class="w3-container w3-card w3-round w3-khaki w3-margin"><br>
<!--
<img src="./image/graduation.jpg" alt="Avatar" class="w3-left
w3-circle w3-margin-right" style="width:60px">
-->
<span class="w3-right w3-opacity">16 min</span>
<h4>Jane Doe</h4>
<hr class="w3-clear">
<p>Lorem ipsum dolor. Lorem ipsum dolor. Lorem ipsum dolor.
Lorem ipsum dolor. Lorem ipsum dolor.</p>
<button type="button" class="w3-button w3-theme-d1 w3-margin-bottom">
<i class="fa fa-thumbs-up"></i> Like</button>
<button type="button" class="w3-button w3-theme-d2 w3-margin-bottom">
<i class="fa fa-comment"></i> Comment</button>
</div>
The following block of code contained in the original template
<!--
<div class="w3-container w3-card w3-round w3-lime w3-margin"><br>
<img src="./image/paul_tuon.jpg" alt="Avatar" class="w3-left
w3-circle w3-margin-right" style="width:60px">
<span class="w3-right w3-opacity">30 min</span>
<h4>Angie Jane
<hr class="w3-clear">
<img src="./image/gradution.jpg" class="w3-margin-bottom"
style="width:100%">
<p>Lorem ipsum dolor. Lorem ipsum dolor. Lorem ipsum dolor.
Lorem ipsum dolor. Lorem ipsum dolor.</p>
<button type="button" class="w3-button w3-theme-d1 w3-margin-bottom">
<i class="fa fa-thumbs-up"></i> Like</button>
<button type="button" class="w3-button w3-theme-d2 w3-margin-bottom">
<i class="fa fa-comment"></i> Comment</button>
</div>
-->
<!-- Accordion -->
<div class="mobile-card mobile-round">
<div class="mobile-pale-blue">
<button onclick="myFunction('group')"
class="mobile-button mobile-block mobile-theme-l1
mobile-left-align">
<i class="fa fa-circle-onotch fa-fw
mobile-margin-right"> My Groups</i>
</button>
<div id="group" class="mobile-hide mobile-container">
<p>Some text..</p>
</div>
<button onclick="accordion('event')"
class="mobile-button mobile-block mobile-theme-l1
mobile-left-align">
<i class="fa fa-calendar-check-0 fa-fw
mobile-margin-right"> My Events</i>
</button>
<div id="event" class="mobile-hide mobile-container">
<p>Some other text..</p>
<div>
<span class="hljs-string"><button onclick="accordion('photo')"
class="mobile-button mobile-block mobile-theme-l1
mobile-left-align"><i class="fa fa-user
fa-fw mobile-margin-right"> My Photos</i>
</button>
<div id="photo" class="mobile-hide mobile-container">
<div class="mobile-row-padding">
<br>
<div class="mobile-half">
<img src="./image/paul_tuon.jpg" style="width: 100%"
class="mobile-margin-bottom">
</div>
<div class="mobile-half">
<img src="./image/paul_tuon_graduation.jpg"
style="width: 100%" class="mobile-margin-bottom">
</div>
<div class="mobile-half">
<img src="./image/paul_tuon.jpg"
style="width: 100%" class="mobile-margin-bottom">
</div>
<div class="mobile-half">
<img src="./image/paul_tuon_graduation.jpg"
style="width: 100%" class="mobile-margin-bottom">
</div>
<div class="mobile-half">
<img src="image/paul_tuon.jpg"
style="width: 100%" class="mobile-margin-bottom">
</div>
<div class="mobile-half">
<img src="image/paul_tuon_graduation.jpg"
style="width: 100%" class="mobile-margin-bottom">
</div>
</div> <!-- end div class="mobile-row-padding" -->
</div> <!-- end div id="photo" -->
</div> <!-- end div class="mobile-pale-blue" -->
</div> <!-- end div class="mobile-card mobile-round" -->
<!-- end accordion style feature! -->
</div> <!-- end middle column -->
<!-- start right column -->
<!-- here it is: right column is 2/12 of the grid -->
<div class="w3-col m2">
<div class="w3-card w3-round w3-aqua w3-center">
<div class="w3-container">
<p>Upcoming Events:</p>
<img src="./image/image_105.jpg" class="w3-margin-bottom"
style="width:100%">
<p><strong>Holiday</strong></p>
<p>Friday 15:00</p>
<p><button type="button" class="w3-button w3-theme-14
w3-block">Info</button></p>
</div>
</div>
<div class="w3-card w3-round w3-pink w3-center">
<iv class="w3-container">
<p>Friend Request</p>
<!--
<img src="./image/graduation.jpg" class="w3-margin-bottom"
style="width:50%">
-->
<span>Jane Doe</span>
<div class="w3-row w3-opacity">
<div class="w3-half">
<button type="button" class="w3-button w3-block-14
w3-green w3-section" title="Accept">
<i class="fa fa-check"></i></button>
</div>
<div class="w3-half">
<button type="button" class="w3-button w3-block-14
w3-red w3-section" title="Decline">
<i class="fa fa-remove"></i></button>
</div>
</div>
</div>
</div>
<br>
<div class="w3-card w3-round w3-purple w3-padding w3-center">
<p>ADS</p>
</div>
<br>
</div> <!-- end right column -->
<!-- here is the closing div for class w3-row! -->
</div> <!-- end grid containing class w3-row -->
<!-- here is the closing div that contains class w3-container! -->
</div> <!-- end page container -->
<!-- here is the last section of the website: footer -->
<!-- start footer -->
<footer class="w3-container w3-theme-d3 w3-padding-16">
<div>Follow us on social medias: Facebook, Twitter, Instagram!</div>
<div class="w3-right">Contact: john@doe.com</div>
</footer>
<script>
// Accordion
function myFunction(id)
{
var x = document.getElementById(id);
if (x.className.indexOf("w3-show") == -1)
{
x.className += " w3-show";
x.previousElementSibling.className += " w3-theme-d1";
}
else
{
x.className = x.className.replace("w3-show", "");
x.previousElementSibling.className =
x.previousElementSibling.className.replace(" w3-theme-d1", "");
}
}
// used to toggle on smaller screen when clicking on the menu button
function openNav()
{
var x = document.getElementById("navDemo");
if (x.className.indexOf("w3-show") == -1)
{
x.className += " w3-show";
}
else
{
x.className = x.className.replace(" w3-show", "");
}
}
</script>
</body>
</html>
/* there you have it! */
/* a responsive mobile image slider */
/* when the website is loaded using a mobile */
/* device the slider showing one image sliding */
/* at a time! */
/* again, check out the plugin website mentioned earlier */
/* to find all kinds of plugins to use on your website! */
b
/* go at it! */
Incorporate Fontawesome in a Website for Beginners
Fontawesome is a collection of ready-made images available to anyone for free. For a visual view on some examples of fontawesome images, go to my other website called "MondayThruSunday.COM," and look in all of the menu items and there should be a fontawesome in the front of the menu name for each menu item.
For example, for a menu name called "Home," there is a fontawesome image looking like a house in the front of the word "Home"; for a menu name called "Search," there is a fontawesome image looking like a magnifying glass in the front of the word "Search"; for a menu name called "Signup," there is a fontawesome image looking like three horizontal hash bars in the front of the word "Signup."
Fontawesomes are easy to use and most of all, you don't need to download them from somewhere and install them on your computer. They are available via the browser technology and the HTML.
To use fontawesomes, all you have to do is include the link to a CDN and then referring to its name as a class name inside your HTML element document -- the same way you refer to your CSS class names. See an illustration below.
Fontawesome images class starts with the word "fa fa-." For examples:
In the head <head> section of your HTML file, include the below link:

<link rel="stylesheet"
href="https://cdnjs.cloudflare.com/ajax/libs/font-awesome/4.6.3/css/font-awesome.min.css">

Again, a CDN (or Content Delivery Network) is just a central data

network that mainly delivering data content to users via a link!

Note that there are hundreds of CDNs out there that you can link to.
The above link is just one of those. Google has one and so does Bootstrap.
Here is a CDN from Bootstrap:

<link rel="stylesheet"
href="https://maxcdn.bootstrapcdn.com/font-awesome/4.4.0/css/font-awesome.min.css">

So it is just a matter of preference of which CDN to use and all will work just fine!

After you included the link, you can refer to the font awesome images as
you normally would the same way you refer to a CSS class. For example:

In the body <body> section of your HTML file, do this:

<div class="fa fa-home"></div>      will display an image of a house:

<div class="fa fa-home"> Home</div>      will display:  Home

<div class="fa fa-bars"></div>  will display an image of three horizontal hash bars:

<div class="fa fa-search"></div>    will display an image of a magnifying glass:

<div class="fa fa-check"></div>     will display an image of a checkmark:

<div class="fa fa-globe"></div>     will display an image of a globe:

<div class="fa fa-cart-arrow-down"></div>  will display an image of a shopping cart:

<div class="fa fa-plus"></div>      will display an image of a plus sign:
There are thousands of fontawesome images available on the Internet for free to use. Just Google the term "fontawesome" and it will give a lot of results to choose from.
Earlier, I mentioned that you don't need to download fontawesome images anywhere from the Internet. That is true for the standard fontawesome images that are provided by the World Wide Web consortium.
However, for thousands of specialized third party fontawesome images like specialized shopping cart [where you can customize the inter-activity of the cart] and others, you need to download them from the Internet and store them in your folders and refer to them accordingly.
All CDNs do the same thing: they gather all of the fontawesome images and store them in a directory on their server and provide a link to the public to link to.
For more about fontawesome tutorials, please check out this site: https://www.w3schools.com/css/css_icons.asp
Here is another excellent fontawesome tutorial: https://www.w3resource.com/icon/font-awesome/web-application-icons/cart-arrow-down.php
Here is the official site of the standard fontawesome consortium site: https://fontawesome.com/icons/cart-arrow-down
Here is the official site of the standard fontawesome consortium site that lists a fontawesome cheat sheet that you can basically find a particular fontawesome image quickly: https://fontawesome.com/cheatsheet?from=io
Advancing Your Programming Skills: CSS Badge
Here is an interesting topic that you might find very useful: CSS Badge
/** showing the number of items in the cart **/

/** here, assuming you have a shopping cart that has a **/
/** variable called $cart_count that holds the number of  **/
/** items in the cart **/

cart<a href="#"><span class="badge" id="cart-count"><?=$cart_count?></span></a>
For more tutorial on "badge" please click on the link below!
Advancing Your Programming Skills
As mentioned earlier multiple times, the best place to advance your programming skills is the W3Schools. One of the many topics that you might want to spend some time on learning is the "dialog modal" box tutorial that can be found here: https://www.w3schools.com/bootstrap/bootstrap_modal.asp. With the modal dialog box, you can put all kinds of content to make your users interact with it.
Here are some of the interesting topics that you might want to spend some time learning:
https://www.w3schools.com/bootstrap/bootstrap_carousel.asp https://www.w3schools.com/bootstrap/bootstrap_affix.asp https://www.w3schools.com/bootstrap/bootstrap_glyphicons.asp https://www.w3schools.com/bootstrap/bootstrap_pagination.asp https://www.w3schools.com/bootstrap/bootstrap_images.asp https://www.w3schools.com/css/css_image_gallery.asp https://www.w3schools.com/css/css3_text_effects.asp https://www.w3schools.com/html/html_entities.asp
So there are lots of topics available for you to improve your programming skills. So go at it!!!
Simple Tricks
When you program websites, you might run into situations that require you to be creative instead of using CSS to accomplish your tasks. One of the neat trick is to use non-breaking space command or to put some spaces between your content, as the "<marquee></marquee>" example below shows.
One is approximately equals to 10 pixels. As you can see in the example below, it requires a lot of to make the spaces wide enough.
The drawback of using instead of CSS is that it is very cluttered and messy; however, it is much quicker and easier than having to write CSS definitions.
Sometimes you can't write CSS definitions to fit your goal as in my case below. So you are left to use to accomplish the task.
Nonetheless, be very careful using instead of CSS because in mobile devices it might not display very well, especially if you have lots of .
So use it sparingly is the best way to use it. Don't over-use it!
In my case, it works very well on any mobile devices.
So there you have it! A very neat trick to use!!!
A Bonus: A Simple Trick to Scroll Contents
Here is a very simple trick to make your website looks awesome.
You won't see this trick anywhere in the document or tutorials
anywhere but only right here from me.
I use this trick on my own websites on a regular basis.
Here it is:
<div style="width: 700px; height: auto; background-color: #ffdddd;
padding: 5px 5px 5px 5px"><marquee>Content to scroll!</marquee>
</div>
The tag is called "<marquee></marquee>"
This simple tag scrolls continuously any content you put in it!
You can put this "<marquee></marquee>" tag anywhere as a
standalone or inside any HTML elements: <div>, <span>, <p>, etc.
You can also style your <marquee> content, such as
configuring the width and height and background color, etc.
Here is the same code that I use on my website: ZeroNilZilch.COM.
Notice that I embedded the styling code directly in the <marquee></marquee> as
appose to putting it in the <div></div> or other HTML elements.
It is just a personal preference and any HTML elements will work just fine.
As you can see, I had to use lots of to make enough spaces between contents!
The listing of between contents is a continuous line, but here,
it is broken down into multiple lines for displaying purpose!
<marquee bgcolor="white" width="100%" height="50">
<font size="5" color="#00FF99">www.ZeroNilZilch.COM</font>
<font size="5" color="#3333FF">Where the future is already here!</font>
<font size="5" color="#00FFFF">Explore, see the horizon,
open your mind and let your curiosity run wild,
discover, inspire and enrich your learning!!!</font>
<font size="5" color="#3333FF">The engine of your inginuity is limited only to
your imagination!!!</font>
<font size="5" color="#FF66FF">
Welcome to the 21st century and beyond where digital mobile rules!</font>
<font size="5" color="#1883FF">
This website and all of our affiliate sites are mobile-friendly!</font>
<font size="5" color="#00FFFF">
This means that you can use your mobile phones or any portable
small device to surf and shop with us conveniently and securely at all of our
affiliate sites!!!</font>
<font size="5" color="#FF66FF">They're built for the Millenials,
where all things Millenial, the Millenials' way!!</font>
<font size="5" color="#3333FF">Go ahead and fire up your smartphones and load
this website and see if it's mobile-friendly or not!</font>
</marquee>
Here are some more special characters to make your websites appear more useful. Please check this out:
A Simple Trick to Display Text Vertically
Here is a very simple trick to make your texts appear vertically as well as other text effects that you might find useful. Please check these out:
https://www.w3schools.com/cssref/css3_pr_writing-mode.asp https://www.w3schools.com/css/css_align.asp https://www.w3schools.com/cssref/pr_text_text-decoration.asp https://www.w3schools.com/cssref/css3_pr_transform.asp https://www.w3schools.com/cssref/css3_pr_transition.asp https://www.w3schools.com/cssref/tryit.asp?filename=trycss_zindex
A Simple Trick to Display Navigation Bar Using HTML NAV Tag
Here is a very simple trick to make your navigation bar works on mobile devices. On desktop it will display the menu items horizontally but on mobile devices, it will display them vertically.
Note that on mobile devices, the menu bar will be cleared all of menu items and a fontawesome fa fa-bars: is used instead in place of the menu items and the fa fa-bars is shown on the menu bar as a button to click.
When a user clicks on the fa fa-bars symbol it opens up the menu items listing the menu items vertically and neatly.
Using NAV tag, you don't need to do any special tricks to make it mobile-friendly: it is already built-in the browser technology.Just list your menu items to make it work on desktop devices as you normally would and the browser technology takes care of the mobile devices display behind the scene for you so that you don't need to do any special tricks:
https://www.w3schools.com/tags/tag_nav.aspThere you have it! A secret way to beautify your website!!!
A Simple Trick to a Mobile-friendly Website
Here is a very simple trick to make your website mobile-friendly. First of all, this is just a simple trick that is suited to some small situations where CSS is too complicated and too bulky to use. This trick works very well when you have a section of the code needs to handle small mobile devices and another section next to it can be used for desktop devices. For example:
<?php
/** this is a special trick that you'll never see from **/
/** any documentation or tutorials anywhere, period! **/

/** here is the special trick using a combination of PHP and Javascript: **/

echo "<script language='javascript'>

/** you need a space between the echo " and location **/

echo " location.href=\"${_SERVER['SCRIPT_NAME']}?${_SERVER['QUERY_STRING']}"
      . "&width=\" + screen.width + \"&height=\" + screen.height;\n";
echo "</script>\n";

/** basically, the code above picks out the width and height **/
/** of the device using Javascript screen object and just **/
/** referring to the object's property: width and height! **/
/** very neat and simple! **/

/** the reference to 'location.href' is just reading the url's **/
/** incoming request and picking off the querystring at **/
/** the same time! **/

/** okay, let's see how it works! **/

/** first, you test the size of the device **/

/** in other words, when the browser hits this code above, **/
/** it checks to see what size the device is. **/

/** if it is a desktop device being used to surf this website, **/
/** it will execute the area of the code designed to be used on desktop! **/

/** if it is a mobile device being used to surf this website, **/
/** it will execute the area of the code designed to be used on mobile **/
/** devices **/

/** this is much simpler than having to write CSS definitions **/
/** it works just as good as if you had written a CSS definition to **/
/** do the job! **/

/** as a matter of fact, the groups that wrote the CSS rules to **/
/** make CSS definitions mobile-friendly used this same technique to **/
/** detect the devices to make their CSS rule do the job **/
/** of detecting the various mobile size! **/

/** they called it media definition that looks like this: **/

@media (max-width: 480px)
     {
      .nav-collapse
           {
            -webkit-transform: translate3d(0, 0, 0);
           }
      .page-header h1 small
           {
            display: block;
            line-height: 20px;
           }
     }

/** but first, you need to test if the browser can read **/
/** the dimensions of the device being used to surf the webpage! **/

/** all browsers returns a width and height of the device being **/
/** used every time it loads the webpage! **/

/** but we need to use a special trick that you'll never see from **/
/** any documentation or tutorials anywhere, period! **/

/** here is a special trick using a combination of PHP and Javascript: **/

<?php
if (isset($_GET['width']) AND isset($_GET['height']))
   {
    global $width;
    global $height;
    // grab the geometry variables
    $width  = $_GET['width'];
    $height = $_GET['height'];
    if ($width > 600)
       {
        // desktop device! prepare code to be used on desktop!
?>
        <!-- left column -->
        <div class="mobile-col m3">

            <!-- display left column content for desktop! -->

        </div>
        <!-- end left column -->

        <!-- middle column -->
        <div class="mobile-col m7">

            <!-- display middle column content for desktop! -->

        </div>
        <!-- end middle column -->

        <!-- right column -->
        <div class="mobile-col m2">

            <!-- display right column content for desktop! -->

        </div>
        <!-- end right column -->
<?php
       } // end if $width > 600
    else
       {
        // mobile devices! prepare code to be used on mobile devices!

        // notice that inside this mobile section, you still need to
        // use CSS to style the content to be mobile-friendly!

        // I told you earlier that this simple trick doesn't do all of
        // your mobile-friendly works! it does for certain situations only!
        // you can use both this trick and CSS definitions to your advantage!
?>
        <!-- left column -->
        <div class="mobile-col m3">

            <!-- display left column content for desktop! -->

        </div>
        <!-- end left column -->

        <!-- middle column -->
        <div class="mobile-col m7">

            <!-- display middle column content for desktop! -->

        </div>
        <!-- end middle column -->

        <!-- right column -->
        <div class="mobile-col m2">

            <!-- display right column content for desktop! -->

        </div>
        <!-- end right column -->
<?php
       } // end else if $width > 600
   } // end if (isset($_GET['width']) AND isset($_GET['height']))
else
   {
    // pass the geometry variables (preserve the original query string
    echo "<script language='javascript'>\n";
    echo " location.href=\"${_SERVER['SCRIPT_NAME']}?${_SERVER['QUERY_STRING']}"
           . "&width=\" + screen.width + \"&height=\" + screen.height;\n";
    echo "</script>\n";

    // if for some reasons that the browser fails to grab the dimensions
    // it will come here and you can handle that case accordingly!

    // that situation is very rare! this code above always returns
    // the dimensions!

    // desktop device! prepare code to be used on desktop!
?>
        <!-- left column -->
        <div class="mobile-col m3">

            <!-- display left column content for desktop! -->

        </div>
        <!-- end left column --<

        <!-- middle column -->
        <div class="mobile-col m7">

            <!-- display middle column content for desktop! -->

        </div>
        <!-- end middle column -->

        <!-- right column -->
        <div class="mobile-col m2">

            <!-- display right column content for desktop! -->

        </div>
        <!-- end right column -->
<?php
   }
?>
There you have it!
A secret way to beautify your website by making it mobile-friendly!!!
Analytics Tools For Tracking Your Visitors
Here is an interesting topic that you might find very useful: Tracking Visitors of Your Website
If you want to use the professionally-made tools and here are a few to choose from:
Paid Web Analytics Tools For Tracking Your Visitors
Web Analytics Tools For Tracking Your Visitors
10 Web Analytics Tools For Tracking Your Visitors
My Simple Code to Track Visitors
Here is my "barebone" simple code to track your visitors visiting on the index.php front page of your website. Any time a visitor visits your website, which is primarily being visited on the index.php front page, it tracks that person as one visit. If that person returns to visit your website again on another occassion on another session, it accounts for that visit as another one visit as well.
In other words, it logs each visit by a person as one visit no matter how many pages or area a visitor is visiting because this "barebone" simple code is designed to track only one page, which is the index.php front page. When a person continues to visit other pages on your website it does not account for those visits.
When a person leaves the website entirely and comes back to visit the website again, it again will log that person as one unique visit without differentiating the visit as a return visit. It keeps doing this for all other visitors as well.
It tallies all of the visits from all visitors [new or old visitors] that enter the website on every session to account for the website traffic. The total count of the page hits does not account for the return visits by the same person.
You can make improvement to this code as well or use it "AS IS" without any modification.
First of all, you will need to create a MySQL database to store all of your page hits.
To track your website traffic, just put all of the below code in a PHP file (perhaps, name it as pagehit.php) and then include this file name (pagehit.php) at the top of your index.php front page. See an example index.php front page later.
Remember that the following code is written to log only one page, which is assumed to be an index.php front page. So put the whole code below at the top of your index.php front page.
However, you can track page hits on every page of your website as well -- not just the index.php front page.
To count page hits on all of your website pages, just include this file name (pagehit.php) in every one of your pages. It will log different querystrings for different pages.
So the key thing to come away with this code (below) is that you can place the below code at the top of every page of your website if you want to track each page. However, it will distort your total page hits because a visitor may visits all of your pages and since each of your page contains a code to capture the page hit, the total page hit will be larger than it should be.
Let's put it this way: You want to track your website's unique traffic but if a visitor visits all of your pages or just some of your pages, the page hits will not reflect the true website's unique traffic. That's why this code below was designed to track only the index.php front page so that it accurately tracks the website's unique traffic.
So if you put the below code at the top of every page on your website it will just add all of the page hits together from all of your pages, including the index.php front page. In other words, it combines all of the page hits from all of your pages as one total and this total does not reflect the true unique traffic of the site.
So if you want to know which page got how many hits, you'll have to modify the code slightly because the code below just lump all of the various page hits together as one total, and this total includes the hits on the index.php front page, too.
Notice that you can either put the following code in a PHP file (pagehit.php) and include it like [include("pagehit.php")] in every page of your website OR just copy and paste the entire code and put it at the top of every page of your website and it will work just fine.
File: pagehit.php
<?php
/**
 * a function to count how many times visitors visit a particular page
 *
 * you can call this function by passing a page file to it
 *
 * see at the bottom of this function to see how it is being called
 *
 * notice that argument $page can be any page on your website, but
 * the database code just add all of the page hits together regardless
 * of what page or pages you pass to it!
 *
 * this is where you can modify the database code slightly to store
 * the different page hits individually! it's up to you to modify it!
 *
 * if you don't really care which page gets the most hit and only
 * care about the whole website's total hit, then there is no need to
 * modify this code! just use it "AS IS" and include the file
 * pagehit.php at the top of the index.php front page and don't
 * include this file in any of your pages because the index.php file
 * is the only file we're tracking! nothing else!
 */

public function pageCounter($page, $referer)
     {
      // you might want to pass these connection parameters
      // from external source instead of embedding them like here!

      $hostingserver = 'root';
      $databaseName = 'your_database_name';
      $username = ''; // your database username
      $password = ''; // your database password

      // try to create a PDO connection instance
      try
          {
           $conn = new PDO("mysql:host=$hostingserver;dbname=$databaseName",
                                             $username, $password);
           $conn->setAttribute(PDO::ATTR_ERRMODE, PDO::ERRMODE_EXCEPTION);
          }
      catch (PDOException $e)
          {
           echo 'Cannot connect to the PDO database. ' . $e->getMessage();
          }

      // now try to create a table named pagecounter if it
      // doesn't already exist in the database

      // if it already exists in the database, it will skip this try/catch blocks!

      // in other words, it won't create a table named `pagecounter` because
      // it already exists in the database!

      // however, it will continue executing all codes following the try/catch
      // blocks!

      // FYI:

      // I've found that for some shared hosting's PDO engine doesn't
      // recorgnize this statement:

      // 'CREATE TABLE IF NOT EXISTS'

      // to solve that problem, remove the below statement and create the table
      // manually using PHPmyAdmin or some other means!

      // so you don't actually need to test this condition (below) every time a
      // page is hit! in other words, you don't need to check if the table
      // exists or not, because you already know that a table already have been
      // created; and therefore, there is no need to use the condition
      // code below!

      // just remove the create table condition below and make sure your table
      // have been created already and it will work just fine!

      try
          {
           $sql = $conn->prepare("CREATE TABLE IF NOT EXISTS `pagecounter`
                                    (
                                     `id` int(25) NOT NULL auto_increment,
                                     `page_name` varchar(255) NOT NULL default '',
                                     `referer` varchar(255) NULL default '',
                                     `page_hit` int(25) NOT NULL default '0',
                                     `date_time` datetime NOT NULL default
                                     CURRENT_TIMESTAMP,
                                     PRIMARY KEY  (`id`)
                                    ) TYPE=MyISAM"
                                );

           // execute the query to create the table
           $sql->execute();
          }
      catch (PDOException $e)
          {
           echo 'Cannot create table pagecounter. ' . $e->getMessage();
          }

      // after creating the table, it's time to insert new page hits

      // but first, check to see if there are any page hits already stored
      // in the database

      $query  = $conn->prepare("SELECT * FROM pagecounter
                                         WHERE page_name = :page");

      $result = $query->execute(['page' => $page]);

      // check to see if there are any page hits already stored
      // in the database

      if ($result)
         {
          // yes, there are page hits already stored in the
          // database!

          $result->setFetchMode(PDO::FETCH_ASSOC);

          while ($row = $result->fetch())
              {
               // so just add the new page hit to the total

               $counter = $row['page_hit'] + 1;
              }

          // after adding a new page hit to the total,
          // we need to update the total page hits and as well as
          // updating the rest of the record, too!

          $update  = $conn->prepare("UPDATE pagecounter
                                        SET page_name = :page,
                                            referer = :referer,
                                            page_hit = :counter");

          $update->execute([':page' => $page,
                            ':referer' => $referer,
                            ':counter' => $counter
                           ]
                          );
         }
      else
         {
          // this must be for the first page hit!

          // there are no page hit stored in the database,
          // so we need to store the first page hit in the database

          $stmt = $conn->prepare("INSERT INTO pagecounter
                                  VALUES (?, ?, ?)"
                                );

          $stmt->execute([
                           'page_name' => $page,
                           'referer' => $referer,

                           // since there are no page hits stored in the
                           // database, so it must be the first time,
                           // and therefore, 'page_hit' is set to 1

                           'page_hit' => '1'
                          ]
                         );

          // if you observe the create table code definition
          // and the insert table code above, you'll notice that
          // there are 5 table fields in the create table code
          // while only 3 fields (page_name, referer, and page_hit) are
          // performed in the insert/update table code above.

          // if you look closely in the create table definition
          // you'll notice that the 'id' field contains the
          // "auto_increment" clause that MySQL uses to increment
          // this 'id' automatically starting with number 1 and
          // increments it by 1 each time you insert a row of record.

          // therefore, the 'id' field is not directly handled by
          // programmers -- it is handled by MySQL automatically.

          // likewise, the `date_time` field is not directly handled by
          // programmers, either -- it is handled by MySQL automatically,
          // because it was declared in the definition to use a
          // 'default' date time value, generating a date and time
          // automatically every time an insert or an update operation
          // is taking place.

          // the function CURRENT_TIMESTAMP generates the date and time
          // automatically!

          // so it looks like this:

          // `date_time` datetime NOT NULL default CURRENT_TIMESTAMP


          // self-explanatory!


          // now on to the code flow:

          // since this is the first time a visitor saw this
          // page, we initialize the page to one hit!

          // the next time any visitor visits this page it
          // will not come here in the "else" condition because
          // $result contains some value(s) for the tracking page!

          $counter = 1;
         }

      // return the result of the query back to the caller!
      // this is the number of times the page has been hit by visitors!

      return $counter;
     } // end function pageCounter($page, $referer)

/**
 * now that the function has been written, we can call that function
 * from anywhere!
 *
 * to call that function, you have to include the following snippet
 * of code!
 *
 * put the following code at the top of every page you want to track!
 */

// HTTP headers

// every time the Web runs it fires off the HTTP protocol and PHP has a
// a built-in variable called $_SERVER to grab all of the HTTP headers.

// The superglobal array variable $_SERVER has 32 values, i.e.,

// $_SERVER['REMOTE_ADDR'], $_SERVER['HTTP_REFERER'], $_SERVER['SERVER_NAME'],
// $_SERVER['QUERY_STRING'], $_SERVER['SCRIPT_NAME'], $_SERVER['PHP_SELF'],
// $_SERVER['IP_ADDRESS'], $_SERVER['DNT'], etc.

// and you can view these values by running in your view (index.php)
// page or in any page output code like this:

// print_r($_SERVER);

// here, we grab the page's url using the HTTP protocol,
// particularly the built-in (superglobal) array variable $_SERVER.

// in here, we're just grabbing those HTTP headers, such as the URI or URL,
// including the querystrings. that's what the following code is doing!

// the $_SERVER['PHP_SELF'] code is to refer to the current file itself!
// so if you put $_SERVER['PHP_SELF'] inside a file called index.php, it
// will run that file!

// as for $_SERVER['SERVER_NAME'] is to grab the server name, i.e.,
// example.com.

// as for $_SERVER['HTTP_REFERER'] is to grab the url that the visitor
// just came from!

// for example, if a visitor came to your website from another website
// called http://www.example.com, $_SERVER['HTTP_REFERER'] returns
// http://www.example.com

// as for $_SERVER['QUERY_STRING'] is to grab the url's querystring, the
// string after the '?', i.e.,
// www.example.com/?arg1=value1&arg2=value2&arg3=value3

// so this will look something like these:

// www.example.com/index.php?arg1=value1&arg2=value2&arg3=value3
// www.example.com/catalog.php?arg1=value1&arg2=value2&arg3=value3
// www.example.com/affiliate.php?arg1=value1&arg2=value2&arg3=value3
// www.example.com/mypage.php?arg1=value1&arg2=value2&arg3=value3

/**
 * here are some useful items you might find useful:
 *
 * $visitor_hour = date("h");
 * $visitor_minute = date("i");
 * $visitor_day = date("d");
 * $visitor_month = date("m");
 * $visitor_year = date("y");
 */

$self_url = $_SERVER['SERVER_NAME'] . $_SERVER['PHP_SELF'] . '?' .
            $_SERVER['QUERY_STRING'];

// grab the url of the visitor's last link!

$referer = $_SERVER['HTTP_REFERER'];

// we call pageCounter() and getting a page hit instantly
$page_hit = pageCounter($self_url, $referer);

/**
 * now that we have a page hit we can do whatever we want, such as
 * display it somewhere on the same page. how you use this page hit
 * is up to you, but here we just echoing out to the browser to
 * display the page hit on the same page!
 */

echo $page_hit;

/**
 * what if you want to put the display of the page hit somewhere
 * on your website beside the default front index.php page?
 *
 * in other words, you want to put a hit counter in a different page
 * other than the front index.php.
 *
 * in that case, you have to query the database using the code
 * similar to the following. see a seperate index.php example below.
 *
 * you need to put this code at the very top of your xxx.php page!
 *
 * // try to create a PDO connection instance
 * try
 *     {
 *      $conn = new PDO("mysql:host=$hostingserver;dbname=$databaseName",
 *                                            $username, $password);
 *      $conn->setAttribute(PDO::ATTR_ERRMODE, PDO::ERRMODE_EXCEPTION);
 *     }
 * catch (PDOException $e)
 *     {
 *      echo 'Cannot connect to the PDO database. ' . $e->getMessage();
 *     }
 *
 * $query  = $conn->prepare("SELECT * FROM pagecounter
 *                                    WHERE page_name = :page");
 *
 * $result = $query->execute('page' => $page);
 *
 * if ($result)
 *    {
 *     $result->setFetchMode(PDO::FETCH_ASSOC);
 *     while ($row = $result->fetch())
 *         {
 *          $counter = $row['page_hit'] + 1;
 *         }
 *    }
 *
 * and then you can basically display the hit page anywhere on
 * your xxx.php. for example:
 *
 * <p>Total visits: <?=$counter?>
 *
 * see the "barebone" index.php page below as an example!
 */
?>
The example above can be used to display in the "barebone" index.php front page as well.
Here is a "barebone" index.php front page example to show how to include the pagehit.php file at the top of your index.php front page.
File: index.php
?<php
// here, assuming you name the whole code above as pagehit.php

// this is it! just one line!

// very simple to include a tracking script on
// your index.php front page!

// don't forget to put the file pagehit.php at the same level
// in directory as your index.php

include(pagehit.php);
?>

<!DOCTYPE html>
<html lang="en-US">
<head>
<title>My Home Page</title>
<meta charset="UTF-8">
<meta name="viewport" content="width=device-width, initial-scale=1">
<meta name="language" content="en" >
<link href="./asset/44ab1983/css/style.css" rel="stylesheet">
<script src="./asset/16eb9947/jquery.js"></script>
<style>
html,
body
    {
     width: 100%;
     height: 100%;
     background-color: #e6e6ff;
    }

#product-item
    {
     background-color: white;
     padding-left: 10px;
     padding-right: 10px;
    }
</style>

<script type="text/javascript">
$(document).ready(function()
    {
     public function example(arg)
          {
           // function code
          }
    });
</script>

</head>

<body>
     <div>
         content of the div
     </div>

     <div>
       <table>
         <tr>
           <td>
             td content
           </td>
         </tr>
       </table>
     </div>

     <div>
       content of the div
       <a href="#">link</a>
     </div>
</body>
</html>
There you have it! An easy way to track your website's visitors!!!
Migrating Your Website to a Real "Live" Server
Now that you've got your website with all the bells and whistles, you can migrate it to your live server to make your website live online for your visitors all over the world to see.
There are plenty of web hosting providers out there: both for paid hosting and for free hosting. Just Google the term "free web hosting" and it will give you a lot of results to choose from.
Here is one that I found on the Internet, the one that I use on one of my websites: https://webfreehosting.net/
As with all free web hostings, there are certain things you can and can't do, such as you can't incorporating your payment application to do ecommerce transactions. To be able to do ecommerce transactions, you'll have to subscribe to their paid hosting service that normally costs about $2.99 per month.
For the free basic web hosting plan, you are limited to certain bandwidth as well. For example, according to the basic free plan (advertised as of June 2021), you're allowed only 5 GB of traffic usage per month. If your website generates traffic usage higher than 5 GB per month they will suspend your website for the remainding time for that particular month once your website reaches 5 GB.
Your website will come back online live at the beginning of the next month. Here is what a notification of the suspension look like if your website happens to generate usage traffic higher than the allowable 5 GB (as was the case for one of my websites called www.PostalJobHotline.COM which got the below suspension notification):
Warning: Account Suspended Due to Over-Traffic!
Your account has been temporarily suspended, because you have reached 5.16 GiB of traffic usage and your monthly allowance is 5 GiB. The traffic counter is reset at the end of the month and your account will be restored automatically. If you do not wish to wait that long and want to have your account and websites working please go to Buy Services Upgrade Services section and upgrade to a hosting plan with higher monthly traffic allowance.
So if for some particular month -- especially late in the month -- and you happen to go to one of my websites and you can't access it, it's probably it is being suspended due to over-traffic usage limit. Now you know why sometimes my websites are offline because of the suspension due to over-traffic usage limit.
Not only that, even if you have a paid hosting plan with them and if your website receives a lot of traffic, this hosting provider throttles your bandwidth to slow down your visitors visiting your website, making your website to load very slowly.
An example of that is my website ZeroNilZilch.COM, which receives very heavy traffic, and as a result, this hosting provider throttles my bandwidth, making it very slow to load. So much for a paid hosting plan, huh? Where is the benefit?
You may have already noticed that the website is very slow to load. This is because my website receives very very heavy traffic and this hosting provider throttles my bandwidth traffic.
So please be patience with my website when surfing my website and please keep visiting my website regularly when you need to. I would love to have you all continue making use of the resources in my website on a regular basis.
Thanks!!!
If you compare ZeroNilZilch.COM with the rest of my websites, say, Noon2Noon.COM, or Rainbow180.COM, or PostalJobHotline.COM, ZeroNilZilch.COM takes a long time to load while the others are very fast to load. This is due to this hosting provider throttles my loading speed because of ZeroNilZilch.COM generating very very heavy traffic.
As you can see, even when I follow their policy very religiously and not even anywhere close to breaking their policy, they still impose limits on my website, something that I'm not very happy about. So this is the only one factor that I'm not happy about this hosting provider.
So please read their policy. Also, you need to abide by their policy on all other aspects of the "free plan" to avoid being shut down. So make sure you read their policy on what you can do and on what you "CAN'T" do.
I hope you take this warning seriously because once you're shut down, you can't get another account with the same host provider. You'll have to find another hosting provider.
All hosting providers have policy that they enforce very strictly. So don't loose your hosting account with this hosting that I mentioned above, because it is one of the best hosting providers out there, albeit, they impose bandwidth limits when your website receives very heavy traffic.
I don't know if other shared hostings do this or not. Anyhow, please be mindful of this scenario.
So good luck and have fun with your website, albeit be mindful of the policies placed on your hosting plan.
A Secret
Here is a secret that no one will tell you about this hosting provider mentioned above, but I will: You can actually signup for many hosting accounts with this hosting provider so that you can host as many (of your) websites as you want.
Yes, that is right; you can have your websites hosted by this hosting provider and it is perfectly legal and they won't ban you for hosting multiple websites on their platform. Yes, that is correct! You can host multiple websites on their platform! I repeat: You can host as many websites as you want on their plaform.
All you have to do is signup each account for each of your websites using a unique email address and it will let you signup for multiple accounts to host multiple websites.
My suggestion for you is to create multiple email accounts, say, with Gmail.COM or with any other email services and using those email addresses to signup hosting accounts with this hosting provider to host all of your websites.
Yahoo Mail is also one of the best emai service providers out there and it on par with Gmail service.
I, myself, use both Gmail and Yahoo Mail for my emails needs. I singed up multiple email accounts with both and the best part is that you can signup for an ulimited email accounts and also you can use the same personal information for all accounts as well, but the only requirement is that you need to use unique username, password, and of course, unique email address for each account.
For example, I currently have four Gmail accounts and three Yahoo Mail accounts and I used those email addresses that I signed up to signup for the free webhoting from the web hosting service provider mentioned above.
Remember that one email address is only good for one hosting account to host one website. So if you have multiple websites (as I do), you need to have multiple email addresses so that you can use those email addresses to signup hosting accounts with this hosting provider.
One email address is only good for one website.
You can use (your) same name and same address and the same other information as well.
You don't have to use different name and different other information.
Email address, username, password are the only ones that need to be unique for each account.
One Last Warning:
Please DO NOT abuse your free hosting priviledges. In other words, please read their 'Users Policies' carefully and obey their rules and guidelines.
Just because it is free and you can signup for multiple accounts, it doesn't mean that you can do anything you feel like doing.
So enjoy your multiple hosting accounts for your multiple websites, but be mindful of their rules and guidelines and DO NOT abuse your priviledges.
There you have it!
A secret that no one will tell you about it!!!
But I am telling you that!!!
So good luck and have fun with your websites, albeit be mindful of the policies placed on your hosting plans.
Navigating Through Your Account Dashboard/Webspace
Once you'd signup an account with the above mentioned webhosting service provider, you can login to your account and the dashboard/webspace looks like the following:
On the left side is where it lists your account detail that looks like the following:
As you can see in the dashboard area or webspace area, you have several options to choose to go into more specific tasks. It shows all kinds of options for you to choose.
For example, when you click on an FTP Manager, it takes you to an FTP manager area where you can setup/create FTP accounts.
From there, you can fill out and supplying the various required FTP account information.
After creating an FTP account, now you're ready to upload your website files to your FTP account.
You will need these FTP account information to be used with your FileZilla application to transfer your files to and from your local computer to your FTP account.
See my other tutorial called Introduction to FileZilla.
Next, you need to create database(s) by clicking on the Database Manager and fill out the appropriate information. You will need these information to use with your database "PDO" connection.
See my other tutorial called Introduction to PDO.
At this point, you're done with creating FTP and Database accounts and presumably all your website files have been uploaded to your FTP account and your database tables and content have been created and setup and ready to go.
Next, you need to setup your domain. Look in your dashboard area for a topic called Domain Manager (similar to the one shown in the above illustration under topic called Website Manager). Click on that topic to go to setup your domain and it opens up a domain creation view that looks like the following:
In the above area where you can setup/create your domain accounts by supplying the necessary information.
There are several options to choose from depending on your actual situation. You can actually buy your own domain from this hosting provider on the spot by clicking on 'register a domain'. You can also transfer your domain to this hosting provider if you had registered it with some other domain registrars.
Either way, you're good to go with this hosting provider.
Personally, I recommend you to register your domain with other hosting/domain service providers that can offer you cheap domains. There are plenty of cheap domain service providers out there and one that I use personally is called https://www.namesilo.com/
If you're using domain from other domain service providers, just type the name of your domain in the box under: 'Host an existing Domain', for example: myfirstsite.com. And click on "Host Domain" button. Don't forget to put the "DOT" suffix name after your domain as shown in the example. This can be .com, .net. .org, etc.
If you're using a domain from other domain service providers, make sure that the domain is fully active, otherwise, this hosting is not able to detect your domain from the central server of the World Wide Web Consortium who actually is maintaining the domains as a central location.
The domain service providers are just third parties sellers selling domains from the main body organization called the World Wide Web Consortium.
What really is going on is that this hosting provider checks to see if the domain name that you entered on the input box is registered under your name listed on the World Wide Web Consortium database. The World Wide Web Consortium maintains all domain names in its database.
If the domain you entered is found in the WWWC database and it is registered in your name, then this hosting provider will host your domain in their web server. Otherwise, a message stating the reason as to why your domain is denied hosting.
After that, it should give you some sort of result at the bottom of your domain space if it is hosted successfully with this hosting provider.
In the result that you just created and hosted successfully, look at the heading at the far right side that says "Settings" and click on that topic. It should slides down to reveal more content. Now click on the topic: "DSN" (stands for 'Domain Name Server') and it should slides down further to reveal more content on that topic.
There are lots of options for you to choose, but for beginners, you only need to be concern with the topic called "NS".
Next, look under the heading called "Type" on the left side and scan down to find "NS" which stands for 'Name Server', or short for 'Domain Name Server'.
You need to copy this domain name server (address) so that you can use it to link your domain that you had registered with other domain service provider to your hosting account with this hosting service provider.
In a simplier way of saying is that, this domain name address is used to link your domain name that is residing in your third party domain registrar (or more specifically, residing in the WWWC database) to this web hosting provider. Your third party domain registrar needs this information to link the two servers together.
For example, if you had registered your domain name with other companies, (i.e., namesilo.com), you need to copy this 'Name Server' from this hosting provider and take it to your domain name registrar (namesilo.com) to link it to your domain name stored in the database in the WWWC.
This 'Name Server' will link to your domain name stored in the WWWC database. But you have to link it through your domain registrar.
Once you have the domain name server address (from this hosting provider), you need to go back to your domain service provider that you had registered and had an account with and login to that account so that you can supply this "NS" information to that domain registrar.
In your (third party) domain service provider/registrar's dashboard space, there should be an option that says "Domain Manager" and you need to navigate to that domain manager space and look for some sort of topic called "domain service name entry" or similar to that nature and then supply the "NS" information to it accordingly.
Hint: In your third party domain service registrar, look in the "Domain Manager" and click on one of the options listed on your particular domain. Maybe try clicking on the name of your domain and see what options it reveals.
Different domain service providers have slightly different look and feel, but all of them should have something in common, and that is, a box for you to enter the "NS".
Here is an example of domain entries:
Name Server 1: ns1.example.com
Name Server 2: ns2.example.com
Name Server 3: ns3.example.com
Name Server 4: ns4.example.com
Name Server 5: ns5.example.com
Each of these domain name servers represents one independence server that the company owns. Web hosting providers often have multiple servers so that if one goes down there are some backup servers ready to take over.
For example, this (fake) web hosting company called www.example.com has five servers: ns1, ns2, ns3, ns4, ns5.
As you can see above, there are several domain name servers that you need to enter, but for most hosting providers like the free web hosting service provider that I mentioned above, you only need to supply only two "NS" entries are enough.
In actuality, you're really using only one domain name server: ns1. The second one is just a backup in case the first is down or having problem. These days, servers are very reliable and one server is enough. So take two domain servers to your domain registrar (usually the first two: ns1 and ns2).
Once you've entered the "NS" information and submitted, it will take about 12 hours to take effect, although some domain providers take longer or shorter.
Meanwhile, after about an hour or so after you've submitted your "NS" information, you can try to load your website to see if it's effective or not. I've found that with most domain service providers, it only takes about one hour to take effect and not more. Try it after an hour of the entry and see if it is effective.
At this point, everything has been covered to enable you beginning website developers to able to create websites and host them in a live server. You can keep making improvements to your websites as they get more sophisticated.
There you have it! Have fun with your websites!
My Coding Convention
First of all, this is my coding convention that I've been using over the years as a programmer, in addition to the PSR-1 and PSR-2, and it works very well for me by combining my own convention with the PSR-2.Secondly, every programmer should use some sort of coding standard, whether it's PSR-1, PSR-2, my coding standard, or your own coding standard. You definitely should use a coding standard. A programmer who doesn't use a coding standard is a bad programmer and eventually the code that you write will contain bugs.
The ultimate goal of a coding standard is to maintain consistency and readability so that code can be robust, easy to maintain and easy to locate bugs, and can easily be extensible seamlessly by different groups of developers. Consistency is important because it saves time, resources, and money.
Furthermore, in a multi-task organization, it enables a sense of collaroborated code writing and team work where different groups of developers spread all over the world share the same or similar tasks. Since the code is visible to lots of eyeballs, bug-fixing relies on these teeming eyeballs to actually locate bugs and understand how to solve it. A consistent coding standard solves most of that problem.
There are a few coding standards in use out there: PHP's PEAR project has its own, the Zend Framework has one, WordPress has one too, Drupal derives its standard from the PEAR one, and then there is the PSR-1 coding standard (http://www.php-fig.org/psr/psr-1/), along with the PSR-2 coding style guide (http://www.php-fig.org/psr/psr-2/).
PSR-1 and PSR-2, named "Basic Coding Standard" and "Coding Style Guide," were conceived by the PHP Framework Interop Group, an informal group of representatives from major PHP projects, which offers a place to "talk about the commonalities between our projects and find ways we can work together."
This consortium has studied about best practices in PHP to allow developers to have common coding standards. These best practices are called "PHP Standard Recommendations," also known as PSR. So the PSR-1 and PSR-2 are two sets of coding standard.
Note that even though the consortium's main focus was on PHP, but their standard applies to other languages as well; and my coding standard also applies to other languages as well.
Adding into the mix I have adopted my own coding standard, albeit not very extensive, it serves a useful purpose as a 'bugs-avoidance' standard that other coding standard didn't address. Nowaday, the trend is leaving the default legacy style behind and more and more people are adopting new modern style of coding and my coding convention is a byproduct of that new trend. By 'default legacy' style, I mean the typical coding style many of us are getting used to doing. An example of that is:
<?php
class Foo{
  public test($x) {
    if ($x == 1){
    // do something with $x
    }elseif ($x == 2){
    // do something with $x again
    }elseif ($x == 3){
    // do something with $x again
    }else{
    // do nothing with $x
    }
  }

  private getFoo(){
    for ($i = 1; $i < 10; ++i){
      // do something with $i
    }
  }
}
?>
Notice how ugly and messy the default old legacy style of coding is? The opening parentheses are placed on the same line as the class and method declaration, and the same thing is also true for loops such as for(), foreach(), while(), and condition code blocks such as if/elseif/else.
It's long past its prime and I'm amazed (or have been amazed for a long time) that this default old legacy style are still being used by the majority of the programming world. Well, I'm glad to see that, nowaday, the programming world are starting to realize that the default old legacy style is showing its old age and more and more people in the programming world are beginning to adopt a new trend of coding style.
I'm among those people who gravitated from the old legacy coding style to this new trend of coding style (some long time ago). The new coding style like mine is the way to move forward and leave the old legacy behind where it belonged.
Here is a preview of the new coding style that makes use of a clean and logical hierarchical levels of indentation:
<?php
class Foo
    {
     private $arr;

     public function config()
          {
           return [
                   'id' => 'app',
                   'basePath' => dirname(__DIR__),

                   'component' => [
                                   'request' => [
                                                 'csrf' => 'csrf-app',
                                                ],
                                   'user' => [
                                              'identity' => 'app\model\User',
                                              'autoLogin' => true,
                                              'cookie' => [
                                                           'name' => 'id-app',
                                                           'httpOnly' => true
                                                          ],
                                              'error' => [
                                                          'action' => 'site/error',
                                                         ],
                                             ],
                                  ],
                  ];
          } // end config()

     public function example($arg1 = null, $arg2 = null)
          {
           if (!empty($arg1))
              {
               // do something with $arg1
               foreach ($arg1 as $item)
                     {
                      // do something with $item
                      try
                          {
                           switch ($item)
                                {
                                 case 1:
                                       // do something
                                       if ($something)
                                          {
                                           for ($i = 0; $i < $something; $i++)
                                               {
                                                $dosomething[$i] = getSomething();
                                               }
                                          }
                                       elseif ($otherThing)
                                          {
                                           foreach ($otherThing)
                                                 {
                                                  try
                                                      {
                                                       $doOtherThing = getOtherthing();
                                                      }
                                                  catch (Exception $e)
                                                      {
                                                       // doOtherThing with $e;
                                                      }
                                                  catch (OtherException $o)
                                                      {
                                                       // doOtherThing with $o
                                                      }
                                                 } // end foreach
                                          } // end elseif ($something)
                                 break;
                                 case 2:
                                      // do something
                                 break;
                                 case 3:
                                      // do something
                                 break;
                                 default:
                                      // do something
                                 break;
                                } // end switch
                          } // end try
                      catch (Exception $e)
                          {
                           // Error! Do something with the error $e
                          }
                     } // end foreach
              } // end if $arg1 is not empty
           elseif ($arg2 != null)
              {
               // do ... while and for() loops
               $test = false;
               do
                   {
                    for ($i = 0; $i < count($arg2); ++$i)
                        {
                         if ($arg2[$i] == 1)
                            {
                             $test = true;
                             break;
                            }
                        } // end for()
                   } // end do
               while ($test == false);
              } // end elseif
           else
              {
               // do nothing
               return '';
              }

           $connect = '';
           $attempt = 3;
           while (!$connect AND $attempt > 0)
               {
                $authConn->connect();
                $connect = $authConn->isConnect();
                $attempt = $attempt - 1;
               }
          } // end example()
    } // end class Foo
?>
Summary: The coding standard aims to achieve three objectives:
- Robustness. Robustness should maintain readability, flexibility, consistency, and extensibility that can easily be extensible seamlessly and be well-understood by different groups of developers.
- Bug-free. Use sound coding practices to achieve bug-free.
- Productivity. Productivity translates more money.
Here is my standard, convention, and guideline that I chose to follow:
I use PHP as a language to illustrate these examples but these standard, convention, and guideline apply to other languages as well.
Code MUST follow all rules and guideline outlined in PSR-1 and PSR-2. However, the following guideline takes precedent over PSR-1 and PSR-2 whenever there are collisions. In other words, I adhere to my own standard and guideline before adhering to other standards. So I get myself familiarized with my own standard and guideline first to make sure that I know when a collision can occur. When a collision occurs I use my own standard over the PSR-1 and PSR-2.
These are my coding standard and guideline:
- Naming convention.
- Use camelCase, not_under_scores_, for class names and function/method names. For example: siteController -- as appose to site_controller; arrayAccessTrait -- as appose to Array_Access_Trait. Avoid using _under_scores_ for single word names as well, for example, using get() as appose to _get(), set() as appose to _set(), unset() as appose to _unset(), etc.
- Use lower case for file names, even if the name contains multiple words, e.g., myindexfile, privateimagefile. DO NOT use _under_scores_ in file names. This is illegal: my_index_file.php.
- Use _under_scores_ for variable names, and arguments names. Example: item_1, num_1. Add($annual_salary, $current_bonus).
See exception below. - Always use singular, not plural, for all naming convention. This includes all class, method/function, variable names and directory names.
For example, addValue() instead of addValues(); getTwoRow() instead of getTwoRows(); getView() instead of getView(); Theme instead of Themes; ad instead of ads; lib instead of libs; site instead of sites; user instead of users; arg instead of args; item instead of items; and so forth.
The most popular variables that most programmers use are: view, model, controller, params, users, items, libs, utils, pages, files, args, lines, rows, images, assets, etc. While it may seems very logical to use plural to name class, method, and variable names to reflect the true description of the variables, it is a very bad idea and it will cause confusions and problems later on.
Let's face it, we all use proper grammar in our everyday language and it becomes a natural thing to do as well when it comes to programming when naming class, method, and variable names convention. We have a tendency to use proper grammar in our programming work. It's also a habit that is hard to break.
But it's a habit that we should try to break away from and not following it in programming. So proper grammar is not the best way to program. So please avoid using pluralities. It creates confusions and bugs later on. ALWAYS USE SINGULAR! PERIOD! - Use a clear distinct naming convention for all class, method, argument, and variable names. Avoid using the same word as verb/noun to declare two distinct variables, for examples: rate (verb) and rater (noun), use (verb) and user (noun), code (verb) and coder (noun), serve (verb) and server (noun), or even page (noun) and pager (noun), etc. Furthermore, avoid using past tense as well. For example, use connect instead of connected, etc.
Do not use something like these either: usr and user for two distinct variables; or user/users for two distinct variables (no plural is allowed--only singular); or use/usr/users for three distinct variables; or route/routes/router/routers for four distinct variables (again no plural is allowed--only singular); or use/used/user/users for four distinct variables (again no past tense and plural are allowed).
If you insist on having the same lexicon in your variables, just add _under_scores and additional variables and some suffix identification to your lexicon word. For examples, user_new_1, user_old_2, user_var_1, route_1, route_2, etc. Just keep in mind that a good naming convention gives less problems later on. A good rule of thumb is, make it very distinct from one another. - Exception: Enumerate the naming convention is ok (like: $num1, $num2, $num3, $arr1, $arr2, $arr3, $arg1, $arg2, $arg3, $param1, $param2, $param3, etc.); however, please try to limit its use to an absolute minimum.
- Class Constants: Class constants must be all upper case letters (e.g., DEMO, PROFILE, DASHBOARD) and if multiple words are used (e.g., DEV_DEBUG, EVENT_BEFORE_ACTION, CORE_ROOT_DIR) _under_scores_ must be used to seperate the multiple words. Notice that the word dashboard is considered as a single word.
- camelCase: A camelCase is when you have multiple words as one word and that word begins with a lower case letter for the first sub-word and the rest of the sub-words' initial letter are upper case letters. For examples, the word 'camel case' becomes camelCase; the word 'error exception trait' becomes errorExceptionTrait; the word 'my product category list' becomes myProductCategoryList.
- Use lower case for the most part except when camelCase is warranted. And for single-word method/function, class names can be an upper case letter for the beginning letter and the rest are lower case letters. Or it can be all lower case letter but cannot be all upper case letters. For example, these are ok: Add(), add(), but these are not allowed: ADD(), $ITEM, $PARAM, $LIB, etc.
If you use an upper case letter for the initial letter of the single-word names, make sure to stick to that convention and if you use lower case for the initial letter of the single-word names, also be consistent and stick to that convention as well. Be consistent! - Important: Failure to adhere to these naming convention and other guidelines outlined in here can cause your code to contain bugs later on.
- Naming a file name the same as its class name. For example, class errorExceptionTrait has its file being named as errorexceptiontrait.php. For any other files, they don't have to have the same name.
- Naming all folder names without using _under_scores_ even if there are multiple words. For example, naming your folders as AdminController as appose to Admin_Controller, VendorComponent as appose to Vendor_Component, LibUtil as appose to Lib_Util, etc. No plural is allowed as well. So name your folders as image as appose to images. Yes, it seems like overwhelming majority of programmers like to name their folders as 'images' as appose to 'image' because it makes a logical sense to name their folders using plural to hold images. Always use singular. Period! No 'and', 'if', or 'but'.
- Summary: So the key point to remember is that ONLY variables can contain _under_scores_. Anything else cannot contain _under_scores_.
- Always comment your class, method, and function ending demarcations if your code is lengthy. For shorter code, you can go without the comment. This helps you and others follow the logic of your code. For example, assuming you have a lengthy code:
<?php
class Foo
    {
     public addValue($x, $y)
          {
           // method body
          } // end addValue()

     private getFoo()
           {
            // method body
           } // end getFoo()
    } // end class Foo

?>
Notice the comments: // end addValue(), // end getFoo(), // end class Foo
- Always comment your condition blocks ending demarcations if your code is lengthy. This includes: if/else/else if/ and other condition blocks such as while, do ... while, and for loop blocks such as for() and foreach(), and for try ... catch() blocks as well. For shorter code, you can go without the comment. This helps you and others follow the logic of your code. For example, assuming you have a lengthy code:
<?php
class Foo
    {
     if ($expr1)
        {
         // lengthy multiple statements code block
         // lengthy multiple statements code block
         // lengthy multiple statements code block
        } // end if ($expr1)
     elseif ($expr2)
        {
         // lengthy multiple statements code block
         // lengthy multiple statements code block
         // lengthy multiple statements code block
        } // end elseif ($expr2)
     else
        {
         // lengthy multiple statements code block
         // lengthy multiple statements code block
         // lengthy multiple statements code block
        } // end else if ($expr2)

     try
         {
          // lengthy multiple statements code block
          // lengthy multiple statements code block
          // lengthy multiple statements code block
          // lengthy multiple statements code block
         } // end try block
     catch (Exception $e)
         {
          // lengthy multiple statements code block
         } // end Exception $e
     catch (OtherException $o)
         {
          // lengthy multiple statements code block
         } // end OtherException $o
    } // end class Foo
?>
Notice the comments:
     // end if ($expr1), // end elseif ($expr2), // end else if ($expr2)
     // end try block,   // end Exception $e,    // end OtherException $o
     // end class Foo
- Killing Tabs. When you indent your code (or line statements) make sure to kill all tabs; because if you don't, the indentation that contains tabs will not aligned properly from one editor to the next if you use multiple editors. Yes, all of us use different editor all the time. Furthermore, even the same editor that you use regularly will behave differently if you upgrade its version from one version to the next. So make sure to kill all tabs. Period!
Tabs are text editor's special feature that enable you to speed up the moving of spaces by skipping the individual space when you press the "tab" button or the "advance forward" horizontall bar or the "return" key (or bar).
In other words, when you press the "return" key the editor will jump pass the beginning of the line to the level that the immediate previous line starts, so that the beginning line of your code align with the beginning line of the previous line. All editors have this feature to save time of moving the beginning of your line to align it with the beginning of the previous line.
Contrary to popular opinions, this so called "speed up" feature of the editors is actually slowing down the over all productivity of your finished (programming) products.
How so? For one, if you're familiar with the Python programming language, you know that tabs can and do alter the meaning of the code you are writing; second, some Javascript interpreters see tabs as foreign objects and behave un-expectedly. There are other bad behaviors that tabs can cause your programing code to slow down your productivity and I don't want to list them here and only want to hi-light a few to let you know that tabs in programming generally is bad.
So you don't want this default feature of the editor to mess your indentation by not killing them. So always kill all tabs. - Shorthand Arrays. Shorthand array syntax
[...elements...]is used instead of the regular long formarray(...elements...).And (shorthand) arrays used in the configurations can optionally contain a comma (",") as well at the end of the array element list. As examples, the below configurations contain a comma following the last array element [particularly 'charset => utf8' for shorthand array] even though there isn't another array element following it.As a matter of fact, both regular arrays and shorthand arrays can contain a comma (",") at the end of the array element list. This is legal (for both) and you can choose to put it there or take it out and it is perfectly fine. It's not a requirement to have a comma at the end of the last array element. So it's up to your personal preference.
However, this coding standard strongly recommends putting a comma after all array elements because it avoids bugs. The reason that it is legal to have a comma after the last array element is to speed up coding process and avoid bugs. So it is strongly suggested that you put a comma after the last array element to avoid bugs.
Here is a snippet of code using the regular array:
$requirement = array(
                     array(
                           'name' => 'PHP Some Extension',
                           'mandatory' => true,
                           'condition' => extension_loaded('some_extension'),
                           'by' => 'Some application feature',

                           // notice the comma after this last array element!
                           'memo' => 'PHP extension "some_extension" required',
                          ),    // <== notice the comma! this is perfectly legal!
                    );
In the following, a configuration is used to create and initialize a database connection. Notice the comma following the array element 'charset => utf8' even though there isn't another array element following it:
$config = [
           'class' => 'core\db\Connection',
           'dsn' => 'mysql:host=127.0.0.1;dbname=demo',
           'username' => 'root',
           'password' => '',
           'charset' => 'utf8',  // <== notice the the comma! it's perfectly legal!
          ];
$db = core::createObject($config);
If you look at the example preview earlier [in the function config()], you'll see shorthand arrays are being used and all last elements of the arrays have a comma after each of the last element of the arrays. So it is definitely recommended that shorthand arrays and a comma on the last element of the array are being used -- on your own programming chores -- because it is much cleaner and easier to visualize, and most importantly, it speeds up your application development by eliminating bugs and unnecessary syntax corrections.
- Readability. There must be a space between variables and arithmetic signs/operations, comment demarcation, comparison/assignment operations. For examples:
   $a = $b + $c; // add b to c
   Do not do this: $a=$b+$c; //add b to c

   if ($b == $c)
   Do not do this: if($b==$c)

   Do not do this: for($i=0;$i<10;$i++)
   Do this instead: for ($i = 0; $i < 10; $i++)
- Class and function hierarchical structures and indentations
Most modern coding conventions indent only four spaces for all code hierarchical structures, and because keywords have different lengths, it causes the hierarchical levels of indentation to look weird and not very clean. For example, to indent four spaces for the class, it looks like this:
class Example
    {
    }
That looks very good, but on longer reserved/keywords like public, private, protected, static, etc., it looks awful. For examples:
public class Example
    {
    }

private class Example
    {
    }

protected class Example
    {
    }

static class Example
    {
    }

Or for conditional structures:

if (condition)
    {
    }
else
    {
    }
elseif
    {
    }

foreach
    {
    }
As you can see, indenting four spaces for all code structures, [although very uniformed], is a bad idea, and it looks weird visually and logically. That's why I chose to indent the code according to the length of the reserved keyword.
For a better view of the examples of hierarchical structures and indentations that make use of the reserved keywords, see the preview example earlier or the following examples.
The guidelines for class and function structures and indentations follow what I call a common sense rule, and that is, the placement of parentheses, spaces, indentations, and braces are placed based on the position of the clause either at the end of the keyword or one space after the keyword in the case for short keywords.
For long keywords like abstract, private, protected, etc. (public is o.k.), you can indent just five positions to align with 'public' and it's fine. Although indent the full keyword is o.k., too. See examples for a better visualization.
DO NOT place the opening parenthesis on the same line as the class, method definition, and do not place the closing parenthesis on the same line as the last statement. The opening and closing parentheses should be aligned vertically and indented the exact amount of spaces. The following is the default, old fashion style of coding. It's past its legacy. So don't do this:
class Example {
     private $myVar;

     public myMethod($x) {
      // ... code
      return $x; }

     // ... more class code here!
}
Nowaday, the trend is leaving the legacy style behind and more and more programmers are adopting new modern style of coding and my coding convention is a byproduct of the new trend. So do these instead:
<?php
class Foo
    {
     /**
      * class body declaration.
      * notice the four spaces indentation of the class' opening "{" and
      * the five spaces indentation of the method declaration: public.
      * notice also that the opening/closing parentheses are aligned vertically at the
      * same level, and all respective code body are inside the parentheses.
      * it looks very clean and easy to follow the logic of the code flow.
      */
     public $arr = array();
     private $dbConnection;

     public addValue($x, $y)
          {
           // method body
           // notice that the indentation and placement of the opening "{" and
           // closing "}" directly leveled with the last letter of its keyword.
          }

     private getFoo()
           {
            // method body
            // notice that the indentation and placement of the opening "{" and
            // closing "}" directly leveled with the last letter of its keyword.
           }

     protected getBar()
             {
              // method body
              // notice that the indentation and placement of the opening "{" and
              // closing "}" directly leveled with the last letter of its keyword.
             }

     // this is ok, too, and is preferred, indent five spaces to align with
     // 'public' which is the most commonly use visibility clause
     protected setFoo($x)
          {
           // method body
          }

     public addFoo()
          {
           // method body
          }

     // this is ok
     abstract protected function zeroBar();
            {
             // method body
            }

     // this is ok, too, indent five spaces to align with 'public' which is
     // the most commonly use visibility clause
     abstract arrayHelper()
          {
           // code body here for this abstract method
          }

     public static function bar()
          {
           // method body
          }

     // this is ok, too
     private static function bar()
           {
            // method body
           }

     // this is ok, too, indent five spaces
     private static function bar()
          {
           // method body
          }

     final public static function bar()
         {
          // method body
         }

     // same as above
     final private static function bar()
         {
          // method body
         }

     static function bar()
          {
           // method body
          }

     // this is ok, too
     function bar()
            {
             // method body
            }

     // this is ok, too, indent five spaces to align with 'public'
     function bar()
          {
           // method body
          }

     // this is ok, too, because it has at least five spaces indented for body code
     function bar()
     {
           // code body.
           // notice the placing of "{}" at the same level as the method declaration.
           // notice also the indented five spaces for coding statements
           // starting position
           // .....
     }
    } // end class body
   ?>
Notice that the parentheses are aligned vertically at the same level of indentation. This applies to all other code blocks/structures that contain parentheses, e.g., if/elseif/else, for() and foreach() loops. This makes it very easy to visualize the block of code, especially if the code is very lengthy.
Note also that the examples showed multiple styles of indentation, but you need to decide which one is more suited to your style and stick with it consistently and do not use one variation for certain project and another for another project. Be consistent and choose one style and stick with it for the long haul.
Traits: Traits are special form of class and they are similar to a normal class.
trait ArrayHelper
    {
     // main body code of a trait
    }
CSS: For CSS and other languages (such as Javascript, Java, C#, C/C++, etc.) do follow the guideline outlined in this coding standard and follow a five-space rule to align with 'public' visibility clause. For examples:
<style>
html,
body
    {
     width: 100%;
     height: 100%;
     background-color: #e6e6ff;
    }

#product-item
    {
     background-color: white;
     padding-left: 10px;
     padding-right: 10px;
    }

div .some-selector
    {
     background-color: white;
     width: 400px;
     height: 200px;
    }

.nav li > form > button.logout
    {
     padding: 15px;
     border: none;
    }

a.asc:after, a.desc:after
    {
     position: relative;
     top: 1px;
     display: inline-block;
     font-family: 'Glyphicons Halflings';
     font-style: normal;
     font-weight: normal;
     line-height: 1;
     padding-left: 5px;
    }

a.asc:after
    {
     content: "\e151";
    }

a.desc:after
    {
     content: "\e152";
    }
</style>

<script type="text/javascript">
$(document).ready(function()
    {
     public function example(arg)
          {
           // function code
          }

     // this is ok, too
     function example(arg)
            {
             // function code
            }

     // this ok, too, to align with 'public'
     function example(arg)
          {
           // function code
          }

     // this ok, too
     static public function example(arg)
          {
           // function code
          }
    });
</script>
Notice the braces are aligned vertically and indented at the same amount of spaces (5).
HTML: Always use lower-cased letters for HTML tags with the exception of the doctype interface. The heading code (or tags), e.g., meta, link, script, etc need not be indented but the css, javascript code, and the code inside the body tag MUST be indented of at least three spaces and can be indented up to six spaces. For example:
<!DOCTYPE html> <html lang="en-US"> <head> <title>Untitled</title> <meta charset="UTF-8"> <meta name="viewport" content="width=device-width, initial-scale=1"> <meta name="language" content="en" > <link href="./asset/44ab1983/css/style.css" rel="stylesheet"> <script src="./asset/16eb9947/jquery.js"></script> <style> html, body { width: 100%; height: 100%; background-color: #e6e6ff; } #product-item { background-color: white; padding-left: 10px; padding-right: 10px; } </style> <script type="text/javascript"> $(document).ready(function() { public function example(arg) { // function code } }); </script> </head> <body> <div> content of the div </div> <div> <table> <tr> <td> td content </td> </tr> </table> </div> <div> content of the div <a href="#">link</a> </div> </body> </html> - Control hierarchical structures
For a better view of the hierarchical structures and indentations, see the preview example earlier.
if, elseif, else
An if structure looks like the following. Note the placement of parentheses, indentation of spaces, and braces; and that else and elseif are aligned vertically on different lines as the closing brace from the earlier body. Notice also the use of braces to group a single statement even though it is not required. Doing so improves readability and eliminates unforced errors.
DO NOT place the opening parenthesis on the same line as the condition expression, and do not place the closing parenthesis on the same line as the elseif/else condition expression. This applies to other control clauses as well, such as foreach, while, do ... while, etc.
<?php
if ($expr1)
   {
    // single statement block. notice the use of braces even though it is not required!
   }
elseif ($expr2)
   {
    // elseif code block. single statement block
   }
elseif ($expr3)
   {
    // multiple statements code block
    // multiple statements code block
    // multiple statements code block
   }
else
   {
    // else single statement block code block
   }
switch, case
A switch structure looks like the following. Note the placement of parentheses, indentation of spaces, and braces. The case statement MUST be indented for the length of the keyword 'switch' from switch, and the break keyword (or other terminating keyword) MUST be indented at the same level as the case block. Statements inside the case block MUST indent to the start if case condition's first position. For example, if case 0, the indentation of the case statements should align vertically with '0'. There MUST be a comment such as // no break when fall-through is intentional in a non-empty case block (see case 1, 2, 3, 4). Notice that there are no break clauses in any of them.
DO NOT place the opening parenthesis on the same line as the switch condition expression, and do not place the closing parenthesis on the same line as the last break clause of the switch clause. This applies to other control clauses as well, such as foreach, while, do ... while, etc.
<?php
switch ($expr)
     {
      case 0:
           echo 'First case, with a break';
      break;
      case 1:
           echo 'Second case, which falls through';
           // no break
      case 2:
      case 3:
      case 4:
           echo 'Third case, return instead of break';
           return;
      default:
           echo 'Default case';
      break;
     }
while, do while, for, foreach, try, catch
The guidelines for all these clauses are basically identical to one another and follow what I call a common sense rule, and that is, the placement of parentheses, spaces, indentations, and braces follow the guidelines outlined thus far. So looking back at the indentation of the switch clause we can see that the indentation is to the length of the keyword 'switch'. This applies to the rest of the clauses as well. So a while statement looks like the following. Note the placement of parentheses, spaces, indentation of spaces, and braces. The braces are all on seperate lines from the clause, even for a (do ... while) condition.
<?php
while ($expr)
    {
     // structure of code block
    }
Similarly, a do while statement looks like the following. Notice the placement of braces.
<?php
do
 {
  // structure of code block;
 }
while ($expr);
It can also be like the following as well. Notice the placement of braces which aligned directly with the end of the keyword 'while'.
<?php
do
    {
     // structure of code block;
    }
while ($expr);
A for() loop structure is also identical to other condition clauses and follow what I call a common sense rule that looks like the following. Note the placement of parentheses, spaces, and braces. Notice the indentation to the first position after a space following the keyword 'for'. This rule applies to try, and catch as well but not to foreach() in which it indents to the last position of the keyword 'foreach'.
<?php
for ($i = 0; $i < 10; $i++)
    {
     // for code block
    }
A foreach statement looks like the following. Note the placement of parentheses, spaces, and braces. It indents to the last position of the keyword 'foreach'.
<?php
foreach ($iterable as $key => $value)
      {
       // foreach code block
      }
A try...catch block looks like the following. Note the placement of parentheses, spaces, and braces. The braces indents one space past the last position of the keyword 'try' to align the braces of the 'catch' clause.
<?php try { // try code block } catch (FirstExceptionType $e) { // catch code block } catch (OtherExceptionType $e) { // catch code block } - Closures
Closures MUST be declared with NO space after the function keyword, and a space before the use keyword, but no space after the use keyword.
The opening brace MUST go on a seperate line as is typically for all braces, and the closing brace MUST go on the next line following the body as is typically for all braces.
There MUST NOT be a space after the opening parenthesis of the argument list or variable list, and there MUST NOT be a space before the closing parenthesis of the argument list or variable list.
In the argument list and variable list, there MUST NOT be a space before each comma, and there MUST be one space after each comma. Closure arguments with default values MUST go at the end of the argument list.
A closure declaration looks like the following. Note the placement of parentheses, commas, spaces, indentations (five spaces) and braces:
<?php
$closureWithArg = function($arg1, $arg2)
     {
      // body
     };
Or you do this:
<?php
$longArg_noVar = function(
                          $longArgument,
                          $longerArgument,
                          $muchLongerArgument
                         )
     {
      // code body
     };

$noArg_longVar = function()
     use(
         /* notice naming variables using enumerated variables, */
         /* although $longVar1 is fine */
         $longVar1,
         /* notice naming variables using enumerated variables, */
         /* although $longVar2 is fine */
         $longerVar2,
         /* notice naming variables using enumerated variables, */
         /* although $longVar3 is fine */
         $muchLongerVar3
        )
     {
      // code body
     };

$longArg_longVar = function(
                            $longArgument,
                            $longerArgument,
                            $muchLongerArgument
                           )
     use(
         // readability: indents some spaces
         $longVar1,
         $longerVar2,
         $muchLongerVar3
        )
     {
      // code body
     };

// this is ok too
$longArg_shortVar = function(
                             $longArgument,
                             $longerArgument,
                             $muchLongerArgument
                            ) use($var1)
     {
      // code body
     };

// this is ok, too
$shortArg_longVar = function($arg) use(
                                       $longVar1,
                                       $longerVar2,
                                       $muchLongerVar3
                                      )
     {
      // code body
     };
Note that the formatting rules also apply when the closure is used directly in a function or method call as an argument.
<?php
$foo->bar(
          $arg1,
          function($arg2) use($var1)
              {
               // code body
              },
          $arg3
         );
A Brief Few Words About the Use() Function
Use() is a PHP special function that allows the passing of anonymous function argument variables into the code block of the closure. For example, in the above closure, use() contains one argument called $var1 and this $var1 argument variable is passed in from the outside and gets used by the anonymous function.
If you look at the next one up from the one above, that use() contains three argument variables called $longVar1, $longerVar2, and $muchLongerVar3, and these three argument variables are passed in from the outside. For more on user(), please checkout PHP documentation.
The following are not my coding standard -- they are from PSR-1 and PSR-2, and if overlapping, my coding standard above should take precedent and override these third-party standards. If any standard in these two versions, PSR-1 and PSR-2, are overlapping, PSR-2 takes precedent over PSR-1.
Please visit their website for more. Here is a summary of the third-party standards.
- Third-Party Standards
PSR-1 - Basic Coding Standard
PSR-2 - Coding Style Guide
Introduction
Some noteworthy rules:
Use camelCase, not_underscores, for variable names, function names, method names, and arguments names.
PSR-1 - Basic Coding Standard
Files MUST use only UTF-8 without BOM for PHP code.
Files SHOULD either declare symbols (classes, functions, constants, etc.) or cause side-effects (e.g. generate output, change .ini settings, etc.) but SHOULD NOT do both.
Namespaces and classes MUST follow an "autoloading" PSR: [PSR-0, PSR-4].
Class names MUST be declared in StudlyCaps.
Class constants MUST be declared in all upper case with underscore separators.
Method names MUST be declared in camelCase.
Namespace and Class Names
Namespaces and classes MUST follow an "autoloading" PSR: [PSR-0, PSR-4].
This means each class is in a file by itself, and is in a namespace of at least one level: a top-level vendor name.
Class names MUST be declared in StudlyCaps.
Code written for PHP 5.3 and after MUST use formal namespaces.
For example:
<?php
// PHP 5.3 and later:
namespace Vendor\Model;

class Foo
    {
	 // code block
    }
Code written for 5.2.x and before SHOULD use the pseudo-namespacing convention of Vendor_ prefixes on class names.
<?php
// PHP 5.2.x and earlier:
class Vendor_Model_Foo
    {
	 // code block
    }
Class Constants, Properties, and Methods
The term "class" refers to all classes, interfaces, and traits.
Constants
Class constants MUST be declared in all upper case with underscore separators. For example:
<?php
namespace Vendor\Model;

class Foo
    {
     const VERSION = '1.0';
     const DATE_APPROVED = '2012-06-01';
    }
Properties
This guide intentionally avoids any recommendation regarding the use of $StudlyCaps, $camelCase, or $under_score property names. Whatever naming convention is used SHOULD be applied consistently within a reasonable scope. That scope may be vendor-level, package-level, class-level, or method-level.
Methods
Method names MUST be declared in camelCase().
PSR-2 - Coding Style Guide
Overview
- Code MUST follow a "coding style guide" PSR [PSR-1].
- Code MUST use 4 spaces for indenting, not tabs.
- There MUST NOT be a hard limit on line length; the soft limit MUST be 120 characters; lines SHOULD be 80 characters or less.
- There MUST be one blank line after the namespace declaration, and there MUST be one blank line after the block of use declarations.
- Opening braces for classes MUST go on the next line, and closing braces MUST go on the next line after the body.
- Opening braces for methods MUST go on the next line, and closing braces MUST go on the next line after the body.
- Visibility MUST be declared on all properties and methods; abstract and final MUST be declared before the visibility; static MUST be declared after the visibility.
- Control structure keywords MUST have one space after them; method and function calls MUST NOT.
- Opening braces for control structures MUST go on the same line, and closing braces MUST go on the next line after the body.
- Opening parentheses for control structures MUST NOT have a space after them, and closing parentheses for control structures MUST NOT have a space before.
Example
This example encompasses some of the rules below as a quick overview:
<?php
namespace Vendor\Package;

use FooInterface;
use BarClass as Bar;
use OtherVendor\OtherPackage\BazClass;

class Foo extends Bar implements FooInterface
    {
     public function sampleFunction($a, $b = null)
          {
           if ($a === $b)
              {
               bar();
              }
           elseif ($a > $b)
              {
               $foo->bar($arg1);
              }
           else
              {
               BazClass::bar($arg2, $arg3);
              }
          }

     final public static function bar()
         {
          // method body
         }
    }
What is the difference between a class and an object ?
Both class and object have the same meaning and both achieve the same purpose but differ only in the way they're implemented and used.
A class consists of constant variables, properties, and methods. Those are the three basic attributes of a class. That's all a class is: it has three attributes -- a very simple concept and yet very powerful.
Consider the following class definition:
<?php
class MyClass
    {
     /**
      * 1st attribute of the class MyClass:
      *
      * the purpose of the 1st attribute of the class is to store content values that are
      * constant and can't change its values during the lifecycle of the application
      *
      * as you can see below, the constant variables (declared in uppercase letters) are
      * called COMMAND_BEFORE_START, COMMAND_AFTER_START, COMMAND_EVENT_START, COMMAND_MESSAGE.
      *
      * their constant values are: before_start, after_start, command_start, etc., respectively.
      *
      * these values: before_start, after_start, command_start, et al, cannot change during the
      * lifecycle of the application. they are constant values that cannot change!
      */

     // declaring class constant variables
     // COMMAND_EVENT_START, COMMAND_BEFORE_START, COMMAND_AFTER_START are constant variables
     // command_start, before_start, after_start are constant values

     // this value 'before_start' will not change during the lifecycle of the application
     const COMMAND_BEFORE_START = 'before_start';
     // this value 'command_start' will not change during the lifecycle of the application
     const COMMAND_EVENT_START = 'command_start';
     // this value 'after_start' will not change during the lifecycle of the application
     const COMMAND_AFTER_START = 'after_start';

     // this value: 'An object is just a copy of the class.'
     // will not change during the lifecycle of the application
     const COMMAND_MESSAGE = 'An object is just a copy of the class.';

     /**
      * 2nd attribute of the class MyClass:
      *
      * the purpose of the 2nd attribute of the class is to store content values that are
      * constantly changing (its values) during the lifecycle of the application.
      *
      * as you can see below, the property variables (declared with visibility control) are:
      * $make, $model, $color.
      *
      * these property variables can and do change during the lifecycle of the application,
      * even though, they are initialized with the initial values in the same fashion as the
      * 1st attribute constants (which are initialized with the initial constant values).
      *
      * the difference is that the 1st attribute variable values cannot change while the 2nd can.
      *
      * you'll see in the example code shown later that these 2nd attribute variables
      * get assigned new values every time a constructor is called.
      *
      * so all 2nd attribute property variables often get their values change frequently during
      * the lifecycle of the application.
      *
      * these 2nd attribute property variables must be declared prefacing with visibility control:
      *
      * public, protected, private
      *
      * public, protected, private are called visibility control or access control.
      */

     public $make = 'Toyota';      // this value 'Toyota' will change during the lifecycle of the application
     protected $model = 'Tundra';  // this value 'Tundra' will change during the lifecycle of the application
     private $color = 'grey';      // this value 'grey' will change during the lifecycle of the application

     /**
      * 3rd attribute of the class MyClass:
      *
      * the purpose of the 3rd attribute of the class is to calculate and manipulate
      * the content values that contain in the 1st and 2nd attribute property variables.
      *
      * you'll see in the example code shown later that the 3rd attribute's purpose is to
      * calculate and manipulate the values contain in the 1st or 2nd attribute variables.
      *
      * likewise, these 3rd attribute methods and functions must be declared prefacing with
      * visibility control: public, protected, private
      *
      * public, protected, private are called visibility control or access control.
      *
      * in this example class definition, we have two (3rd) attributes that manipulate or
      * display messages.

      * notice in the constructor, the 2nd attribute values get assigned to new values constantly.
      *
      * For example:
      */

     // notice that you can pass in whatever make, model, or color to this constructor
     public function __construct($make, $model, $color)
          {
           // notice that this constructor, which is also a member of the 3rd attribute type, calculates and
           // manipulates the content values that contain in the 1st and 2nd attribute property variables.

           // $this refers to the current object or class, which is 'MyClass'

           // make refers to this class MyClass' property $make declared above
           $this->make = $make;

           // model refers to this class MyClass' property $model declared above
           $this->model = $model;

           // color refers to this class MyClass' property $color declared above
           $this->color = $color;
          }

     public function test1()
          {
           // notice that this function test1(), which is also a member of the 3rd attribute type, calculates and
           // manipulates the content values that contain in the 1st and 2nd attribute property variables.

           // $this refers to the current object or class, which is 'MyClass'

           // will output: An object is just a copy of the class.
           echo $this->COMMAND_MESSAGE;

           // will output whatever string got passed in via the constructor, for example: Ford
           echo $this->make . ", ";

           // will output whatever string got passed in via the constructor, for example: F-150
           echo $this->model . ", ";

           // will output whatever string got passed in via the constructor, for example: Grey
           echo $this->color;
          }

     public function test2($str)
          {
           // notice that this function test2(), which is also a member of the 3rd attribute type, manipulates and
           // displays the content values that contain in the 1st and 2nd attribute property variables.

           // will output whatever string got passed in via $str
           echo $str . "\n";
          }
    }
?>
And then consider the following object creation using the keyword new, which mean to create an instance of a class -- or to create a copy or a clone of a class.
$str = 'An object is just a copy of the class.';

// notice that the keyword new means to create an instance of a class -- or to create a copy or a clone of a class

// creating an instance of MyClass()
// $obj is an instance of the class MyClass. it is a copy or a clone of MyClass.
$obj = new MyClass();

$obj->test1($str);
// will output an error message saying argument $str is undefined in test1().

$obj->test1();
// will output ---->  An object is just a copy of the class.
// will output -----> Ford, F-150, Grey

$obj->test2();
// will output an error message saying test2() requires at least one argument.

$obj->test2($str);
// will output -----> An object is just a copy of the class.


In the above example, we create an object using keyword new. But an object can be created using a type hint as well.

You will often see objects being created using a type hint in a lot of code, particularly in other languages like
Java, C/C++, Delphi, Python, etc. A type hint is a class that derives an object that following it -- it is a
hint about what an object of which class.

In PHP, we can have type hint as well, for example:

class Foo
    {
     public $bar; // $bar is a property that will hold a type hint object
     public $zar; // $zar is a property that will hold a type hint object


     As you can see in the constructor below, it has a 'type hint' called Bar and Zar, which create
     objects called $bar and $zar, respectively.

     // notice the 'type hints' which indicate that $bar and $zar are ojects of Bar and Zar, respectively

     public function __construct(Bar $bar, Zar $zar)
          {
           // constructor body

           $this->bar = $bar; // now $this->bar holds an object created by a 'type hint'
           $this->zar = $zar; // now $this->zar holds an object created by a 'type hint'
          }
    }

Now you can do anything with the objects: $this->bar and $this->zar anywhere within this class Foo.

Here are some more examples that show 'type hint':

public function __construct(TaxManager $tax)

As you can see in the constructor, it has a 'type hint' called TaxManager, which is a class, and also,
it has an object called $tax.

So $tax is just a copy or a clone or an instance of the class TaxManager.

Suppose that class TaxManager has a property called $taxRate and a method called calculateTax(),
we can use the $tax object to refer to class TaxManager's member variables/properties and methods
like you normally would with an object created using 'new' keyword. for example:

public function __construct(TaxManager $tax)
     {
      $this->taxrate = $tax->taxRate; // here, we're using an object $tax to refer to $taxRate
      $this->tax = $tax->calculateTax(); // here, we're using an object $tax to refer to calculateTax()
     }

In the above example constructor code, be careful when passing arguments. You have to
pass it like this: Invoice(new TaxManager()), assuming Invoice is the class containing the constructor above.

// Here is an example as an array object:

class NeuralNetwork
    {
     private $input = array(); // input information
     private $hidden_layer = array(); // layers in the network

     public function __construct(array $input) // notice the 'type hint' which indicates $input is an array variable
          {
           // constructor body
          }
    }

In the case of array object, array(), it tells us that $input is of type array.

In Java, you'll often see a lot of objects created using type hints, for example:

As you can see in the following, HttpServletRequest is the class and request is the object
Likewise, HttpServletResponse is the class and response is the object

protected void doGet(HttpServletRequest request, HttpServletResponse response) throws
          ServletException, IOException
        {
         doPost(request, response);
        }

try
    {
     // As you can see MimeMessage is the class and message is the object
     MimeMessage message = new MimeMessage(session);
    }
catch (MessagingException mex) // Likewise, MessagingException is the class and mex is the object
    {
     mex.printStackTrace();
    }
A class is the program you write (i.e., the MyClass class implementation above); while object (i.e., $obj) is the copy of the class or the clone of the class, most often being known as the instance of the class (MyClass, in this case).
A class resides in ROM (a permanent memory area: Read Only Memory), whereas object (i.e., $obj) resides in RAM (a temporary memory area: Random Access Memory.)
In ROM, data is stored there permanently even when the computer is turned off. In a RAM memory area, on the other hand, data get stored temporarily while the program is running or while the computer is still turned on. When the computer is turned off, the RAM data (i.e., $obj) is completely erased and is no longer stored in the RAM.
Instances of a class can be useful only while the program is running or while the computer is turned on; and when the program is not running or when the computer is turned off, instances of a class are no longer useful to a program; and therefore, it is stored in a temporary memory area.
Instances of a class can be created 'on the fly' at any time when needed by a program [as you can see above: $obj = new MyClass()].
Instances of a class are often being created from everywhere when needed (i.e., libraries, frameworks, and other classes, etc.)
So there is no need to store instances of a class permanently in permanent memory spaces and wasting valuable memory spaces.
SUMMARY: Class verses Object
to create an object, use the keyword new in the front of a class

objects can be created using 'type hint' as well

the keyword new means to create an instance of a class -- or to create a copy or a clone of a class

an 'object' is just a copy or a clone or an instance of a class!

a class has three types of attributes!

1st attribute of the class:

the purpose of the 1st attribute of the class is to store content value that is
constant and can't change its value during the lifecycle of the application

2nd attribute of the class:

the purpose of the 2nd attribute of the class is to store content value that is
constantly changing its value during the lifecycle of the application.

3rd attribute of the class:

the purpose of the 3rd attribute of the class is to calculate and manipulate the
content values that contain in the 1st and 2nd attribute property variables.

Note:

In programming, a class mimmicking a real world object, in which, it has attributes
just like a real world object has. For example, say, a real world human has two arms,
two legs, a name, address, email, phone, username, password, a face, hair, and other
body parts.

All those are called attributes -- attributes are some entities that enable the "body"
or "object" (or a human in this case) to function properly. "Attribute" means to "help."

All those attributes are called properties in programming and also usually known as
variables. Variables are just a term used to hold values in programming (or in computer memory).

They are placeholders to hold values in the computer memory so that they can be stored
and retrieved.

So when people say attributes, properties, and variables, they mean those three having the
same meaning and they are being used interchangibly.

For example, I use: 1st and 2nd 'attribute' 'property' 'variable' in my description throughout
this tutorial -- all in one phrase: 'attribute property variable' to emphasize the meaning of
the placeholder in computer memory, which is an attribute or a property or a variable.

All three have the same meaning and can be used interchangibly -- most often being used as one
phrase (as you'd seen throughout my description).

I found that beginning programmers are often confused with the word 'property' when they see one.

Just know that in programming, we often use the word property a lot to mean variable.

And also in programming, we often use the word attribute a lot to mean variable or function
(also known as method).

The three have the same meaning and can be used interchangibly -- and often as one phrase.

As you can see, a class has three attributes: 1st is the constants, 2nd is the variables, 3rd is
the functions (also known as methods).

In the dictionary the word 'attribute' means a quality or feature or property
regarded as a characteristic or inherent part of someone or something. Verb: to help!

In computer programming the word 'attribute' means a piece of information which
determines the properties of a field or tag in a database or a string of
characters in a display.
An Object-Oriented Class
A true definition of a class is an object-oriented model mimicking how real objects behave. For example, a class called Car would have the usual three attributes: the engine (implemented as const COMBUSTIBLE_ENGINE = 'v8-engine'; (2nd attribute implemented as properties) the make, model, color; and (3rd attribute) at a minimum it must contains the constructor function to initialize the objects and the ignition (implemented as a method called Ignition()) to start the car.
That is object-oriented class. So when you think of a class, think of it as a real world object that exists in the real world. That's what a class is -- a real world object that you can observe.
An object-oriented class is a class that mimicks or behaves like a real world object.
You may have heard people mentioned the term object-oriented programming when talking about building applications or when talking about programming methodologies in general.
They are really talking about classes. Classes are object-oriented methodology.
In the old days (the 1960s, 1970s and up to the first half of the decade of 1980s), there were no object-oriented programming methodologies available. There were no classes available. So programmers had to program the hard way using only variables, methods, functions, and procedures to do their programming work.
That was during the early days of the technology revolution and the Web hadn't even been invented yet. So you couldn't program anything sophisticated up to the first half of the decade of the 1980s because object-oriented programming hadn't been invented yet (or more specifically, classes or the concept of classes hadn't been invented yet).
During the second half of the decade of the 1980s and onward, object-oriented programming was developed and enabled very sophisticated applications to be developed to this day. Classes were the foundation of the technological revolution. Without classes we wouldn't have been able to program very sophisticated applications.
Today, if you hear people talk about object-oriented programming, just ask them: What is a non-object-oriented programming? (To see if they know one exists.)
There are none!!!
All of today's programming are object-oriented programming. So the term object-oriented programming is obsolete and it has been obsolete since the start of the millenial decade (2000s). It is irrelevant nowaday and onward.
So keep this in mind: All classes are object-oriented programming methodology. Classes mimick how real world objects behave. Classes are the foundation of the programming world.
Building or Creating Classes
When you approach to building (or creating a class), you first think of the real world object that class represents (i.e., a car, a person, a customer, an employee, a student, etc.) and then you proceed to creating that class by using the three attributes to represent the real world object that forms the class that you're creating.
For example, if you want to program an application about a person, whether that person is a student, a teacher, a co-worker, a doctor, a lawyer, a customer, or an employee of a company, etc, you would think in term of real world about that person, which is, that person has a name, an address, a phone, email, a username, a password, etc.
By the way, a person is a very generic term and it can be applied to other uses as well; for example, it can be applied to a customer, a student, a teacher, a co-worker, a doctor, a lawyer, a customer, or an employee of a company, etc.
Question: How would you create a class for that person? Or for any person? Or for a generic uses of/for that person?
The answer to that question can be varied depending on what type of application you're building, but all cases require you to think of the real world object implementing the three attributes that form the foundation of the class.
For example, if you're building an application to store a person's personal profile, you would start with a person and list the attributes of that person. For example, a person has a name, address, phone, email, username, password, etc.
Next, ask yourself a question: which of the items belong to the 1st attribute of the class? Which belong to the 2nd attribute of the class? Which belong to the 3rd attribute of the class? And finally, which belong to none of the above?
Well, by looking at the list, we can see clearly that 'address' stands out among them, because 'address' has attributes of its own: street number, apt #, suite #, city, state, zip, country, etc.
This means that 'address' is just like 'person' and they both have attributes of their own. So both 'person' and 'address' are classes. None of the rest in the list have attributes, so they are either belonging to the 1st or 2nd attribute of the class.
Knowing that, we can go ahead and create two classes called Address and Person to record that person's profile information.
Now since class Person has an attribute called address and address has attributes of its own, we can say that address is a supporting class of Person. In other words, class Person needs class Address to make class Person more suiteable to record a person's profile because in the real world a person needs an address to live in.
Now let's build those classes: Address and Person:
<?php
/**
 * this class is a model class in an MVC scheme of thing
 * see my other tutorial about MVC called Advanced Pattern Programming: MVC
 * notice that the namespace points to the folder names called 'path', 'to', 'model'
 * you can rename them accordingly!
 * 'path', 'to', and 'model' are actually folder names containing the models or classes
 * if you desire to have more levels of folders, you can add them accordingly,
 * for example: namespace path\to\my\resource\model;
 * of course, you need to autoload them accordingly as well, or else
 * it won't work!
 * see my other tutorial called 'How to autoload classes using SPL'
 * or you can use class level loading and remove the namespace and the use clauses
 * and it will work just fine!
 * just put the include statement(s) at the top of every class that uses the file!
 *
 * as you can see in the namespace, you can put all of your model in a folder called 'model',
 * including this class Address
 */


// 'path', 'to', and 'model' are actually folder names containing the models or classes
namespace path\to\model;

class Address
    {
     // 1st attribute of the class Address:
     // the purpose of the 1st attribute of the class is to store constant value.
     // declaring class constant variables
     // for class Address there are no constant variables
     // you may find a use of the constant for Address, however!

     // 2nd attribute of the class Address:
     // the purpose of the 2nd attribute of the class is to store property
     // variable values that are constantly changing during the lifecycle
     // of the application.

     // the 2nd property variables must be declared prefacing with visibility control.
     // public, protected, private are visibility control.

     // notice that class Address has an attribute called name
     // well, if you think in the real world term, an address is for somebody to live
     // in or an address is an object that can accomodate other objects: a person or a name

     // in this case, an address has a name of a person tied to it as its attribute
     // in programming an application, we need to associate a name of a person to
     // the object called Address so that we can relate them to one another

     public $name;
     public $street1;
     public $street2;
     public $city;
     public $state;
     public $zip;
     public $country;

     // 3rd attribute of the class (Address):
     // the purpose of the 3rd attribute of the class is to calculate
     // and manipulate the values of the 1st and 2nd attributes of the class.
     // 3rd attribute methods must be declared prefacing with visibility control
     // public, protected, private are visibility control.

     // for the 3rd attribute in the example below, most of the tasks are being done
     // to validate the address's 2nd attributes so that they all are
     // valid attributes.

     // that is all that need to be done for the class Address
     // very simple and can be utilized by others like: customer, student, employee, etc.

     public function isNameValid()
          {
           // this function will return the full name of the person
           // if you desire to seperate the first/last name of the person
           // you can do so accordingly very easily!

           return strlen($this->name) > 0;
          }

     public function isStreet1Valid()
          {
           // this function will return the street address1 of the person
           // notice that there is no need to validate street address2
           // because street address2 is optional and generally for apt, suite, etc.

           return strlen($this->street1) > 0;
          }

     public function isCityValid()
          {
           // this function will return the city address of the person

           return strlen($this->city) > 0;
          }

     public function isStateValid()
          {
           // this function will return the state of resident of the person

           return strlen($this->state) == 2;
          }

     public function isZipValid()
          {
           return strlen($this->zip) == 5;
          }

     public function isCountryValid()
          {
           return strlen($this->country) > 0;
          }

     // this function is being called by class Person's validate() method and it looks like this:
     // return $this->billingAddress->validate();
     // with billingAddress being an instance of class Address
     //  and it is very very elegance!!!
     // to see an even more elegance(ness) at work, please see class Main later!
     public function validate()
          {
           // this function will return the valid name of the person

           return $this->isNameValid();
          }
    }
?>
Remember that, an address is a supporting class of Person. In other words, class Person needs class Address to make class Person more suiteable to record a person's profile.
Okay, let's create a person class to record that person's profile information. For example:
<?php
/**
 * this class is a model class in an MVC scheme of thing
 * see my other tutorial about MVC called Advanced Pattern Programming: MVC
 * notice that the namespace points to the folder names called 'path', 'to', 'model'
 * you can rename them accordingly!
 * 'path', 'to', and 'model' are actually folder names containing the models or classes
 * if you desire to have more levels of folders, you can add them accordingly,
 * for example: namespace path\to\my\resource\model;
 * of course, you need to autoload them accordingly as well, or else
 * it won't work!
 * see my other tutorial called 'How to autoload classes using SPL'
 * or you can use class level loading and remove the namespace and the use clauses
 * and it will work just fine!
 * just put the include statement(s) at the top of every class that uses the file!
 *
 * notice that the use clause references the folders: 'path', 'to', 'model' as well as
 * the class name called 'Address'
 * this is needed!
 * now class Person has access to class Address in full capability as if you had
 * used the class level loading method!
 * either method will work just fine, but namespace and application level loading is
 * more robust and efficient!
 *
 * as you can see in the namespace, you can put all of your model in a folder called 'model',
 * including this class Person and the previous class Address
 */


// 'path', 'to', and 'model' are actually folder names containing the models or classes
namespace path\to\model;

use path\to\model\Address;

/**
 * this class is very generic and it can be changed to other uses as well,
 * for example, you can rename it to Customer, Student, Employee, etc.
 */

class Person
    {
     /**
      * 1st attribute of the class (Person):
      * declaring class constant variables
      * for class Person there are no constant variables
      * you may find a use of the constant for Person, however!
      *
      * 2nd attribute of the class (Person):
      * class properties: properties must be declared prefacing with visibility control
      * public, protected, private are visibility control:
      *
      * if you remember the list, a person has an address and that address has already
      * been taken care of earlier in a class called Address
      *
      * now we need to glance over the list again and we can see that it has email, phone,
      * social security, username, password, etc.
      *
      * so we need to implement those as the 2nd attributes
      *
      * in case you're doing an ecommerce shopping site, you can use this
      * property variable called $billingAddress to direct your application to
      * the billing address during the check out process
      *
      * yes, these classes/applications/codes are very generic and you can customize
      *them to suit your objectives!
      */

     public $billingAddress;
     public $email;
     public $phone;
     public $social_security_number;

     /**
      * 3rd attribute of the class (Person):
      * class methods: methods must be declared prefacing with visibility control
      * public, protected, private are visibility control:
      *
      * for the third attributes, we start with a constructor to initialize the class
      * Address
      * more specifically, we need to create an instance of the class Address and
      * store it in the 2nd attribute variable called billingAddress

      * the rest of the 3rd attributes are just methods to validate the 2nd attributes
      * if you have other ideas for other 3rd attributes to accomplish something, like
      * looking up in a database to retrieve something, you can add them here in
      * the 3rd attribute section
      */

     public function __construct()
          {
           // this constructor function will assign an instance of the address of the
           // person to the 2nd attribute property variable called 'billingAddress'
           // this way, you can access the person's address info from other
           // classes that make use of this person address info!

           $this->billingAddress = new Address();
          }

     public function getName()
          {
           // this function will return the valid full name of the person

           return $this->billingAddress->name;
          }

     public function validateSocialSecurityNumber($social_security_number)
          {
           // this function will return the valid social security number of the person
           // you might want to do a better job in validating social security number than this

           return preg_match('/^[0-9]{3}-[0-9]{2}-[0-9]{4}$/', $social_security_number);
          }

     public function isSocialSecurityNumberValid($social_security_number)
          {
           // this function will return the valid social security number of the person

           return $this->validateSocialSecurityNumber($social_security_number);
          }

     public function validateEmail($emailToValidate)
          {
           // this function will return the valid email of the person
           // check if email address is well-formed using PHP's built-in filter_var()
           // Google the Web for a more robust email validation function

           return filter_var($emailToValidate, FILTER_VALIDATE_EMAIL);
          }

     public function isEmailValid()
          {
           // this function will return the valid email address of the person

           return $this->validateEmail($this->email);
          }

     public function validatePhone($phone)
          {
           // this function will return the valid phone of the person

           return preg_match('/^[0-9]{3}$/', $phone);
          }

     public function isPhoneValid()
          {
           return $this->validatePhone($this->$phone);
          }

     public function validate()
          {
           // this function will return the valid billing address of the person
           // notice that this call is to the class Address's validate()

           return $this->billingAddress->validate();
          }
    }
?>
Now we got two classes supporting each other: Person and Address.
So let's build a service application that makes use of the two classes to store a person's personal profile. For example:
<?php
/**
 * notice that the namespace points to the folder names called 'path', 'to', 'model'
 * 'path', 'to', and 'model' are actually folder names containing the models or classes
 * you can rename them accordingly! this class assumes to reside in 'path/to/model' folder!
 * if you desire to have more levels of folders, you can add them accordingly,
 * for example: namespace path\to\my\resource\model;
 * of course, you need to autoload them accordingly as well, or else
 * it won't work!
 * see my other tutorial called 'How to autoload classes using SPL'
 * or you can use class level loading and remove the namespace and the use clause
 * and it will work just fine!
 * just put the include statement(s) at the top of every class that uses the file!
 *
 * as you can see in the namespace, you can put all of your model in a folder called 'model',
 * including this class Application and the previous classes: Address, Person, and any other
 * model classes that you might have
 */


// 'path', 'to', and 'model' are actually folder names containing the models or classes
namespace path\to\model;

/**
 * notice that the use clause references the folders: 'path', 'to', 'model'
 * as well as the class names called 'Address' and 'Person'
 * this is needed!
 * now class Person has access to class Address in full capability as if you had
 * used the class level loading method!
 * either method will work just fine, but namespace and application level loading is
 * more robust and efficient!
 */

use path\to\model\Address;
use path\to\model\Person;

/**
 * this class will make use of the other classes: Address, Person
 * this class is a model class in an MVC scheme of thing
 * see my other tutorial about MVC called Advanced Pattern Programming: MVC
 */

class Application
    {
     // 1st attribute of the class (Application):
     // declaring class constant variables
     // for class Application there are no constant variables
     // you may find a use of the constant for Application, however!

     // 2nd attribute of the class (Application):
     class properties: properties must be declared prefacing with visibility control
     public, protected, private are visibility control:

     public $person;
     public $workAddress;
     public $foreignAddress;
     // in case you order items online and bill it to a different address, i.e., your employer
     // yes, I've seen strange things people do!
     public $billingAddress;

     // in case you order items online and has a different address to ship, i.e., your landloard
     // yes, I've seen strange things people do with their shipment!
     public $shippingAddress;

     // of course, you can have lots more 2nd attributes here!

     // 3rd attribute of the class (Application):
     class methods: methods must be declared prefacing with visibility control
     public, protected, private are visibility control:

     public function __construct()
          {
           // this constructor function will assign an instance of the address of the person to the
           // 2nd attribute property variable called 'shippingAddress' (among other assignments)

           // this way, you can access the person's address info from other
           // classes that make use of this person address info!
           // also this is in case you need to have your packages ship to a different location!

           $this->billingAddress = new Address();

           $this->shippingAddress = new Address();

           $this->workAddress = new Address();

           $this->foreignAddress = new Address();

           $this->person = new Person();
          }

     public function validate()
          {
           // this function will return true or false depending on whether a person
           // info has been validated or not!

           // notice the call to $this->person->validate() is actually calling
           // class Person's method called validate()
           //
           // just follow this elegant code flow and you'll be fine!

           return $this->person->validate();
          }

     // of course, you can have more functions to do other things as well!
    }
?>
At this point, all of the models have been created and from here and on, you can create external controller classes to make use of the models: Address, Person, and Application.
Remember that, controller (specifically external controller) dictate or delegate, organize the tasks. It is akin to office managers dictating and delegating the tasks to their employees. Employees do all the work and managers do very little work and only organize, dictate, and delegate the tasks.
Now what's left is to create an instance of the class Application and use it accordingly. For example:
<?php
/**
 * this class is a controller class in an MVC scheme of thing
 * see my other tutorial about MVC called Advanced Pattern Programming: MVC
 *
 * if you remember that a controller class in an MVC scheme of thing does very
 * little work. however, in this class, I broke that rule by doing a lot work in
 * here like grabbing all the POST variables and store them in the 2nd attributes
 * of the model classes
 *
 * well, sometimes I break my own rule because of my laziness instead of doing all of the
 * handling of the POST tasks in the actual "external" controller and not in the base controller!
 *
 * just to be clear: nothing stops you from doing what I'm doing here!
 * however, the downsize is that you are setting up yourself to repeat this habbit
 * over and over and over again and that's will make you a bad programmer!
 * and one of these days your code will contain bugs!!!
 *
 * to be proper, this class should do very little of coding, and that is, it should
 * just create an instance of the model and ask the model if the POST variables that
 * are sent by the user are valid: true or false!
 *
 * or in most cases, in the model, there should be method(s) that handle the POST
 * items accordingly and insert them into the database!
 *
 * that method that handles/inserts POST items into the database should return true when
 * the items are inserted into the database successfully, and false otherwise!
 *
 * again here, due to my laziness, I bypassed all that tasks completely and only to
 * implement this as a base controller class to give you somewhat a guideline for you
 * to complete the tasks (yourself) of building a functional application.
 *
 * actually, this class is a "main" controller base class in an MVC scheme of thing,
 * similar to classes Base in "Advanced Programming: MVC" and class Example in my other
 * tutorial called 'How to autoload classes using SPL'
 *
 * so in actuality, I did not provide "external" controller classes for this example and
 * only leave them for you to implement your own as well as your own view, too!
 * this ends the topic about MVC rant!
 *
 *
 * notice that the namespace points to the folder names called 'path', 'to', 'controller'
 * you can rename them accordingly! this class assumes to reside in 'path/to/controller' folders!
 * if you desire to have more levels of folders, you can add them accordingly,
 * for example: namespace path\to\my\resource\controller;
 *
 * of course, you need to autoload them accordingly as well, or else
 * it won't work!
 * see my other tutorial called 'How to autoload classes using SPL'
 * or you can use class level loading and remove the namespace and the use clause
 * and it will work just fine!
 * just put the include statement(s) at the top of every class that uses the file!
 *
 * as you can see below, you can put all of your controller in a folder called 'controller'
 */

namespace path\to\controller;

/**
 * notice that the use clause references the folders: 'path', 'to', 'model'
 * as well as the class name called 'Application'
 * this is needed!
 * now class Main has access to class Application in full capability as if you had
 * used the class level loading method!
 * either method will work just fine, but namespace and application level loading is
 * more robust and efficient!
 */

use path\to\model\Application;

/**
 * this class will make use of the class Application
 */

class Main
    {
     // 1st attribute of the class (Main):
     // declaring class constant variables
     // for class Main there are no constant variables
     // you may find a use of the constant for Main, however!

     // 2nd attribute of the class (Main):
     class properties: properties must be declared prefacing with visibility control
     public, protected, private are visibility control:

     public $app;

     // of course, you can have lots more 2nd attributes here!

     // 3rd attribute of the class (Main):
     class methods: methods must be declared prefacing with visibility control
     public, protected, private are visibility control:

     public function __construct()
          {
           // this constructor function will assign an instance of the address of the
           // person to the 2nd attribute property variable called 'shippingAddress'
           // this way, you can access the person's address info from other
           // classes that make use of this person address info!
           // also for in case you need to have your packages ship to a different location!

           $this->app = new Application();

           // all of these are just assigning the POST items sent by the form and put them
           // into their proper variables! nothing special!
           // this happens whenever a user fills out a form and press 'submit' button and
           // they all will come here and you can grab those items and use them here and
           // anywhere else for that matter!

           // you can insert these POST items into the database as well!

           // notice that, you can set this property called 'app' so that the view can
           // use them. see "Advanced Pattern Programming: MVC" where I show a set()
           // and a get() for the purpose of setting all these properties in class Base()

           // so assuming if you have an "external" controller to handle these POST,
           // you would do like this in that "external" controller:

           // $app = new Application();
           // $base = new Main(); // or Base() in the MVC example!
           // $base->set('app', $app->person->billingddress);

           // remember that in PHP, you can use properties on the "fly" without
           // having to declare them first!

           // in here, we set the undeclared property called 'app' and class Base will happily
           // accepts 'app' as its own property! awesome!

           // now in the view, you can retrieve that property by doing this:

           // $main = new Main();

           // $app = $main->get('app');

           // you can display these values to your users or do whatever with them!

           // foreach ($app as $value)
           //       {
           //        $name    = $value->name;       // $name    = 'John Doe'
           //        $street1 = $value->street1;    // $street1 = '123 Main St'
           //        $city    = $value->city;       // $city    = 'Minneapolis'
           //       }

           $this->app->person->billingddress->name = $_POST ['name'];

           $this->app->person->billingddress->street1 = $_POST ['street1'];

           $this->app->person->billingddress->street2 = $_POST ['street2'];

           $this->app->person->billingddress->city = $_POST ['city'];

           $this->app->person->billingddress->state = $_POST ['state'];

           $this->app->person->billingddress->zip = $_POST ['zip'];

           $this->app->person->billingddress->country = $_POST ['country'];

           $this->app->person->billingddress->email = $_POST ['email'];

           $this->app->person->billingddress->phone = $_POST ['phone'];

           // you can do the same thing for other addresses, i.e., shippingAddress
           // of course, you have to grab from the proper form values sent by your users
           // here, we assume that the shipping and billing address are the same!

           $this->app->person->shippingAddress->name = $_POST ['name'];

           $this->app->person->shippingAddress->street1 = $_POST ['street1'];

           $this->app->person->shippingAddress->street2 = $_POST ['street2'];

           $this->app->person->shippingAddress->city = $_POST ['city'];

           $this->app->person->shippingAddress->state = $_POST ['state'];

           $this->app->person->shippingAddress->zip = $_POST ['zip'];

           $this->app->person->shippingAddress->country = $_POST ['country'];

           $this->app->person->shippingAddress->email = $_POST ['email'];

           $this->app->person->shippingAddress->phone = $_POST ['phone'];
          }

     // of course, you have some functions to do other things as well!
    }
?>
Okay, you've seen how you approach in building an application large or small by laying out a road map by thinking that a class mimicks a real world object and using the guideline shown in this tutorial should help you build any application large or small in an elegance way.
There you have it!
And have fun building applications!
What is a constructor?
A very simple and short answer is: A constructor is just an empty or blank function.
That is it! A hollowed empty function that contains nothing! That's what a constructor is. It's an empty or blank function that contains nothing.
A constructor __construct() is often known as a magic method because PHP does its magic behind the scene by calling it or invoking it magically behind the scene whenever you create an instance of its class.
There are many magic methods in PHP and the following method names are considered magical: __get(), __set(), __isset(), __unset(), __construct(), __destruct(), __call(), __callStatic(), __sleep(), __wakeup(), __serialize(), __unserialize(), __toString(), __invoke(), __set_state(), __clone(), and __debugInfo().
Notice that they all use the __ (double underscores), including __construct().
Notice also that all these magic methods are magically called by PHP automatically. For more, please see my other tutorial called Magic Methods: __set(), __get(), __isset(), __unset()
Earlier, we talked about the definition of a class. Now we're talking about the definition of a constructor, which is just an empty function.
That empty(ness) is by design to allow programmers to put some code in it.
Remember that a class has three attributes: 1st, 2nd, and 3rd attributes.
The 3rd attribute contains one of the most important attribute of the class concept, and that attribute is called a constructor.
What is so significant about a constructor?
A constructor is very significant, in that, it gets called every time its class gets referenced.
I repeat: A constructor gets called every time its class gets referenced.
The keyword is referenced -- meaning, called or instantiated. For example, $obj = new MyClass().
As you can see, MyClass gets referenced and if it has a constructor, its constructor will get called or executed automatically.
This is very significant because it gets called automatically without you having to explicitly call it as you normally would with other 3rd attributes.
So you can say that a constructor is an empty special 3rd attribute of the class. No one else in the 3rd attribute category that has any special preferential treatment like a constructor does.
With this priviledge (and empty-ness), you can put all kinds of code in the constructor to be executed automatically whenever its class is referenced. Very neat!!!
Typically, the kinds of code you put in the constructor are code that needed to be instantiated or initialized. You've seen in class Person, its constructor contains a line of code that instantiating an address class: $this->address = new Address().
You don't do a lot of heavy duty programming like querying a database inside a constructor. You leave all of the heavy duty jobs to other 3rd attributes. The purpose of a constructor is just to do simple and quick instantiations and initializations of the code. Nothing else!
Note: The variable $this refers to the current class (or object) which is class Person (in the case of $this->address = new Address()).
A class does not require a constructor if the class doesn't need to instantiate or initialize other objects or code. In other words, if you don't need your code to be executed automatically every time your class is referenced, then you don't need a constructor for your class.
When creating a class, you have to decide whether your class needs a constructor or not depending on whether your class needs to instantiate or initialize any objects (or code) at all.
Another point of note is that, you have to decide whether or not some of the code inside your class need to get executed automatically whenever your class gets referenced. Anything inside a constructor will get executed automatically whenever its class is referenced.
In summary, the purpose of the constructor is to get code executed automatically every time its class gets referenced. That's all a constructor does and nothing else. If you don't have code that needs to be executed automatically every time your class gets referenced, then you don't need a constructor for your class.
In the following example, function Connect() gets executed automatically whenever class Connection gets referenced, even though function Connect() is outside of the constructor, because a code inside the constructor calls it.
This is how you make your non-constructor functions get called automatically whenever their class gets referenced. For example:
<?php
/**
 * as you can see in the namespace, you can put all of your model in a folder called 'model'
 */

namespace path\to\model;

class Connection
    {
     // 2nd attribute of the class (Connection):

     private $username;
     private $password;
     private $db_name;
     private $host;
     private $isConnect;

     // 3rd attribute of the class (Connection):

     public function __construct($user, $pass, $dbName, $url)
          {
           // initialize the variables username, password, host, db_name, with the
           // argument values sent in via the contructor heading: user, pass, dbName, url

           // notice that variable $this refers to the current object: $obj = new MyClass()

           $this->username  = $user;
           $this->password  = $pass;
           $this->db_name   = $dbName;
           $this->host      = $url;

           $this->isConnect = $this->Connect();
          }

     public function Connect()
          {
           // notice that this function gets called automatically whenever class Connection
           // gets referenced because this function gets included in the constructor above!

           // this function returns the PDO connection object

           return new PDO("mysql:host=$this->host;dbname=$this->db_name", $this->$username, $this->$password);
          }
    } // end class Connection

/**
 * Usage:
 *
 * $pdo = new Connection('my_username_123', 'my_password_123', 'my_database_name_123', 'my_db_server_123');
 *
 * The above creation of an instance of class Connection causes the class Connection to get
 * referenced, and as a result of this referenced, its constructor gets called automatically!
 * Now you can use the instance of class Connection as you normally would:
 *
 * if ($pdo) // we could do this as well: if ($pdo->Connect)
 *    {
 *     // it is connected
 *     $sql      = 'SELECT * FROM myTable';
 *     $query    = $pdo->prepare($sql);
 *     $resource = $query->execute();
 *     $result   = $resource->fetch(PDO::FETCH_ASSOC);
 *
 *     // now you can do whatever with the associative array variable $result
 *
 *     while ($row = $result->fetch())
 *         {
 *          // well, I'm just pretending that 'myTable' contains only a username and password
 *
 *          $username = $row['username'];
 *          $password = $row['password'];
 *         }
 *
 *    }
 */
?>
How do we call a constructor?
As stated earlier, a constructor is automatically called whenever its class gets referenced. This means that we do not need to call a constructor directly and manually by hand -- it is automatically called by the programming compiler behind the scene whenever its class gets referenced. The keyword here is referenced.
To refer (or reference) a class, you create an instance of a class. For example:
<?php
/**
 * as you can see in the following, we refer to classes Address and Person by creating instances of the
 * classes using keyword new
 *
 * now since class Address doesn't have a constructor, the reference didn't trigger a call to the constructor
 *
 * on the other hand, a reference to classes Person and Connection will trigger a call to its respective
 * constructor because both classes Person and Connection have their own constructor
 */

$this->foreignAddress = new Address();

$this->person = new Person();

$pdo = new Connection('my_username_123', 'my_password_123', 'my_database_name_123', 'my_db_server_123');
?>
Since the purpose of a constructor is to allow you to put some code in it to be executed automatically by the compiler, you can pass outside values as parameters of the class to its constructor to be executed automatically, and thus allow you to use those outside values to initialize variables/properties of the class inside a constructor.
As you can see from the previous example in class Connection, it passes outside values to the constructor to be used as connection parameters. For example, class Connection has four parameters to be passed in via its constructor:
<?php
public function __construct($user, $pass, $dbName, $url)
?>
And then we can pass outside values to class Connection via its constructor like the following.
Notice that you pass outside values to the class through its constructor. This means that the outside values you pass to the class must match the number of parameters contain in the constructor.
In this case, we pass four outside values: 'my_username_123', 'my_password_123', 'my_database_name_123', 'my_db_server_123' to correspond with the constructor parameters $user, $pass, $dbName, $url, respectively.
<?php
$pdo = new Connection('my_username_123', 'my_password_123', 'my_database_name_123', 'my_db_server_123');
?>
Now class Connection has full control of the outside values at its disposable. It can do whatever it wants with these outside values inside class Connection.
That is how you pass outside values to a class to be calculated and manipulated in a class.
Remember that the purpose of the 3rd attribute (including the constructor) of a class is to calculate and manipulate values of the 1st and 2nd attributes of the class?
These outside values get assigned to the 2nd attribute of a class inside the constructor. The constructor is also a member of the 3rd attribute of a class.
Earlier I mentioned that if you have some code that need to be executed automatically whenever its class gets referenced, you need to put them in the constructor. However, the constructor is not the only "game in town" that you can put your code to be executed automatically whenever its class gets referenced -- there is another "game in town" that can accomplish this very same thing. You can use a neat trick to accomplish the same thing a constructor does. Here is how.
<?php
/**
 * Illustrating a neat trick to mimick a constructor
 */

namespace path\to\model;

class MyClass
    {
     // 2nd attribute of the class (MyClass):

     public $make;
     public $model;
     public $color;

     // 3rd attribute of the class (MyClass):

     public function __construct($make = null, $model = null, $color = null)
          {
           // initialize variables $make, $model, $color

           // notice that variable $this refers to the current object: $obj = new MyClass()

           $this->make  = $make;
           $this->model  = $model;
           $this->color   = $color;
          }

     public function init()
          {
           // notice that this function gets called automatically whenever class MyClass
           // gets referenced because this function gets included at the bottom of this class!
           // see the call to this function at the bottom of this class

           // you can do whatever you desire inside this init(), such as code initializations
           // $address = new Address();

           // but here, we'll just return null for this illustration!

           return null;
          }
    } // end class MyClass

// Notice that this call is outside of class MyClass but inside the file MyClass.php
// In fact, in here, you can call as many functions/methods as you want to mimick a constructor.

$obj = new MyClass();
$obj->init();

/** THIS IS THE END OF FILE: MyClass.php **/

/**
 * Usage:
 *
 * $obj = new MyClass('Toyota', 'Camry', 'blue');
 *
 * The above creation of an instance of class MyClass causes the class MyClass to get
 * referenced, and as a result of this referenced, its method init() also gets called automatically!
 * Now you can use the instance of class MyClass as you normally would.
 *
 * Notice that every time this class (MyClass) gets referenced, it runs all the way down to
 * the bottom of the file, and in effect, it executes the line that calls init()
 *
 * As you can see, this is a very neat trick to mimick a constructor in case your
 * constructor is to bulky or congested to put more code in it.
 *
 * Using this trick will make your constructor very lean, especially if you have lots and lots
 * of code to initialize.
 */
?>
Example Use Cases for Classes and Constructors
Now that you know a lot about classes and its constructors, let's see some example uses so that you can build upon the knowledge you'd learned thus far.
Remember that classes Address and Person are very generic which means that you can customize them and use them for other purpose as well.
Suppose that you're building an ecommerce application, the first question you ask yourself is: What is an ecommerce?
Well, everybody knows that an ecommerce is a place or platform that allows people to buy and sell things.
Okay, the next question you ask yourself is: What sort of things involved in an ecommerce transaction; in other words, what do you need in a shop or online shop if you're going to allow shoppers to be able to shop at a store or at an online shopping site? What do you need?
To answer that question, you follow the same process shown earlier with the classes Address and Person and think of the real world scenario and apply it to your starting point.
This means that an ecommerce involves a person, also known as a customer. So immediately we can say that we need a 'Customer' class but we already have a generic class called 'Person' that we can use to customize it to suite our purpose. So just change the already created 'Person' class into a 'Customer' class and we're all set to go.
Next, a customer has an address, email, phone, username, password, etc. Again, we already have a generic class called 'Address' and so we're all set to go.
Next, a customer (or an ecommerce) has to have a cart for customers to use. In other words, a 'Customer' class will interact with a 'Cart' class.
So the next question is: What is a cart?
Well, a cart is for putting items in it.
Now clearly from the description above a cart has an attribute called 'item'.
The next question is: What is an item?
Well, an item has a name, description, the shape and size, color, a picture (a url), etc., to identify itself.
So clearly we know that a cart has attributes (just item for now) and an item also has attributes. So we will need to create a class called 'Cart' and as well as a class called 'Item'. [Remember that we already have a generic class called 'Person' that we can use to customize it into a 'Customer' class.]
The next question is: Are there anymore attributes for a cart or for an item?
Yes, there are for both. For the cart, a shopper can add and remove items to and from the cart. So clearly right now we know that a cart has at least three attributes: Item, addItem(), removeItem().
There maybe more, such as to calculate the total price, to count the items, to apply discount and promo, to calculate the weight, etc.
For now, we follow the same process outlined earlier with the classes: Address and Person.
For example, class Cart has these attributes: Item, addItem(), removeItem().
By looking at the list, we can see clearly that Item stands out among the three attributes. Item has its own attributes: id, price, description, color, size, shape, make, model, url, image, etc.
This means that Cart and Item are classes, with Item acts as a supporting class of class Cart.
Now let's create these classes called 'Item' and 'Cart'. For example:
<?php
/**
 * this class is a model class in an MVC scheme of thing
 * see my other tutorial about MVC called Advanced Pattern Programming: MVC
 * as you can see in the namespace, you can put all of your model in a folder called 'model'
 */

namespace path\to\model;

class Item
    {
     /**
      * 2nd attribute of the class (Item):
      *
      * remember that the purpose of the 2nd attribute of the class is to store
      * property values that are constantly changing during the lifecycle of the application.
      *
      * this class is a model class in an MVC scheme of thing
      * see my other tutorial about MVC called Advanced Pattern Programming: MVC
      * as you can see in the namespace, you can put all of your model in a folder called 'model'
      *
      * again, using real world scenario, what sort of attributes an item has?
      *
      * clearly, an item has an id to identify itself whether it is an apple or an orange!
      * it has a quantiy to tell how many a customer buys!
      * next, price for each item!
      *
      * you can add some more attributes like product name, description, url, image, etc.
      *
      * the other two: discount and product are just extra things that you can add on
      * to make your item relate to the customer in a shopping cart!
      */

     public $id;
     public $qty = 0;
     public $price;
     public $discount = 0;

     // we could just as well name this attribute as 'catalog' which is more appropriate
     // property variable $product holds products/items in the catalog
     // it is an array of items in the catalog!
     //

     public $product = null;

     /**
      * 3rd attribute of the class (Item):
      *
      * remember that the purpose of the 3rd attribute of the class is to calculate
      * and manipulate property values contain in the 1st and 2nd attributes.
      *
      * class Cart (below) references this class Item and in effect triggers a call to this
      * constructor. for example:
      *
      *      $this->item[$id] = new Item($qty, $product);
      *
      * argument $product being the catalog array of items!
      */

     public function __construct($qty, $product)
          {
           // initialize the variables qty and product, with the
           // argument values sent in via the contructor heading: $qty, $product

           // notice that variable $this refers to the current object or current
           // class 2nd attributes: qty, product

           $this->qty  = $qty;
           $this->product  = $prodcut;
          }

     public function getName()
          {
           // return the name of the product/item

           return $this->product->name;
          }

     public function getPrice()
          {
           // return the price of the product/item

           return $this->product->price;
          }

     public function getWeight()
          {
           // return the weight of the product/item
           // notice that a product/item has many other attributes as well: size,
           // make, model, color, etc.
           // I'll leave all of that details for you to implement your own purpose!

           return $this->product->weight;
          }

     public function getUrl()
          {
           // return the url of the product/item
           // again, a product has to have a url to link to

           return $this->product->url;
          }

     public function getQty()
          {
           // return the qty of the product/item

           return $this->qty;
          }

     public function getProduct()
          {
           // return the actual product which was sent via the constructor

           return $this->product;
          }

     public function extendedPrice()
          {
           // return the total price of the product/item minus discount

           return ($this->qty * $this->getPrice * (1 - $this->discount);
          }

     public function discountedAmount()
          {
           // return the total discount amount of the product/item

           return ($this->getPrice * $this->discount);
          }

     public function getDownload()
          {
           // this is just extra function to return a download material
           // maybe not applicable or it may! remember that a product is vast!

           return $this->product->download;
          }
    } // end class Item

/**
 * Usage:
 *
 * $item = new Item($qty, $product);
 * or $this->item[$id] = new Item($qty, $product);
 */
?>
Now that we got an Item class, we can just go ahead and build a 'Cart' class to put (or manipulate) that Item class. For example:
<?php
/**
 * this class is a model class in an MVC scheme of thing
 * see my other tutorial about MVC called Advanced Pattern Programming: MVC
 * as you can see in the namespace, you can put all of your model in a folder called 'model'
 */

namespace path\to\model;

use path\to\model\Item;

class Cart
    {
     /**
      * 2nd attribute of the class (Cart):
      *
      * remember that the purpose of the 2nd attribute of the class is to store
      * property values that are constantly changing during the lifecycle of the application.
      *
      * remember that a shopping cart's purpose is to hold items and thoses items get
      * added and removed constantly.
      *
      * so clearly we need an array to hold those items and this array variable will get
      * used and manipulated constantly during the lifecycle of the application.
      */

     public $item = array();

     /**
      * 3rd attribute of the class (Cart):
      *
      * remember that the purpose of the 3rd attribute of the class is to calculate
      * and manipulate property values contain in the 1st and 2nd attributes.
      *
      * the bulk of building an application usually takes place in the 3rd attribute section of
      * the class, and here, there are no exceptions -- we do all of the cart's calculation and
      * manipulation tasks here in this 3rd attribute of the class (Cart).
      */

     // I'm going to leave this constructor blank for you to fill in your own things!
     // your application may need more features and you may need to use this constructor!
     // this cart class is a generic barebone class that you can build upon it to make
     // your ecommerce application more robust and powerful!

     public function __construct()
          {
           // not implemented for this example! it's not needed for this example!
          }

     public function getNbLineItems()
          {
           // returns the number of items in the cart

           return count($this->item);
          }

     public function getTotalWeight()
          {
           $totalWeight = 0;

           foreach ($this->item as $id => $value)
                 {
                  $totalWeight = $totalWeight + ($value->qty * $value->getWeight());
                 }

           // this function returns the total weight of all of the items in the cart
           return $totalWeight;
          }

     public function getTotalItem()
          {
           $totalItem = 0;

           foreach ($this->item as $id => $value)
                 {
                  $totalItem = $totalItem + $value->qty;
                 }

           // this function returns the total number of all of the items in the cart
           return $totalItem;
          }

     public function getTotalPrice()
          {
           $totalPrice = 0;

           foreach ($this->item as $id => $value)
                 {
                  $totalPrice = $totalPrice + $value->extendedPrice();
                 }

           // this function returns the total prices of all of the items in the cart
           return $totalPrice;
          }

     public function setItemQty($id, $qty)
          {
           if ($qty == 0)
              {
               $this->removeItem($id);
              }
           else
              {
               $this->item[$id]->qty = $qty;
              }
          }

     public function isEmpty()
          {
           // return true if the total number of all of the items in the cart = 0
           // in other words, return true if no items in the cart

           return ($this->getNbLineItem() == 0);
          }

     public function addItem($id, $qty, $product)
          {
           // if item exists, it is an old item, so simply update the qty to it
           // else, it is a new item, so add this new item to the cart

           if ($this->getItemQty($id) > 0)
              {
               $this->setItemQty($id, $qty);
              }
           else
              {
               $this->item[$id] = new Item($qty, $product);
              }
          }

     public function removeItem($id)
          {
           // if there is an item (with this $id) in the cart, remove it
           // remember that $this->item refers to all of the items in the cart

           if (!$this->isEmpty())
              {
               $tmp = array();
               foreach ($this->item as $idList => $value)
                     {
                      // if an item in the cart is not the item with this $id, then put it in $tmp

                      if ($idList != $id)
                         {
                          $tmp[$idList] = $value;
                         }
                     }

               // store all of the items that are not the target of the deletion
               // in other words, the deleted items are not stored in $this->item anymore!

               $this->item = $tmp;
              }
          }

     public function hasDiscount()
          {
           // iterating over all of the items in the cart to see if any item has a
           // discount attached to it, then return true!

           foreach ($this->item as $id => $value)
                 {
                  if ($value->discount > 0)
                     {
                      return true;
                     }
                 } // end foreach


           return false;
          }

     public function removeAll()
          {
           // by initializing the variable $this->item to equal to an array() function,
           // it erases the variable 'item' to equal to null! or equal to an empty array!

           $this->item = array();
          }
    } // end class Cart


/**
 * Usage:
 *
 * $cart = new Cart();
 *
 * $catalog is an array containing a catalog list of items for sale
 *
 * you pass in an id and a qty that you want to purchase available in the catalog
 * that you pass in as well!
 *
 * this is mimicking a person looking at a catalog full of items for sale and choosing
 * an item id and the qty to purchase.
 *
 * that's what this line of code (below) does!
 *
 * and that's what this class 'Cart' does!
 *
 * $cart->addItem($id, $qty, $catalog[$id]);
 *
 * of course, you have to use session in the addItem() call in order for it to persistence
 * the session!
 *
 * this is a very elegance way to program a shopping cart by providing a lot of different catalogs
 * with different kinds of items and depending on what a particular shopper is looking at which
 * catalog, you pass that catalog to this function 'addItem'.
 *
 * you normally do your cataloging coding logic in the "external" controller to select and switch
 * which catalog to pass in to function 'addItem'.
 *
 * if you implement your session properly in the addItem() call (in controller) it will persist the session for you!
 * $cart = new Cart(); // this is should be in the external controller
 *
 * the call to $cart = $cart->addItem() adds the items in the array variable $item (or referring to as $this->item)
 *
 * $base->set('cart', $cart); // you need to persist the session as well!
 *
 * then in the view, you can iterate through the array variable $item using foreach(), for example:
 *
 * $cart = $base->get('cart'); // assuming you have $base as an instance of class Base
 *
 * foreach ($cart->item as $id => $product)
 *
 * with $id being the product id contains in the catalog!
 *
 * and $product being the product/item profile: product name, price, description, url, image, etc.
 *
 * from this basic generic guideline you should be able to build a very sophisticated ecommerce
 * application, large or small easily and powerfully!
 *
 * there you have it!
 *
 * and have fun at it!
 */
?>
As you can see from the above example, you can have all kinds of catalogs displaying to shoppers and when a shopper selects a particular item, your "external" controller should be able to detect which catalog is being used. There are lots of ways to implement that feature and one of them is to send it in a form that contains the item profile along with the catalog name. For example:
<?php
/**
 * for the form's 'action' attribute it contains a route called 'cart/add'
 * this will route to a controller class called Cart and its method called add.
 *
 * of course, you have to implement it in an MVC scheme or else change it to: cart.php.
 * id being the product id
 * qty being the product qty that a shopper is buying
 * catalog is the catalog name that the shopper is buying the product from
 */

<form action="cart/add" method="post">
<input type="hidden" name="id" value="<?=$id?>" />
<input type="hidden" name="qty" value="1" />
<input type="hidden" name="catalog" value="<?=$catalog?>" />
<input type="submit" name="submit" value="Add to cart" />
</form>
?>
As far as the catalogs are concern, they are basically arrays of items/products that contain the product profile or attributes: product name, id, price, description, url, image, etc.
How you implement that catalog feature is up to you. One way is to store catalog items in the database and then query the database to pull the catalog items and then put them in the array and then displaying them in your catalog/website for shoppers to view/purchase.
The possibilities are endless, the sky is the limit!
There you have it!
Have fun programming sophisticated eccomerce platforms and don't forget to thank me later!!!
What is a software developer?
A developer - also known as a programmer, coder or software engineer - is an IT professional who uses programming languages to create computer software.
What do software developers do?
Developers write, test, debug and maintain applications. Developer roles can vary widely depending on the type of organization. They are usually employed by either the technology companies that create off-the-shelf software or by end-user organizations - both in the public and private sectors - who develop bespoke applications. But coding, as we will see below, is just one important element of an increasingly broad role.
What skills do you need to become a software developer?
To answer that, here is an article by Mark Samuels that appeared on ZDNet which tells you everything about the programmer role and how it is changing.
Developers need strong technical aptitude. Some programmer positions will require a degree in a relevant field such as computer science, information technology, mathematics or engineering. While education is important, the fast-evolving nature of software development means on-the-job experience will be the key to successful career development.
What programming languages do software developers use?
Software development is a constant work in progress. The 2020 Harvey Nash Tech Survey found that a third of developers believe their current skills will only be relevant for the next three years.
Right now (as of the decade of 2020), JavaScript is the most popular programming language with 13.8 million developers, according to SlashData. The UK firm estimates that the JavaScript community accounts for a big chunk of the 24.3 million active developers worldwide.
SlashData says the second largest population of 10.1 million developers are Python users, which is popular with machine-learning specialists, while there are now 9.4 million Java developers. These top-three programming languages are the same as developer analyst firm RedMonk's rankings, which are based on data from GitHub and Stack Overflow.
Other popular programming languages include C/C++, C#, PHP, Kotlin, Swift, Go, Ruby, Objective C, Rust and Lua.
Language popularity can be cyclical. Take the recent re-emergence of Fortran in Tiobe's programming index at 20th position, up from 34th spot a year ago. Fortran emerged from IBM in the 1950s but remains popular in scientific computing.
What makes a good software developer?
Rob Grimsey, director at recruiter Harvey Nash, says there are many attributes to a good developer - and inevitably 'good' means different things to different organizations.
"What everyone will look for as a base requirement, of course, is a high degree of technical capability, founded on solid coding principles and the ability to work well in a variety of development environments," he says.
However, there's a further dimension to being a good developer that goes beyond a strong grasp of coding languages. Grimsey says a good developer is part of a team, especially with the modern focus on Agile software development. Agile is a set of collaborative methods and practices for producing software code faster and more efficiently.
"Developers might be involved in a daily stand-up and other interactions. The ability to communicate, contribute ideas, and understand the wider business context of the organization's requirements - all of these are crucial. Developers are having to play a more interactive role and help bring ideas to life," says Grimsey.
What's the demand like for software developers?
The simple answer is high. Skills shortages were bad enough before the pandemic - and Harvey Nash reports demand continues to outstrip supply today, especially in software development, cybersecurity, and data. "There is high demand for developers and it seems to be getting higher all the time," confirms Grimsey.
Take job listings for PHP, which is a commonly used but not particularly loved programming language. The number of entry-level PHP developer roles has increased a massive 834% since January 2020, making it the fastest-growing tech job across the industry, according to Indeed's data.
When the first UK lockdown began in March, Harvey Nash saw a pause in recruitment for many kinds of roles - but not for developers. Grimsey say developers were essential in enabling businesses to go through rapid digital transformation. Companies used collaborative technologies to tap into a wider talent pool from around the globe. However, the battle for talent remains fierce.
"Businesses have realized as a result of COVID, and the new remote-working model, that they can recruit from a much wider geographic spread, which is positive. But even so, that doesn't solve the problem. If you're a good developer looking for work, you shouldn't be looking for very long," he says.
What's the demand like for software development training?
Once again, the answer is high. Computer programming and software development were the top choices for people looking to improve their employment opportunities in 2020, according to technology firm Red Hat, with almost one in 20 adults taking up coding or some form of software development training last year.
Expect demand to continue to rise as we leave lockdown. The new normal of work will bring a lot of changes, but one enduring theme will be upskilling and learning new programming language tricks, with many of the most popular courses - from specialists like Coursera, Udemy, Pluralsight and Udacity - available for free or with a subscription.
Industry experts suggest there is already evidence of software development skills spreading beyond the programming community. Warren Breakstone, managing director and chief product officer for data management solutions at S&P Global Market Intelligence, believes technical knowledge has become more widely accessible.
"The next generation of clients we have are coming out of school and they already know Python and R. Rather just knowing how to use Microsoft products, they're coming out with expertise and knowledge around these newer development methodologies, such as Python, which makes data, data analysis and data science far more accessible," he says.
How big a threat is low-code/no-code development to software developers?
The democratization of software development knowledge isn't the only threat to established coders. Emerging technology might well help to fill part of the IT skills gap in the form of no-code/low-code development tools.
The tools cut, as much as possible, the hands-on knowledge required to build software. Tech analyst firm Forrester predicts the low-code market will grow 40% annually to top $21 billion by 2022, while fellow analyst Gartner forecasts low-code platforms will account for 65% of all app development by 2024.
However, it's important to state that the end of hands-on development is far from certain. Sophisticated applications will always require a professional programmer's skills. And there is some hope that no-code tools can free-up developers to work on some of those higher-level business engagement tasks that senior managers are so keen for coders to assume.
"Low-code won't kill the demand for developers but rather will mean that they need multiple skills," says Harvey Nash's Grimsey. "They'll be looked to as problem solvers with full-stack capabilities. So they won't only be involved in writing code for the core application build, but ultimately the full journey of a piece of software or application."
What's the key to being a successful software developer?
Tarah Lourens, chief product and technology officer at property specialist Rightmove, is a former developer, so she understands the kinds of skills that will help talented software engineers stand out from the crowd. Like others above, she suggests coding is just a crucial jumping-off point for successful developers.
"I've always been passionate that the right mindset is less about the coding and more about what we are trying to apply this technology to," she says. "We need people who can find the right balance between building great code and delivering business outcomes. The more you can do that, the further you're going to go."
That's a sentiment that resonates with Boots CIO Rich Corbridge, who says that having an eye on innovation - and using your creative ideas to help solve business challenges - is likely to be a key marker for long-term software development success. That's certainly something he's seen during the coronavirus pandemic at Boots.
"Some of the best things that we've seen coming out in the past 12 months have been inspired by engineers sat around and going, 'What if we did this?' And that ranges from true coding of new stuff all the way through to the implementation of a tool like Adobe Audience Manager and considering 'what if we did something differently; what happens to the speed of the site or the ability to transact?'"
What roles can software developers move into?
The most obvious step is to senior programmer. As well as coding and testing, senior developers will start to work more closely with the business to identify their business requirements from software. This kind of engagement leads some developers into business analyst and possibly enterprise architect roles, where the emphasis is on investigating and developing an overall application strategy for the business.
Developers who get a taste for leading others can step into team leadership roles. Those who want to go further up the career ladder still can explore project management roles, where their experience of developing software can be used to help lead specific technology initiatives. What's more, the increasing use of Agile software development principles across the business means experienced developers with good engagement skills are likely to be in high demand.
How can software developers step up into more senior positions?
The key to stepping up is going beyond coding. Modern developers need to think about how their knowledge can help the business create value from technology. Boots' Corbridge says his organization tasks its senior developers with making sure the business gets the most from its vendor partners, such as Cognizant, TCS and IBM.
"We tend to have more of the lead engineer role leading those partners in what they do," he explains. "Our skill set is around being able to touch and see what's going on across the development of their products. People who have the capability to be close to the business and understand what the business needs, and where the product is going to keep us up to date."
Making the most of partners is not always a straightforward task. Like so many other modern organisations, Boots is keen to use Agile software development techniques. Corbridge says it's his senior developers' role to ensure that the software that his team and its partners produce can be adapted flexibly as business requirements change.
"If we're doing fixed-price deliverables in an Agile world, the two things don't make easy bedfellows. So trying to manage any of our partners to a fixed-time contract - but against an agile burn-rate framework, keeping on top of where that's going and how that's working - has been a big lead engineer-type role in the past 12 months or so," he says.
What's the pay for a software developer?
Glassdoor suggests the average pay for a developer in the UK is around £40,000 (for the current timeframe of 2020 to 2024), although rates and pay vary significantly with experience, skill and geography and as time moves into the future. Skill-training platform CodinGame suggests developers in the US are likely to command the biggest salary, with an average software engineer grossing $95,744 per year.
Coding specialist Stack Overflow reports that Scala is the programming language associated with the highest pay in the US, with an average salary of $150,000. Other languages with a salary of at least $120,000 include Go, Objective-C, Kotlin, Perl, Ruby, Rust, C, Swift, Haskell, Assembly, Bash/Shell/PowerShell, C++, Java, Python, and TypeScript.
What's the future of the software developer?
Despite ongoing evolution in coding techniques and the rise of no-code development, the role of software developer is not under threat - but it is changing. Harvey Nash's Grimsey says the role is becoming more consultative with more stakeholder-facing emphasis.
"It's a shift that's already begun - the role will be about a whole lot more than writing lines of code, with many complementary skills required," he says. "Developers may get more involved in discussing the brief with their client, fleshing it out and iterating ideas."
Rightmove's Lourens also recognizes this shift. She says successful software engineering is no longer about what languages you know and is more about how developers can apply their mindset and aptitudes to the challenges the business faces.
"Things are moving so fast now that at the time you're assessing somebody on a language, it's already changed - there's a new version. I think over time, successful software engineering will become more and more about somebody's mindset first and then about the specific technical skills they've got," she says.
"I think that should open up the industry, too. For so long, success in the technology industry has been about what exposure you've had and what systems you've built in what language, which immediately closes down the opportunities for people. So, from a diversity point of view, I think the change in mindset is also a potential enabler."
What is a W3 (or World Wide Web) Consortium?
The W3 Consortium (W3C) is a group founded by Tim Berners-Lee in 1994 to allow Web developers develop interoperable technologies (specifications, guidelines, software, and tools) to lead the Web to its full potential. The World Wide Web was invented by Tim Berners-Lee in 1989.
Without this group, who knows what the Web standard would be today if each group (or technology company) develops their own seperate Web standard for all of us to use?
Remember the browsers war between Netscape and Microsoft in the 1990s? Two different technology companies wanting their own broswer standard to be adopted by users and the casualty of that war, which is being felt today and beyond, is that we have to program code using two different standards to port to both browser standards.
Since then, the W3C has taken the bull by the horns and basically sets most (if not all) of the Web standards we enjoy today. A very nice reprieve from the constant squabble of the old days.
The following lists the standard specifications set by the W3C.
Understanding the HTML 5 Specifications
HTML 5 SpecificationUnderstanding the CSS Specifications
CSS2: Cascading Style Sheets 2.1 Specification
Descriptions of all CSS specifications
Understanding the Javascript Specifications
ECMAScript 2022 Language Specification JavaScript language resourcesUnderstanding the XML Specifications
XML SpecificationUnderstanding the XBRL Specifications
eXtensible Business Reporting Language (XBRL)Understanding the WebRTC Specifications
Web Real-Time Communications WebRTC Priority Control APIUnderstanding the Devices and Sensors Specifications
Device Posture APIWhat is a FileZilla ?
A FileZilla is a program that transfers files to and from a server. In other words, FileZilla can transfer files from your computer to a server and as well as can download files from that server back to your computer.It is typically being used by website owners who need to upload their website files from their local computer to a remote server that their website is hosting on. You can also use FileZilla to download files from a remote server that your website is hosting on as well.
So it is a file transfer application using an FTP file transferring protocol. So FTP is an acronym for File Transfer Protocol.
As always, lots of tutorials on this subject are available on the Internet, particularly on YouTube and elsewhere in HTML. So instead of actually doing a tutorial that can be found easily on the Internet, I'm going to just refer you to those tutorials and let you follow those tutorials instead. Why is there a need for me to do a tutorial that is readily available on the Internet? The answer is that absolutely no!
So here we go:
Here are brief summaries of steps on how to configure FileZilla client after you'd watched tutorials listed above and as well as having FileZilla downloaded and installed onto your computer.
Download the FileZilla onto your computer.
Once you've downloaded it, extract it using zip extracting applications like WinZip Express Zip WinRAR or WinRAR here! PeaZip
Collecting FTP Details
After you installed FileZilla onto your local computer, you now are ready for the transferring process. But first thing first, you need to gather the FTP details of your hosting account. Each hosting provider is different in how they layout their FTP information. For Hostinger users, the information is located in the hPanel's menu, under:
Files -> FTP Accounts
Most hosting providers have a dashboard area or webspace area where you can see options to choose to go into more specific tasks. For example, for my hosting provider, it has a dashboard that shows all kinds of options for me to choose. For example:
Here, when I click on an FTP Manager, it takes me to an FTP manager area where I can setup/create FTP accounts. In the FTP manager I can create an account by creating a username and a password. I will need these information that I created to be used in the FileZilla. Here is what the inforamtion in the FTP manager looks like:

Once you have an FTP information, you can use it to configure FileZilla. Now all you have to do is click on your FileZilla icon to open it and you'll see a screen that looks like the following:
As you can see in the diagram above, on the left side is for a local working area or section. This is where you can configure your connection information and selecting files or directories to upload to a destination on the right side. On the right side is a remote site or destination area to upload to.
In the above diagram, you can provide information to do a "quick connect" connection. However, I strongly suggest that you don't use a quick connect but instead go through a longer connect, which I will detail it for you. It will save you time later on. A quick connect doesn't remember your connection setting after your computer is turned off, while a longer connection will.
Here is for the longer and more efficient connection:
Click on "File" at the top left corner of the diagram shown above. The drop-down menu will reveal several options but you want to choose "Site Manager" option. A site manager screen should open up and should looks like the following:
Pay close attention to a section called "Select Entry" where all of your FTP accounts are to be created. In my case, I have four FTP accounts: one account to connect to a Monday-Sunday website FTP hosting account; another to connect to a Noon2Noon.NET FTP hosting account; another to a Postal FTP hosting account; and finally to a ZeroNilZilch FTP hosting account.
So in my case, I have four different hosting service providers; and therefore, I need to have four different entry names (Monday-Sunday, Noon2Noon.NET, Postal, ZeroNilZilch), each connecting to its individual FTP account.
So in your case, the "Select Entry" section and "My Sites" area should be empty because you haven't create a "New Site" yet.
To create a "New Site" entry name similar to the four shown in my case, click on another option called "New Site" down below at the bottom of the diagram. Once you click on "New Site" option, an entry inside the "Select Entry" under "My Sites" area will appear for you to enter an entry name similar to the four entry names that I've created.
Name your entry name any name you like. It's just a name to differentiate from one entry name to another.
Once you created an entry name, you need to configure FileZilla to connect to your FTP hosting account by hi-lighting an entry name similar to what is shown with ZeroNilZilch right now. As you can see, once you hi-light it, the entire diagram flickers and changes the configruation and reveals input boxes for you to enter an FTP information.
For example, for me, I hi-lighted or selected 'ZeroNilZilch' in the "Select Entry" section, and then to the right, I entered 'zeronilzilch.com' in the host box.
This information is obtained from my FTP hosting account created earlier. In your case, you can get this information and the rest of the FTP information from your FTP hosting account.
For port, I use 21, which is a common port for a shared hosting. All you need to know about port is that if you rent or use a free web hosting from any vendor, use port 21, because most likely they're shared hosting. All shared hostings use port 21.
For protocol, select FTP; for encryption select FTP over TLS (just like what it looks like on the screen); for logon type, use 'Normal'; for user (or username) enter the actual FTP username you got from your hosting vendor; likewise, for the FTP password.
That is it! Nothing else to enter. Very easy! Now all you have to do is click on the button "Connect" to connect to your FTP hosting server to begin the transfer process.
After you click on "Connect" it should looks similar to the partial diagram shown below. I show only partial diagram to avoid revealing my other information to the public. But this partial diagram should give you a good idea of how it works.
As you can see, it is very easy to use FileZilla.
Now since you've created your connection the longer and more efficient way, next time you need to connect to your FTP account, just open up your FileZilla application that should looks like the default view similar to the one that has a "quick connect" option on it (shown earlier).
Yes, that is the default view of FileZilla (shown earlier) allowing you to either do a "quick connect" or do a longer more efficient connect.
So since you went through a series of steps to do a longer and more efficient connect already, now all you have to do is click on one of two things:
First the hard way:
You can click on "File" at the top left corner of the diagram shown above. The drop-down menu will reveal several options but you want to choose "Site Manager" option.
A site manager screen should open up and should looks like the "Site Manager" diagram shown earlier. From there, all you have to do is hi-light an entry name to make it looks like the one shown on "ZeroNilZilch." This will activate your FTP account setting and ready to be connected to. Next, just click on the "Connect" button and it will try to connect to your FTP hosting account.
Well, that was somewhat the hard way. Sort of!
Now the easy way:
The same thing: you can click on "down arrow" or a drop-down menu just below "File" at the top left corner of the diagram shown above. The drop-down menu will reveal an entry name (or several entry names if you have more than one as in my case).
Now all you have to do is click on an entry name in the drop-down menu and a "Site Manager" showing your entry name is shown ready to be connected to your FTP hosting account. Next, just click on "Connect" button and it will try to connect to your FTP hosting account.
Once connected it should looks something like a partial diagram shown below.
Since it is a partial listing of the actual full view, you're not able to see all options you can do with the connection. You'll have to make use your FileZilla on your own from here on. It is very easy because all the hard part has been explained and now is just the easy part.
Well actually, you can see a somewhat full view of the default view shown earlier and you should get a good idea of how you can select a particular file or directory to upload to.
But briefly, as you can see from the above diagram, there are two parts: one on the left side contains your local file directories where you can select and upload them to the destination on the right side. Simple enough?
On the left, because of a partial listing, I am not able to show you that you can actually select or pull down a drop-down menu to select any directory from your local computer to upload to the destination on the right side. Yes, you can select or pull down a drop-dwon menu on the left side and select any directories or files to upload to the destination on the right side.
Likewise, on the right side, you can select (or pull down a menu--well, mainly select) a directory to receive the content being uploaded to it. In other words, to upload a file or files or directory or directories, you need to know where in directory destination you want to upload the content from the left side to on the right side. Self-explanatory!
Once you've selected the destination directory on the right, and then you can go ahead and upload the content on the left side by hi-lighting or selecting it and right-click it to reveal several options. One of the options is "upload" and select "upload" to upload it. Self-explanatory!
Likewise, on the right, you select a particular file or files or directory or directories by hi-lighting it and then right-click it to reveal several options. One of the options is "download" and click on it to download. Self-explanatory!
That is it! Have fun using FileZilla.
A very brief introduction to one of the most important and valuable pattern programming methodology that ever developed in the programming world: MVC
For a very good introductory tutorial on the Web, please check out the following tutorials:
The MVC Pattern: PHP, MVC and Best Practices The MVC Pattern and PHP, Part 1 The MVC Pattern and PHP, Part 2 The MVC Pattern: An Introduction to the Front Controller Pattern, Part 1 The MVC Pattern: An Introduction to the Front Controller Pattern, Part 2For a more advanced pattern methodology, please check out MVVM (Model-View-ViewModel). MVVM was invented by Microsoft for desktop programming in 2005 using event driven programming techniques.
MVVM was invented by Microsoft architects Ken Cooper and Ted Peters specifically to simplify event-driven programming of user interfaces, i.e., GUI applications. The pattern was incorporated into Windows Presentation Foundation (WPF) (Microsoft's .NET graphics system) and Silverlight (WPF's Internet application derivative).
MVVM is more suiteable for desktop programming than Web programming.
So if you're programming for the Web use MVC and if you're programming for the desktop use MVVM.
Advanced Pattern: The advantages of MVVM over MVC Advanced Pattern MVVM For Desktop: Model-View-ViewModel Design PatternFor a more advanced pattern methodology using MVC, please check out on the 'how to build your own framework':
Advanced Pattern in MVC: Code Your Own PHP MVC Framework Advanced Pattern MVC and PHP: A Beginner's Guide To MVC For The Web ProgrammingWhat is an MVC ?
An MVC is an acronym for Model View Controller.
It is a methodology to uniform the way people program applications. Remember that in programming, programmers tend to have their own unique way of doing things and that causes a lot of confusions, especially in a team work where programmers are working in the same project. There is no way of knowing what each programmer is trying to do in the same project. There is a compatibility issue.
There is no uniform pattern way of doing things; each programmer is doing things each his/her own way of doing things; for example, in a team work in the same organization working on the same project, one programmer puts data handling with the organization of that data while another programmer puts the same data handling with the displaying of that data to users; and the two programmers are completely oblivious to what the other programmer is trying to do.
This causes the finished product to be in-efficient, in-compatible, and not robust and not to mention the cost of having programmers to do other similar projects that take a long time to complete because of the codes are not re-usable.
So to be efficient, robust, scalable, upgradable, re-usable, and easy to maintain, it has to be a unique way of doing things for all programmers to understand and work in a uniform way so that all programmers can know systematically what the other programmers are doing in the same project, even if each programmer is located far away from each other and haven't seen each other's actual work.
To solve this issue, the MVC was developed.
To understand the concept of MVC, think of it in term of an organization mentioned above where there is a manager, some programmers, and the customers who want to get the application done.
The customer is the view presenting to the manager of what to be done, telling the manager the criterio of what need to be done. For example, the customer may wants the website that has ecommerce and social media applications capability installed in it.
The manager is the controller, handling the organization (or criterio) of the task dictating and given by the customer.
The programmers are the model handling of data or instructions given by the manager and using those instructions from the manager to proceed to do all of the programming work.
Notice that the manager, or the controller, does not know how programmers perform their tasks for the project: he/she doesn't care how their programmers do their jobs as long as their programmers perform the task that meets the criterio given to them.
Likewise, the programmers know nothing about who the customer is and what he/she looks like or wants. The programmers don't really care who the customers are; all they care about is getting the task done.
Likewise, the customer knows nothing about who the programmers are and what they look like or where they're at or from. The customer only cares about is getting the website completed in the agreed timeframe.
And also, the programmers don't know how the manager got the instructions or whom he'd or she'd got it from. The programmers don't know what the heck the manager is doing either: the programmers just don't care what the manager is doing or how he/she is doing. It's not their job to know what the manager is doing.
Keep this seperation of concern in mind when you're dealing with MVC pattern.
As you can see, the three parties are completely independence of one another: in other words, they don't need to know what the other is doing or how the other is doing things. They all can do things in their own seperate unique ways without intertwine with one another.
Now imagine you're a large or small organization where you have lots of programmers working on all kinds of applications large or small and those programmers are spreading all over the world.
If all these programmers know MVC pattern, they can work on the same projects in different part of the world without knowing what the other programmers are doing on the same projects that they're working on.
This is the beauty of an MVC pattern where one group of developers working on the same project as the other group is located in far away from each other and they still can accomplish the same project without knowing what the other groups are doing.
In an MVC pattern, each party is seperate from one another and each party knows nothing about what the other party is doing. In an MVC pattern, each party doesn't need to know what the other party is doing as long as each party is doing its job in a unique/uniform way using MVC pattern.
Let's review: the customer requests to the manager telling the manager of what kind of application needs to be done; the manager, in turn, tells the programmers what tasks need to be done. That is all! Nothing else!
The customer doesn't know what the manager or the programmers are doing as long as the application gets done; while at the same time, the manager doesn't need to know what the programmers are doing as long as the task of getting the application done; and likewise, the programmers don't need to know what the customer looks like and how that customer's exact words to the manager -- it doesn't matter.
When you approach to building an application in an MVC pattern, think of the above analogy -- it will help you a lot.
Think of the analogy above and relate it to this: The view V is the display page (or customer in this case); the model M is the data (programmer in this case); the controller C is the coordinator, organizer, delegator, dictator, controller (or manager in this case).
Here is a brief example on how to program in an MVC pattern.
As you maybe well know that an HTML page is just nothing more than plain HTML texts along with some anchor links, buttons, or forms. That's all an HTML page is. And that is the view V.
Typically, the index.php front page or a catalog page or an HTML form is the view 'V' rendering the page to the customers/users to allow customer/users to navigate through the pages looking to do/order things.
In the index.php front page or a catalog page or form, there should be some buttons or links for customers/users to navigate to the products or area of interest.
That's all the view 'V' is; nothing special: just HTML pages or forms that contain contents and buttons or links. Nothing else!
Now when a customer/user clicks on the button or link, it redirects the customer/user to another part of the website or sometimes to another remote site.
Now before it reaches another part of the website or another website remotely, it has to go through a controller 'C' (or a middle man or a manager in our case). It has to hand over the instructions to the manager to decide on what to do next. Logically, a manager will hand over the instructions to programmers to start performing the tasks.
Remember that the programmers are the model M who do all the heavy work. The model also known as the data.
In the case of a button or link, it contains a url to redirect to:
'http://www.example.com/index.php?site/controller'
Before I show you how to parse this url (above), I want to show you the server access command using .htaccess file. Put this file in the same directory as your index.php in the root directory of your project. This index.php file is typically called a starting script file.
This .htaccess file is for the server to read before each time a website is loaded. This is sort of the instructions for the server on what to do before loading the website. You can tell the server what to do before loading your website using Apache's mod_rewrite commands.
This is the hand over the instructions to the programmers using routes.
The .htaccess file controls a number of ways that a website can be accessed, blocked, and redirected. It does this using a series of one or more rewrite rules. These rewrites are made possible by Apache's mod_rewrite module.
mod_rewrite provides a way to modify incoming URL requests, dynamically, based on regular expression rules. This allows you to map arbitrary URLs onto your internal URL structure in any way you like. For example, control how your querystring is formatted.
Open up your text editor and create a file called .htaccess and put the following content inside it.
File: .htaccess
# please remove all these textual comments because it may cause problems!

# the .htaccess file starts with this line

RewriteEngine on

# the above line says turn on the Apache server

RewriteBase /

# the above line says look for content after http://www.example.com/
# with '/' being the last '/' after '.com'


# next two lines say if a directory or a file exists, use it directly

RewriteCond %{REQUEST_FILENAME} !-d
RewriteCond %{REQUEST_FILENAME} !-f

# with !-d for a directory and !-f for file

# otherwise forward it to index.php (using the rule shown below)

# in other words, if none of the two conditions above is met or true,
# go to execute index.php, with index.php being the starting script file, i.e.:
# http://www.example.com/index.php

RewriteRule ^(.*)$ index.php?url=$1 [L,QSA]

# continuing on above line: after the 'index.php?' is the querystring
# this is like: ?controller/action/param1/param2/para3/para4/para5/...
# so this string: url=$1 [L,QSA] is just for the server to read!
# the "L" stands for link, the Q for query, S for string, A for append

# the string "url" is the name of the querystring that you will need to
# refer to when you parse your route. see function splitUrl() later on!


# the below two lines are just more rules and server options
# the first allow json file to go through and the second for options

RewriteRule \.(json)$ - [F]
Options -Indexes

# you don't need to understand any of this content in this file
# just use it "AS IS" but don't forget to remove my textual description!

# one important note: don't forget to remove the RewriteBase / entirely
# if for some reason your website doesn't load!
# I found that for some shared hosting it causes a problem!
# so if it doesn't load, just remove the RewriteBase / entirely

# for more on this topic, please Google the Web and there are
# plenty of tutorials on the Internet on the topic of .htaccess file!
What the above .htaccess file does is allowing you to do like this on your url route:
<a href="http://www.example.com/controller/action/param1/param2/param3/...">link</a>
or just:
<a href="controller/action/param1/param2/param3/...">link</a>
Normally you would have to send your "GET" url string like this:
<a href="http://www.example.com/?controller=site&action=signup¶m1=value1¶m2=value2¶m3=value3&...">link</a>
The above link will route the route to the class SiteController with 'site' is the controller 'C' and 'signup' is the action or the method in the class SiteController. The rest are just "GET" method querystring parameters.
But with the .htaccess file you can do a shortcut to make your life easier by using URL rewriting rules or mod_rewrite rules.
So this is without URL rewriting rule: <a href="http://www.example.com/?controller=site&action=signup¶m1=value1¶m2=value2¶m3=value3&...">link</a>
This is with URL rewriting rule: <a href="http://www.example.com/site/signup/value1/value2/value3/...">link</a>
or just a shortcut:
This is with URL rewriting rule: <a href="site/signup/value1/value2/value3/...">link</a>
As you can see, it is much simplier using URL rewriting rules in the .htaccess file.
For img:
<img src="image/picture_1.jpg">
Notice that for img tag, there is no route needed. The img tags are typically being used in the view to display images; and therefore, routes are not needed. So you simply specify the src attribute that points to the directory of the image as you normally do in a non-MVC way.
For forms:
<form method="GET" action="http://www.example.com/site/signup/param1/param2/param3/..."></form>
Or just:
<form method="GET" action="site/signup/param1/param2/param3/..."></form>
For buttons:
<button type="button" onclick="http://www.example.com/site/signup/param1/param2/param3/..."></button>
Or just:
<button type="button" onclick="site/signup/param1/param2/param3/..."></button>
Basically, instead of having to write a complete route of
<a href="http://www.example.com/site/signup/param1/param2/param3/...">link</a>
on every link that you need, all you have to do is write just the querystring:
<a href="site/signup/param1/param2/param3/...">link</a>.
That's what the .htaccess file is for: allowing you to do a shortcut!
You will often route your form like this:
<form action="http://www.example.com/user/signup/param1/param2/param3/..." method="GET">
Or in a shortcut like this:
<form action="user/signup/param1/param2/param3/..." method="GET">
to route your user to the signup page. Notice that this is for a "GET" method. For a "POST" method see below.
The user part is the controller 'C' and the signup is the action. The rest are just "GET" method querystring.
If it is user/signup/id/guest/vip/ then user (the first part is always the controller 'C' and the second part signup is always the action, and the rest are extra GET parameters or querystring to send to the route.
In this case, there are three extra parameters that are being sent to the route: id, guest, and vip.
Please check out tutorials on the Internet to learn all these terms. Please check the following tutorial for more:
The MVC Pattern and PHPThe two most important terms are controller and action. Make sure you know what these two are and how to use them.
Hint: the controller is the class and the action is the method of the controller class. For example: user/signup.
<?php
// this is the controller
class User
    {
     // this is the action
     public function signup()
          {
           // method code
          }
    }
?>
Note that you can use "POST" method as well and it will route your route via a "POST" and not via a "GET". For example:
<?php
<form action="user/signup" method="post">
<input type="hidden" name="id" value="My_id_123">
<input type="hidden" name="guest" value="This is the guest content">
<input type="hidden" name="vip" value="This is the vip content">
<input type="submit" value="Submit">
</form>
?>
The above form sends the POST variables to the route: user/signup. The .htaccess file routes this request through a normal HTTP REQUEST channel using a POST method.
DO NOT add the querystring in the POST method like you do with a GET method.
This is illegal: <form action="user/signup/id/guest/vip/" method="post"></form>
This is the correct way:
<?php
<form action="user/signup" method="post">
<label for="id">Enter your id:</label><br>
<input type="text" name="id" value="My_id_123">
<label for="guest">Enter your name:</label><br>
<input type="text" name="guest" value="This is the guest content">
<label for="vip">Enter your vip number:</label><br>
<input type="text" name="vip" value="This is the vip content">
<input type="submit" value="Submit">
</form>
?>
Remember that you handle a POST request the usual way where you send it to; for example, in the above case, it sends to the controller or class 'User' to execute the method signup(). Somewhere in the class 'User', particularly in the method signup(), is where you handle the request by doing this: $_POST['id'], $_POST['guest'], $_POST['vip'].
The keyword here is 'somewhere' because as you know the HTTP REQUEST once it is sent, it is available everywhere. So for class 'User', it is available everywhere inside it. Self-explanatory!
Now we need to parse the route or querystring.
This is also part of the handover of the instructions to programmers. Remember that managers only coordinate, delegate, and dictate the tasks to employees and do very little work.
<?php
// don't forget to put this class route in the folder: path/to
// or put it in whatever folder names you name them!
// 'path', 'to' are actually folder names containing the models or classes

namespace path/to;

class route
    {
     public $base = array();

     // now your main controller class will need to call
     // this method init()

     // you can do it inside your index.php starting file or from
     // inside your main application file, for example:
     // $route = new route();
     // $route->init();

     // for an example of a starting script file, see my other tutorial
     // called "how to autoload classes using SPL" and there is an
     // index.php file example shown at the very end of that tutorial!

     // see a lengthy explanation of the difference between an
     // index.php starting script file and the index.php/index.html
     // front page view [below]!

     public function init()
          {
           // class Base is the base controller class
           // I haven't written it yet! Maybe I won't!

           // did I mentioned that this is a very brief tutorial?
           // this will not be a complete tutorial! just to give you
           // an idea to move forward!

           // check out the Internet on topic of "MVC" base controller class!
           // basically, the "controller base class" is the main application
           // class that handles all the logic of the entire application.
           // see an example in my other tutorial called
           // "how to autoload classes using SPL"

           // manager coordinates, delegates, and dictates the tasks to employees

           $this->base = new Base();

           // get the url fragments from the url
           $this->splitUrl();

           // you need to require/include the appropriate file directory
           require_once 'resource/dispatch/dispatcher.php';
           $dispatch = new dispatcher();

           // basically test to see if the url fragment in $x1 exists!
           // suppose that a visitor of your website types in the
           // url bar: example.com and the browser will try to
           // to load: http://www.example.com/index.php

           // now when it gets to splitUrl() it will return:
           // $x1 is null, $x2 is null, $x3 is null, etc.

           if (!isset($this->base->x1))
              {
               // so it comes here because $x1 is null!
               // it will load the default file index page!

               // don't be confused the default index page file with
               // the starting index.php file!

               // the two are completely different from one another!

               // the default index.php/index.html page is your index
               // front page typically can be found in the view, while
               // the starting script file index.php is the file to
               // jumpstart the application!

               // for an example of the default index.php/index.html
               // front page, see class dispatcher->init()
               // where the code that looks like this:

               // manager coordinates, delegates, and dictates the tasks to employees
               // basically the manager is handling the finished product to the customer
               // for inspection to see if it fits the requirement!
               // $this->base->render('index');

               // as you can see, the statement above renders the view's
               // index file: index.php/index.html in the 'view' folder!
               // that's what the statement below is doing!

               $dispatch->init();

               // for an example of the script's index.php starting file,
               // see my other tutorial called "how to autoload classes using SPL"
               // and at the very end of that tutorial,
               // there is a script file called index.php

               // this script index.php starting file should be at the root
               // of your application!

               // if you look in my other tutorial called 'getting started
               // programming for beginners', there is a section called
               // 'How to Install WAMP on Windows', particulary, step 10.
               // At the very end of that section where I show a
               // localhost containing a sample application folder called
               // "MyFirstWebsite"

               // inside that folder there are only three items: 'css' folder,
               // 'image' folder and the main starting script file 'index.php'
              }
           elseif (method_exists('dispatcher', $this->base->x1))
              {
               // now here, $x1 is NOT null!
               // this is the case where you can do in the view like this:

               //      <a href="about">About</a>
               //      <a href="affiliate">Afilliate</a>
               //      <a href="signup">Signup</a>
               //      <a href="login">Login</a>

               // remember what a view is?
               // a view "V" contains only three main things: a page (i.e. webpage,
               // catalog page, form, etc.), some links, and some buttons!

               // that's all a view is

               // the above example will load the controller page:

               //     dispatcher->about(), dispatcher->affiliate(),
               //     dispatcher->signup(), dispatcher->login()

               // now what happens if you put an index "home" link/route in
               // the view like the following?

               //          <a href="index">Home</a>

               // here, x1 = 'index' but there is no method called 'index'
               // in the 'dispatcher' class!

               // so it won't come here and it will fall into the default
               // condition below and displays the 'index' home page!

               // now what happens if you put a link/route in the view
               // like the following?

               //          <a href="user/signup">Signup</a>
               //          <form action="user/signup"></form>
               //          <a href="user/signup/id/guest/vip">Signup</a>
               //          <form action="user/signup/id/guest/vip"></form>

               // obviously, x1, x2, and x3, etc, are not null!
               // and therefore, it will still come here as well with:

               //          $x1 = 'user'
               //          $x2 = 'signup'
               //          $x3 = 'id'
               //          $x4 = 'guest'
               //          $x5 = 'vip'

               // in this case, only x1 and x2 are relevant and both will be
               // dispatched to the appropriate controller.
               // see class dispatcher->user() later on!

               $method = $this->base->x1;
               $dispatch->$method();
              }
           else
              {
               // this is the default condition!

               // if none of the conditions above are met,
               // it will load the default index.php page!

               // now what happens if you put a link/route in the view
               // like the following?

               //          <a href="index">Home<></a>
               //          <a href="unknown">Unkown Link</a>
               //          <a href="noroute">Not Sure</a>

               // all will come here because x1 = index, unknown, or noroute
               // and x2 is null!

               // so none of the conditions above are met,
               // so all three cases above will come here and
               // load the default index.php page!

               // note that for your "Home" link, you can use the domain name
               // as well (your domain), for example:

               //          <a href="http://www.example.com">Home</a>

               // I recommend that you use the domain name for your "Home" link
               // to avoid problems!

               // if you use index or other unknown/undefined method of the
               // controller (as shown above), it might give you an error saying:
               // "Can't load the page! Please check your url to make sure it is
               // the correct link!"

               // so using the domain name as your "Home" link ensures that it
               // will load the default index.php page every time! no errors!

               $dispatch->init();

               // now what happens if you put a form route in the view
               // like the following?

               //   <form action="unknown"></form>
               //   <input type="hidden" name="test" value="some test value">
               //   </form>

               // it will come here also because x1 = unknown, and x2 is null!
               // here is the problem: the browser is confused!

               // some browsers will load the default index.php and some browsers
               // don't know what to do and display an error: Can't load the page!

               // notice that we're talking about forms and not anchors!
               // so the browser is confused!

               // if it is an anchor it is probably okay and not confused!
               // to solve this problem, for forms use the correct route:
               // user/login, cart/addtocart, etc.

               // so be aware of these scenarios!
               // in other words, make sure you specify the correct route/link!
              }
          }

     // handling the incoming instructions from the view!

     // if the controller exists then call the controller
     // also store the properties in the main application object to
     // be used later: $this->base->x1

     public function splitUrl()
          {
           // if you look in the .htaccess file you'll see this:
           // RewriteRule ^(.*)$ index.php?url=$1 [L,QSA]

           // check if the url GET parameter is set
           // now the 'url' part is where we test for!
           if (isset($_GET['url']))
              {
               // load the url into url variable
               $url = $_GET['url'];

               // trim the url to remove slashes on right:
               // user/signup/id/guest/vip/

               // becomes:
               // user/signup/id/guest/vip

               $url = rtrim($url, '/');

               // break the url into fragments:

               // $url[0] = 'user', $url[1] = 'signup', $url[2] = 'id',
               // $url[3] = 'guest', $url[4] = 'vip'

               // what happens if a user types in the url bar like:
               //       http://www.example.com ?

               // splitUrl() will try to split the GET parameters and $url is null!
               // in other words, splitUrl() cannot split the GET parameter:
               // there is none!

               // and the foreach ($url) loop below will return null as well!
               // and therefore, x1, x2, x3 also will be null!

               // now what happens if you put a link/route like the following?

               //          <a href="about">About</a>
               //          <a href="affiliate">Afilliate</a>
               //          <a href="signup">Signup</a>
               //          <a href="login">Login</a>

               // it will split the url and $url contains an array of one element:

               //          $url[0] = 'about'
               //          $url[0] = 'affiliate'
               //          $url[0] = 'signup'
               //          $url[0] = 'login'

               // and therefore, x1 = 'about', 'affiliate', 'signup', 'login'
               // and x2 and x3 are null!

               $url = explode('/', $url);

               // load the url fragments as the object property variables
               // as x1, x2, x3 ....

               // in other words, set the main application's properties!
               // notice that in PHP, you can declare a property on the spot
               // and set it on the spot as well! very neat, huh?
               // this is exactly what happens in the method set() below!

               // you need to write a set($property, $value) in your main
               // application controller class (Base) as well as a get()
               //
               // put the following two methods in your main base controller
               // public function set($property, $value)
               //      {
               //       $this->$property = $value;
               //      }
               //
               // usage get():
               //
               //    $base->get('x1');
               //
               // will return the controller, i.e.: user
               //
               // public function get($key)
               //      {
               //       if (isset($this->$key))
               //          {
               //           return $this->$key;
               //          }
               //       else
               //          {
               //           return null;
               //          }
               //      }

               foreach ($url as $key => $value)
                     {
                      $key++;

                      // this is basically setting class Base's properties
                      // so that we can use them later. see init() above!
                      // later, anywhere, we can do this:
                      // $base->x1, $base->x2, $base->x3

                      // this will become:
                      // x1 = $value, x2 = $value, x3 = $value ....
                      $this->base->set('x'.$key, $value);
                     }
              } // end if (isset($_GET['url']))
          } // end splitUrl()
    } // end class route
?>
Next is the dispatcher to dispatch the controller to the correct external controller.
Remember that there are two forms of controller: internal controller and external controller.
In this case, the internal controller are the class route and class dispatcher.
The external controller are the controller that actually doing the actual request to the model and as well as dictating to the view to display the view.
If you look in the method "user()" of the controller class "dispatcher" below, it creates an external controller by calling the createController() to create an external controller.
This is the manager who dictates to the programmers.
Remember that the manager only coordinates the job and doesn't do any heavy work at all! The heavy work is being done by the programmers.
As you can see below, the manager only asks the programmers to hand over the work by doing this: $base = new Base(). Now the manager knows nothing about what the programmers are doing inside class Base.
Now programmers all over the world can get to work on classes in their own seperate unique ways and none of them need to know what the others are doing. This is the seperation of concern of an MVC.
This example only shows one class or model; however, in a normal project large or small, there are lots of classes or model to be built and those classes or model can be given to groups of developers all over the world. And each group can work independently of one another without needing to know what the other groups are doing.
<?php
class dispatcher
{
public $base = array();
// now class dispatcher's init function
public function init()
{
// this method only contains two lines!
$this->base = new Base();
$this->base->render('index');
// that's it!
// the above call to render() tells the view to render
// the actual file in the 'view' folder!
// it is the controller telling the view to display the page
// view!
// the above call to render() will render the default front page:
// resource/view/index.php or index.html
// here is an example of render()
// method render() renders the view.
// this render() is incomplete as of now because I want you to
// implement your own version of render to suite your objective!
// how you implement your version of render() is up to you!
// but I suggest that you implement it using only two arguments:
// $this->base->render($view, $template);
// with $template, you might find it very useful to send in,
// say, a theme, or even a model!
// how you do it, it's up to you!
// you can make improvements to this barebone render() to make it
// more robust and powerful!
// notice that render() below, $template is an array and is
// initialized to null and you can call it like this:
// $this->base->render('index');
// $this->base->render('contact');
// $this->base->render('about');
// $this->base->render('affiliate');
// below, the first argument is the page: index.php or contact.php
// the second argument is the template or theme page or model or
// whatever!
// notice that you don't need more than two arguments!
// put the following render() code in your main application
// base class similar to the example class Base()
// public function render($view, $template[] = null)
// {
// // setting the view template to default theme or whatever!
// // I won't show you the example and leave it for you
// // to implement in your own unique ways!
// // this "if" block needs more work to suite your objective!
// if ($template == null)
// {
// // set it to default theme or whatever!
// $template = 'default_theme';
// }
// // right here where you can branch out to different
// // view/files/themes
// // you can branch out to tidbits of snippets of code
// // view as well
// // right here, you can implement code that looks for
// // certain view and files that resides in a folder
// // it's a very good idea to implement code that can
// // handle view in its own folder.
// // that way you can put certain view in certain folders
// // for modularity purpose!
// // as stated earlier, how you implement your render()
// // is up to you!
// // but here is one possible way of doing it:
// // you implement your first argument that can receive
// // two items: view/index
// // with 'view' being the folder and index being the file!
// // you can call it like this:
// // $this->base->render('view/index');
// // $this->base->render('affiliate/index');
// // $this->base->render('about/index');
// // $this->base->render('profile/index');
// // OR
// // $this->base->render('catalog/index', $template);
// // $this->base->render('cart/index', $template);
// // $this->base->render('admin/index', $template);
// // $this->base->render('product/index', $template);
// // I won't show the latter case and leave it to you to do!
// // notice that you can add as many folder levels as you want, for example:
// // $this->base->render('index/folder1/folder2/folder3/folder4/', $model);
// // and explode them into:
// // $view[0] = 'index'
// // $view[1] = 'folder1'
// // $view[2] = 'folder2'
// // $view[3] = 'folder3'
// // $view[4] = 'folder4'
// // now let's illustrate the first case!
// // right here inside this render() you can do this:
// if (strpos($view, '/'))
// {
// $view = explode('/', $view);
// // now $view is an array of two elements: a folder and a file
// // $view[0] = 'view', $view[1] = 'index'
// // $view[0] = 'affiliate', $view[1] = 'index'
// // $view[0] = 'about', $view[1] = 'index'
// // $view[0] = 'profile', $view[1] = 'index'
// // from there, you can branch out to display the view from
// // its own folder!
// // as far as the second argument is concern, it is very
// // much can be anything: a theme or a model or anything!
// // right here where you refer to the view files
// // stored in the directory:
// $file = "resource/$view[0]/$view[1]" . '.php';
// if (file_exists($file))
// {
// require_once $file;
// }
// else
// {
// echo ("View file <b>resource/$view[0]/$view[1]</b>" .
// '.php not found');
// }
// }
// else
// {
// // you need to put all of your view files in the directory/folder
// // called 'resource/view' or whatever folder name you desire!
// $file = "resource/view/$view" . '.php';
// if (file_exists($file))
// {
// require_once $file;
// }
// else
// {
// echo ("View file <b>resource/view/$view</b>" .
// '.php not found');
// }
// }
// // as stated above you can add as many folder levels as you want, for example:
// // $this->base->render('index/folder1/folder2/folder3/folder4/', $model);
// // but that looks very awful and cluttered!
// // another way is to use some sort of label marker or flag to mark how many levels
// // of folders you are targetting for. for example:
// // if a label marker says 'index/flag1' you have only one level of folder,
// // if a label marker says 'index/flag2' you have only two levels of folders,
// // if a label marker says 'index/flag3' you have only three levels of folders,
// // if a label marker says 'index/flag4' you have only four levels of folders,
// // if a label marker says 'index/flag5' you have only five levels of folders,
//
// // that looks much cleaner and maybe better than the long list of folders example above.
//
// // and in the view pages you can do like these:
//
// // $this->base->render('index/flag1', $model);
// // $this->base->render('index/flag2', $model);
// // $this->base->render('index/flag3', $model);
// // $this->base->render('index/flag4', $model);
// // $this->base->render('index/flag5', $model);
// // of course, you can have other files as well beside 'index.php'
// // just replace your actual file name in place of 'index'
// // and inside this render() you can do this:
// if (strpos($view, '/'))
// {
// $view = explode('/', $view);
// // now $view is an array of two elements: a file and a folder flag where:
// // $view[0] = 'index' // which is a file: index.php
// // $view[1] = 'flag1' or 'flag2' or 'flag3' or 'flag4' or 'flag5'
//
// // after the explode(), these scenarios could happen.
// // I'm just showing the 1st argument to illustrate the example:
//
// // if render('index/flag1') ===> then $view[0] = 'index' and $view[1] = 'flag1'
// // if render('index/flag2') ===> then $view[0] = 'index' and $view[1] = 'flag2'
// // if render('index/flag3') ===> then $view[0] = 'index' and $view[1] = 'flag3'
// // if render('index/flag4') ===> then $view[0] = 'index' and $view[1] = 'flag4'
// // if render('index/flag5') ===> then $view[0] = 'index' and $view[1] = 'flag5'
// //
// // now we need to test the flag for the levels of folder after we exploded them:
// //
// // switch ($view[1])
// // {
// // case 'flag1':
// // $file = "view/$view[0]" . '.php'; // view/index.php
// // break;
//
// // case 'flag2':
// // // resource/view/index.php
// // $file = "resource/view/$view[0]" . '.php';
// // break;
//
// // case 'flag3':
// // // view/template/path/index.php
// // $file = "view/template/path/$view[0]" . '.php';
// // break;
//
// // case 'flag4':
// // // guide/local/dir/view/index.php
// // $file = "guide/local/dir/view/$view[0]" . '.php';
// // break;
//
// // case 'flag5':
// // // source/store/cabinet/top/view/index.php
// // $file = "source/store/cabinet/top/view/$view[0]" . '.php';
// // break;
// // } // end switch
//
// // now that looks a lot cleaner!
// // anyhow, there are lots of ways to do this kind of thing and there is
// // no right or wrong way of doing it!
// // from here, you can branch out to display the view from
// // its own folder! for example:
// // first test to see if our levels of folders exist including its file
// if (file_exists($file))
// {
// require_once $file;
// }
// else
// {
// echo ("View file <b>$file</b> not found");
// }
// } // end if (strpos($view, '/'))
// } // end render()
// ***** END OF RENDER() *****
// you'll have to create a file called about.php and put it
// in the autoload directory!
// see my other tutorial called "how to autoload classes using SPL"
// do the same thing for the rest of these files:
// this is the manager telling the programmers to handover the task!
// maybe more appropriately the controller telling the view to
// display the model or data!
// the model is the the data to display: about.php
// the route for this method is: <a href="about">About</a>
public function about()
{
$this->base->render('about');
}
// the controller telling the view to display the model or data!
// the model is the the data to display: affiliate.php
// the route for this method is: <a href="affiliate">Afilliate</a>
public function affiliate()
{
$this->base->render('affiliate');
}
// the controller telling the view to display the model or data!
// the model is the the data to display: signup.php
// the route for this method is: <a href="signup">Signup</a>
public function signup()
{
$this->base->render('signup');
}
// DIDO!
// the route for this method is: <a href="login">Login</a>
public function login()
{
$this->base->render('login');
}
// DIDO!
// the route for this method is: <a href="profile">Profile</a>
public function profile()
{
$this->base->render('profile');
}
// this controller class Dispatcher's purpose is to dispatch controller
// to their proper destinations!
// it also displays static controller actions like about, affiliate, signup,
// login, profile, etc., on the spot without having to dispatch them anywhere!
// in other words, it calls render() directly on the spot without having
// external controller doing the job!
// by doing this (and by the look of this controller class 'Dispatcher'),
// it is very cluttered if you have lots of conttollers/actions!
// it will make this class very hard to navigate and debug!
// so static controller actions like about, affiliate, signup, etc., should
// be in external controller as well (as the following illustration shows!)
// so a better solution is to do what I'm attempting to do in the following,
// where you can create a controller method in your base/main
// application class similar to this example base class Base()!
// inside this main base class, you can create a controller method.
// this is my attempt to make this MVC application more robust and
// powerful by creating a controller instance and then call that
// external controller from within the inner controller (dispatcher/user) to
// execute that external controller (i.e., admin, cart, user, etc.)
// when a view sends a controller/action such as the route:
// <a href="user/signup">Signup</a>
// with 'user' being the controller and 'signup' being the action
// and it goes to splitUrl() and splitUrl() splits the url into pieces
// this might confuse some of you, in that, where 'user' is actually a
// method called user() instead of a controller class (as you'll see in a moment)
// this is because the objective of method user() is to create a controller class!
// so therefore, the route 'user/signup' can still be considered as the 'user'
// being the controller and 'signup' being the action
// remember the splitUrl() that exploded the url into pieces in class route?
// x1 is 'user' if the route is 'user/signup', 'user/logout', 'user/profile', etc.
// x2 is one of these: 'signup', 'logout', 'profile', etc.
// class route calls class Dispatcher() to dispatch to the proper controller!
// so in class route it splits 'user/signup' into pieces and then calls the
// method of the class Dispatcher() which looks like this:
// $base = new Base(); // assuming you have a main application class called Base()
// $dispatch = new Dispatcher();
// // so $method = 'user'
// $method = $this->base->x1; // with x1 being 'user', x2 = 'signup'
// this will call a method called 'user' of the Dispatcher class
// $dispatch->method;
// now inside that method user() you can call the controller like this:
// $x1 = $this->base->get('x1'); // 'user' is now a controller class
// $x2 = $this->base->get('x2'); // 'signup' is still an action or method
// now create the controller and call its action method
// $this->base->createController($x1)->$x2();
// remember that this class Dispatcher is a controller but this
// controller can have other external controller as well!
// sort of manager of managers: head manager having middle managers!
// I call them inner controller and external controller!
// some programmers call the two controller as 'frontcontroller' and
// 'controller', with 'frontcontroller' is analogous to my version
// called 'external controller' and 'controller' analogous to my
// version called inner controller('route' and 'dispatcher' classes).
// how you/I or anyone call them make no difference: all it matters is that
// there has to be two types of controller in order for it to work properly!
// put this method in your main application base class similar to class Base()
// so your main application base class should have a minimum of: a set(), get(),
// createController(), autoloading() using SPL, and render()
// public function createController($controller)
// {
// // here, you put all of your controller files in folder:
// // controller
//
// // this will load a controller class file like these:
//
// // controller/UserController.php
// // controller/AdminController.php
// // controller/CartController.php
// // controller/MediaController.php
//
// // make sure to name your external controller files accordingly!
// // e.g., UserController.php, AdminController.php, etc.
//
// // the reason that you append the word 'Controller' to your
// // external controller files is to differentiate them from
// // other classes, say, 'model' and 'view'!
//
// // then in the external class definition, you can name your
// // external controller classes accordingly, e.g.,
//
// // UserController, AdminController, CartController, etc.
//
// // you can convert the first letter in $controller to uppercase
// // using function ucfirst()
//
// $controller = ucfirst($controller);
//
// $file = "controller/$controller" . 'Controller' . '.php';
// if (file_exists($file))
// {
// require_once($file);
//
// // this is like: new AdminController, new CartController, etc ...
// $controllerObj = new $controller . 'Controller'();
//
// // return an instance of the controller class back to
// // the caller!
// // see an example controller class user below!
// return $controllerObj;
// }
// else
// {
// echo ("$controller" . 'Controller not found.');
// }
// ***** end of createController() *****
// right here, you can group all the action methods of class 'User'
// to call them: User->login, User->logout, User->profile, etc!
// don't mix up with function user() below with controller class
// 'User' later as in: createController('user')
// the call to createController('user') will create a controller class named
// 'User' or 'UserController' if you want to add 'Controller' to it!
// you can declare class 'UserController' to have a method called user()
// or any name you wish, but for this example I call it as user()
// the route for this method user() could be something like this:
// <a href="user/login/id/guest/vip">Login</a>
// or just:
// <a href="user/login">Login</a>
// which will get routed to class 'UserController' to have a method called user()
// <a href="user/logout/id/guest/vip">Logout</a>
// or just:
// <a href="user/logout">Logout</a>
// <a href="user/profile/id/guest/vip">Profile</a>
// <a href="user/admin_login/id/guest/vip">Admin Login</a>
// <a href="user/admin_logout/id/guest/vip">Admin Logout</a>
// <a href="user/admin_singup/id/guest/vip">Admin Signup</a>
// <a href="user/forgot/id/guest/vip">Forgot Password<></a>
// <a href="user/usernamecheck/id/guest/vip">Check Username</a>
// <a href="user/emailcheck/id/guest/vip">Check Email</a>
// and they all will come here to execute function user()!
// remember the splitUrl() that exploded the url into pieces in class route?
// x1 is 'user' if the route is 'user/signup', 'user/logout', 'user/profile', etc.
// x2 is one of these: 'signup', 'logout', 'profile', etc.
// so in the class route the code that calls 'user/signup' looks like this:
// $dispatch = new Dispatcher();
// $method = $this->base->x1; // assuming $base is an instance of class Base()
// this will call a method called 'user' of the Dispatcher class
// $dispatch->method;
public function user()
{
// x1 is 'user' if the route is 'user/login', 'user/logout', 'user/profile', etc.
// x2 is one of these: 'login', 'logout', 'profile', etc.
$x1 = $this->base->get('x1'); // assuming $base is an instance of class Base()
$x2 = $this->base->get('x2'); // assuming $base is an instance of class Base()
switch ($x2)
{
// the manager is asking the programmers to
// handover the tasks!
case 'login':
case 'logout':
case 'profile':
case 'admin_login':
case 'admin_logout':
case 'admin_singup':
case 'forgot':
case 'usernamecheck':
case 'emailcheck':
// right here, if any of the above case is met,
// it will come here to look for a specific
// controller action: $x2
// basically, $x2 is the action or controller
// method: login()
// we need to specify the external controller class as
// 'user' and it will route to that controller looking
// for an action method to execute!
// creating an external controller: 'user'
$this->base->createController('user')->$x2();
// you can pass the controller as a variable as well:
// $this->base->createController($x1)->$x2();
break;
default:
$this->init();
}
// as you can see, this is much more robust and powerful as it
// allows you to route to each controller class and to look for
// specific actions in that class!
// you can use this example method user() to do other external
// controller/action to make your MVC application more robust!
// notice that you can group these actions: about(), affiliate(),
// signup(), login(), profile() in a class of their own similar
// to the class 'User' and thus makes it more robust and powerful
// and less cluttered!
}
} // end class dispatcher
// as you can see, createController('external_controller_class') creates
// an instance of the external controller class!
// now you need to create those external controller classes!
// here is an example of the controller class User!
// this is the controller 'user'
// or if you want to differentiate your controller classes from
// other classes, you can append the word 'Controller' to the class
// name: 'UserController'
// see createController() example above for more detail!
// remember that these "external" controller classes are sort of middle managers,
// and in that, they tend to do a little more work than top managers.
// still, whether it is a top manager or middle manager, they should not
// do a lot of work!
// this means that these "external" controller classes should not do a
// lot of work either!
// all of the heavy work load is being done by the programmers (or the model).
// keep this analogy in mind as you work through the MVC pattern.
// there should not be any heavy work being done by the controller.
// these controller only need to know true or false. That's all! Nothing else!
// class User // UserController?
// {
// // public $base;
// // $this->base = new Base();
// // this is the action 'login'
// public function login()
// {
// // remember that this is the controller/manager
// // and the manager doesn't do any heavy work!
// // so the manager usually asks the workers to
// // do the actual heavy work!
// // so you should never have to do any heavy programming
// // in any of your "external" controller!
// // the controller should always asks the model to return
// // true or false whether the task is successfully
// // or not! that's all!
// // an example of that is the creation of class Base instance
// // above! as you can see, the controller/manager does
// // absolutely nothing in the form of heavy work!
// // the login credential: username and password
// // is available at the view via: HTTP REQUEST!
// // send it to the view: a login form!
// $this->base-render('login');
// }
// // this is the action "profile"
// public function Profile()
// {
// // remember that this is the controller/manager
// // and the manager doesn't do any heavy work!
// // so the manager usually asks the workers to
// // do the actual heavy work!
// // so you should never have to do any heavy programming
// // in any of your controller!
// // the controller should always asks the model to return
// // true or false whether the task is successfully
// // or not! that's all!
// // an example of that is the creation of class Base instance
// // above! as you can see, the controller/manager does
// // absolutely nothing in the form of heavy work!
// // send it to the view to display the profile!
// $this->base-render('profile');
// }
// this is the controlller
// if you want to differentiate your controller classes from
// other classes, you can append the word 'Controller' to the class
// name: 'UserController'
// see createController() example above for more detail!
// class SomeOtherController
// {
// public $base = array();
// $this->base = new Base();
// // this is the action "someaction"
// public function SomeAction()
// {
// // remember that this is the controller/manager
// // and the manager doesn't do any heavy work!
// // so the manager usually asks the workers to
// // do the actual heavy work!
// // so you should never have to do any heavy programming
// // in any of your controller!
// // the controller should always asks the model to return
// // true or false whether the task is successfully
// // or not! that's all!
// // an example of that is the creation of class Base instance
// // above! as you can see, the controller/manager does
// // absolutely nothing in the form of heavy work!
// // send it to the view to display the someview!
// $this->base-render('someview');
// }
?>
Notice that the manager does very little! All of the heavy work load is being done by the programmers.
Keep this analogy in mind as you work through the MVC pattern. There should not be any heavy work being done by the controller. The controller only need to know true or false. That's all! Nothing else!
For example, if you're programming a registration or login application, the model or model need to return only true or false if a user is successfully registered or logged in. Likewise, with other model, they need to return only true or false to the controller and nothing else.
For example, if a model is retrieving a bunch of products to be used in a catalog display in a view, the model can return true if the products are successfully retrieved from the database or false otherwise. For example:
<?php
/**
 * retrieve the products from the database
 */
class Product
    {
     // constructor
     public function __construct()
          {
           // constructor code logic);
          }

     // get the product
     public function getProduct()
          {
           // code logic
           // query the database: SELECT * FROM Product
           // return the product to the controller as an array!
           // $catalog = SELECT * FROM Product ....
           // if $catalog)
           //    {
           //     $this->base->set('catalog', $catalog);
           //     return $catalog;
           //    }
          }
    }

// then in your controller you can do this:
// $product = new Product();
// $catalog = $product->getProduct();
// if $catalog)
//    {
//     $this->base->render('catalog');
//    }
?>
In getProduct(), you need to retrieve the products from the database and return the products accordingly so that in the controller, you can just test to see if it returns any product or null. True or false!
In the controller, all it needs to be done is instantiating the model: $product = new Product().
$model = $product->getProduct().
Now the controller or manager can handover the product to the view.
You can send it to the view via a render() method: $this->base->render('catalog', ['model' => $model]).
Remember that the second argument of render() is an array; and therefore, you can send one model or multiple models to the view using the array to hold all the models. The trick is to test for each array element inside your view file 'catalog.php' and pick them out one by one using the array key/value pairs.
How you implement the second argument logic is up to you. One way to do it, is to set the properties inside your render(). See the following description on how to do it.
As stated above is to query the database for each model and store your models in the array using the key/value pairs to hold your models and then send the array to the view. In other words, gather all of your models [from the database or from other sources] and then put them in the array and then send that array as the second argument of the render() to the view.
For example:
$this->base->render('catalog', ['product' => $product, 'credential' => $credential, 'catalog' => $catalog, 'sale' => $sale, 'employee' => $employee'])
Make note that the second argument of render() is an array containing multiple models that are being sent to the view.
Now you need to implement the second argument logic inside your render() that sends the models or the array key/value pairs to the view. You can set the properties inside your render() as well. See the following render() example on how to do it.
<?php
/**
 * here is a very brief example of the second argument implementation of render()
 * for a more extended example of render() see an earlier example of render()
 *
 * note also that set(), like render(), is a method of the class Base
 */

// render() is a method of the class Base
public function render($view, $model == null)
     {
      // code logic
      if (!$model == null)
         {
          // if the caller of this render() sends in a model, we'll set the key/value pairs
          foreach ($model as $key => $value)
                  {
                   // $this->set() refers to class Base's set() method
                   // here, we're setting class Base properties using array key/value pairs

                   $this->set($key, $value);
                  }
         }

      // more render() code logic handling/implementing $view
      if (strpos($view, '/')
         {
          $view = explode('/', $view);

          // now $view is an array of two elements: a folder and a file

          // $view[0] = 'view', $view[1] = 'index'
          // $view[0] = 'affiliate', $view[1] = 'index'
          // $view[0] = 'about', $view[1] = 'index'
          // $view[0] = 'profile', $view[1] = 'index'

          // for a more extended render() code logic, see a render() code example shown earlier
         }
     } // end function render()
?>
The easiest way to send models to the view is to set the properties inside your render() as shown above. You can also set the properties in the model right after querying the database [as appose to setting it inside the render() as shown above]. Inside your model class code logic, you need to set the properties of the model like the following assuming '$base' is the instance of the base class Base:
$this->base->set('model', $model);
Now the above line sets the property called 'model' to your base controller class similar to class Base() in this example.
And likewise, for the rest of the models:
$this->base->set('product', $product);
$this->base->set('credential', $credential);
$this->base->set('catalog', $catalog);
$this->base->set('sale', $sale);
$this->base->set('employee', $employee);
Setting properties in the model can be more efficient and robust and you can set lots of properties for your model.
Now after using set() above, the controller or manager can just handover the product to the view: render('catalog') without having to worry about the model.
Now inside the catalog view file 'catalog.php', you can retrieve that property like this: $catalog = $this->base->get('model').
Display the catalog. For example, inside the view 'catalog.php':
foreach ($catalog as $key => $value)
$key should be a product id and $value should be an array holding the product object: id, name, price, description, image, etc.
How you implement your view's render() is up to you. You can make improvement to the barebone render() code example just shown above and also the one shown earlier (as well) to make it more robust, like handling multiple themes and files.
Inside the barebone render() (above and earlier) you can make it more robust and powerful by branching out to display snippets of view like sidebars flash display, ad flash display, and other content displays. See earlier code example for guidance.
Note that it is a good idea to specify the second argument of render() as an array: render($view, $template = array())
Please use the very popular shorthand array: render($view, $template = []).
This way, you can send all kinds of content to the view!
Note that you don't need more than two arguments in render() as the second argument handles all kinds of content to be sent to the view.
You can specify the second argument as an optional argument as well by doing this: render($view, $template[] = null).
By doing that you can send only the "static" view page that are simple view like about, contact, profile, etc, without using the second argument. For example:
$this->base->render('about'); // this will render the "static" view/about.php page
$this->base->render('contact'); // this will render the "static" view/contact.php page
$this->base->render('profile'); // this will render the "static" view/profile.php page
The Model: Classes
As stated above, there should not be any heavy work being done by the controller. All of the heavy work load should be done by the model.
The model should be autoloaded using SPL autoload and are grouped in their own folders. Likewise, for the view and controller, they should be grouped in their own folders and autoloading them accordingly (specifically the controller -- view are loaded and included in the render() already). See my other tutorials called "how to autoload classes using SPL."
To learn more about MVC pattern, please check out the Internet by Googling the term MVC or Model View Controller.
For a starter, here is a list of very good introductory tutorials on the Web that I found to be very good tutorials:
The MVC Pattern: PHP, MVC and Best Practices The MVC Pattern and PHP, Part 1 The MVC Pattern and PHP, Part 2 The MVC Pattern: An Introduction to the Front Controller Pattern, Part 1 The MVC Pattern: An Introduction to the Front Controller Pattern, Part 2For a more advanced pattern methodology, please check out MVVM (Model-View-ViewModel)
Advanced Pattern: The advantages of MVVM over MVCThere you have it: a very brief but useful introduction to MVC pattern.
You should be able to use this MVC pattern tutorial and build your very own sophisticated applications--large or small. From here, the possibilities are endless!
Have fun programming and don't forget to thank me later!
Bonus Materials on MVC
The following are just bonus MVC materials to help you understand the MVC concept further.
The following materials are taken from the tutorials mentioned in the links earlier.
It is possible to write a web application in PHP whose architecture is based on the MVC pattern. Let's start with a generic bare bones concept example.
Remember that there are three parts: M-V-C?
We'll start with 'M', which is the model.
The model is the data. If you recall from my tutorial earlier, the model is the programmers and the programmers do all the heavy work in manipulating the data. So data equals programmers. Keep that in mind!
What are we really trying to do here?
If you look in the code example below, it says $this->string = "MVC + PHP = Awesome!".
$this->string is a variable to hold data, hence model is all about data.
And the actual data is: "MVC + PHP = Awesome!".
Do you get the hang of it?
This example shows a very simple case of handling data. In most cases, you'll have to query the database to get the model. Yes, that is not a misstatement. In an MVC talk, it's a 'model' but in a human talk, it's a 'data'. Get used to talking about model being the data from now on!
<?php
class Model
    {
     public $string;

     public function __construct()
          {
           // get the model. most cases, you'll do some database queries
           // $this->string = 'SELECT * FROM someTable'

           // remember that all the heavy work are being done right here in the model?

           $this->string = "MVC + PHP = Awesome!";
          }
    }
 ?>
This is the view or 'V'.
The view is the display - showing the model to the user. Take a look at the function output(). It's main purpose is to output the data to the user. I really mean it outputs the model to the user.
Before it can output the model to the user, it has to get it first by way of the constructor. In other words, the model is passed to the view via the constructor.
Since the view needs the instruction from the controller as well, it also needs to pass the controller to the view as well.
Remember the controller? Or a manager? Maybe a manager who coordinates the tasks, perhaps?
<?php
class View
    {
     private $model; // this variable $model is for holding an instance of the class Model

     // as you may well know that once you have an instance of a class (Model),
     // you can get access to its attributes!

     // in this case, we can get the class Model's data: MVC + PHP = Awesome!

     private $controller; // this variable $controller is for holding an instance of the class Controller

     // again, once you have an instance of a class (Controller),
     // you can get access to its attributes!

     // here in the constructor is where you can pass instances of the classes
     // to allow you to get access to their attributes!

     // so this constructor (or this View class) is being called like the following:

     // the following code should be in the "external" controller
     // notice that the controller does very little work!
     // all of the works are being done by the model!

     // $model = new Model();
     // $controller = new Controller($model); // a manager/controller asking the model for the data
     // $view = new View($controller, $model);
     // echo $view->output();

     public function __construct($controller, $model)
          {
           $this->controller = $controller;
           $this->model = $model;
          }

     // now inside this class View is where we have instances of the classes,
     // and we can get access to their attributes and display to users/viewers!

     // as you can see from inside the method output(), once we have instances
     // of the classes, we can get their attributes, i.e., $this->model->string

     public function output()
          {
           // right here where it is very tricky!
           // it tries to get the string: MVC + PHP = Awesome!" from the model in
           class Model shown earlier!

           $this->model refers to the private variable $model above!
           ->string refers to a public variable in class Model shown earlier!

           basically, it returns the string:  "MVC + PHP = Awesome!"

           return "<p>" . $this->model->string . "</p>";
          }
    }
 ?>
Here is the controller or 'C'.
Remember the controller? Or a manager? Maybe a manager who coordinates the tasks, perhaps?
Remember that a manager/controller does very little work. The heavy work are being done in the model.
So what sort of tasks are to be performed by the controller?
If you look at the code below, all it does is taking a model and does nothing!
This is a manager asking a programmer to hand over the task so that a manager can give it to a customer/view.
If you recall my tutorial earlier, I stated that there are two controller: inner controller and external controller - sort of top manager and middle manager interacting with one another to complete the tasks.
This controller, you can say that it is the top manager. Later on, you'll see another controller or middle manager who responses to this top manager and then that middle manager coordinates the final tasks to tell the view to display the model to the user.
<?php
class Controller
    {
     private $model; // this variable $model is for holding an instance of the class Model

     // this is a manager asking a programmer to hand over the task so that
     // a manager can give it to a customer/view

     // in most cases, you'll do just a little bit more to ask for the data from
     // the model and then handing it over to the view to be displayed

     // the main thing to remember is that you have to create some variables
     // like $model declared above to hold some model!

     // most cases, you'll declare lots of variables to hold model as most
     // cases you have lots and lots of model to handle in this class Controller!

     // and in most cases, you'll need to have some controller methods, i.e., signup,
     // login, logout, about, etc., to return the external controller instances.

     // see controller method click() later on for an example!

     public function __construct($model)
          {
           $this->model = $model;
          }
    }
 ?>
We have our project started with some very basic classes for each part of the pattern. Now we need to set up the relationships between them.
This is the middle manager who coordinates the final tasks.
As you can see, neither the top manager nor the middle manager does any work at all. All they do is just coordinate the final task.
<?php
$model = new Model();
$controller = new Controller($model);
$view = new View($controller, $model);
echo $view->output();
 ?>
Here is their explanation of the code above:
As you can see in the example above, we don't have any Controller-specific functionality because we don't have any user interactions defined with our application. The View holds all of the functionality as the example is purely for display purposes.
Let's now expand the example to show how we would add functionality to the controller, thereby adding interactivity to the application:
<?php
class Model
    {
     public $string;

     public function __construct()
          {
           // get the model. most cases, you'll do some database queries
           // $this->string = 'SELECT * FROM someTable'

           $this->string = "MVC + PHP = Awesome, click here!!";
          }
    }
 ?>
<?php
class View
{
private $model;
private $controller;
public function __construct($controller, $model)
{
$this->controller = $controller;
$this->model = $model;
}
public function output()
{
// right here, it returns an anchor link to the caller!
// remember what $this->model->string returns?
// a hint: "MVC + PHP = Awesome, click here!!"
// basically, when you click on the anchor link it will call a
// function named click()
// action=click refers to a controller function named 'click'
// see class Controller with function named 'click' below!
// you can format your anchor link like this as well and you can
// include as many GET parameters as you want using '&'. for example:
// '<a href="http://www.example.com/index.php?action=click¶m1=value1">' .
// $this->model->string . "</a>"
return '<p><a href="mvc.php?action=click">' . $this->model->string . "</a></p>";
}
}
?>
<?php
class Controller
    {
     private $model;

     public function __construct($model)
          {
           $this->model = $model;
          }

     public function click()
          {
           // this one statement below breaks the MVC rule by having a controller
           // performing a model's task! this is not a good idea!

           // we should not be doing data calculation and manipulation in here!
           // we can ask a model to return a data and assign that data to: $this->model->string

           // a lot of programmers are tempted to do exactly like this one by querying
           // data from the databse and assign that data to: $this->model->string

           // avoid doing a short cut like here and always adhere to the MVC rule
           // you can declare some variables to hold the model and send those model
           // to their proper view

           $this->model->string = "Updated Data, thanks to MVC and PHP!";
          }
    }
 ?>
We've enhanced the application with some basic functionality. Setting up the relationship between our components now looks like this:
The following code is the main base application and it is analogous to a
class called Base() in my MVC example shown earlier.

It is the main application base class similar to the example class Base()
shown in my other tutorial called 'How to autoload classes using SPL'.

See class Dispatcher, particularly the method render() about explanation
on Base() class.

In other words, put the following code in your main application base class similar
to class Base() shown in my other tutorial called 'How to autoload classes using SPL'.

<?php
$model = new Model();

// this is similar to a code that creates a controller class: see createController()

$controller = new Controller($model);

$view = new View($controller, $model);

if (isset($_GET['action']) && !empty($_GET['action']))
   {
    // once you instantiated a controller class, you can use that
    // controller instance ($controller->) to call its action method via: $_GET['action']

    // so if you have a controller class called CartController, and its
    // action method called addToCart(), then the code below would be:

    // CartController->addToCart()

    // provided that you change the action method $_GET['action']

    // to $_GET['addtocart']

    // this is similar to a code that creates a controller class: see createController()
    // and it looks something like this:

    // creating an external controller: 'user'
    // $this->base->createController('user')->$x2();

    // you can pass the controller as a variable as well:
    // $this->base->createController($x1)->$x2();

    // notice that: $this->base->createController($x1) being the $controller->

    // and $x2() being the $_GET['action']()

    // notice that the {} wrapping around $_GET is analogous to 'echo'

    $controller->{$_GET['action']}();
   }

// this will echo out an anchor link:
// <a href="mvc.php?action=click">MVC + PHP = Awesome, click here!!</a>

// now all you have to do is click on the anchor link to see the effect!

echo $view->output();
 ?>
Run the code and when you click on the link you'll be able to see the string change its data.
Conclusion
We've covered the basic theory behind the MVC pattern and have produced a very basic MVC application, but we still have a long way to go before we get into any nitty-gritty functionality.
This concludes MVC extra bonus materials!
PHP Visibility or access control: public, protected, and private
What is the difference between public, protected, and private ?
public, protected, and private are visibility clauses (similar to static and final). A visibility clause is a term used to describe the access control in certain part of the code. It's like a key to a toolbox where you are allowed to use certain tools for certain projects only if you have the key to open it. It is restricted to use certain tools. So you can't just go grab the tools and use freely; you have to have certain keys to open the toolbox and use the tools.
In programming, we have visisibility clauses or visibility controls to allow you to restrict certain part of the code to be accessible to certain programs.
Visisibility clauses or visibility controls allow certain part of code to be protected from outside abuses. Visisibility clause or access control is about controlling visibility of the methods and variables from outside classes usage. The visibility of the code elements are determined by their access control specifications or clauses: public, protected, and private.
Note: the term visisibility clause or access control mean the same thing and both are being used interchangibly.
protect" a method or variable from unauthorize references, you use the three levels of access control visibility: public, protected, and private.
A class is like an island onto itself where only people on the island can get access to the resources residing on that island. Because of this inaccessibility that a method of distinguishing who is allowed to get on and who is not allowed to get on -- and what level of restrictions certain methods and variables are placed on -- was developed.
The three-level of restrictions was developed to allow access control of the methods and variables.
Note: Visibility access control only concern with methods and variables and nothing else. Variables sometimes referred to as property variables or just plainly properties. So keep this in mind as you go through the descriptons:
- Class
methodsandvariablesdeclared as public can be accessed everywhere. - Class
methodsandvariablesdeclared as protected can be accessed only within the class itself and by classes derived from that class. - Class
methodsandvariablesdeclared as private may only be accessed by the class that defines themethodsandvariables. In other words,ONLYthe class that defines the privatemethodsandvariablescan access these privatemethodsandvariables[that they defined themselves].All other classes cannot access these private
methodsandvariables[of another class or classes]. They canONLYaccess their own privatemethodsandvariables. - Class
methodsandvariablesdeclared without any explicit visibility keyword are defined as public.
Before we get into the main visibility access control: public, protected, and private, let's get this one nagging issue out of the way that seems to get a lot of people confused, and that is, the use of keyword var. For example:
<?php
class MyClass
    {
     /** declaring MyClass' properties: **/

     /**
      * as you can see below, we declare a property called $make as 'public'
      * using the keyword 'var'.
      * this is the same as declaring: public $make
      */

     var $make; // declaring a property as 'public'

     // for non-public properties, you use the appropriate clause, i.e., protected.
     protected $model;

     // for non-public properties, you use the appropriate clause, i.e., private.
     private $color;
    }
?>
The keyword var was the original design to signify the property as a public variable. So instead of having to specifically declaring a property using the keyword public, all we had to do was using the keyword var followed by the variable name and we had a public property variable. That was in the old days!
Then the folks at PHP decided to get rid of the old legacy mistake and instituted the proper way of doing things by replacing the keyword var with the keyword public starting in PHP 5.0. Then an uproar erupted and created a lot of confusion. It lasted for a couple of versions until it was too much of a headache to bear and they decided to put back the old legacy style by re-instituting the keyword var to its original style starting in PHP 5.3.
Since version 5.3 and onward, you can actually use either of the two keywords and they will all work just fine. However, they really stress/encourage all programmers to use keyword public and discourage the use of keyword var.
Visibility Access Control: Public, Protected, and Private
Let's see how to use the visibility access control: public, protected, and private. For example:
<?php
/**
 * declaring class Vehicle's properties only -- no methods
 */
class Vehicle
    {
     // declaring class Vehicle's properties:
     public $make; // declaring a property as 'public'
     protected $model; // declaring a property as 'protected'
     private $color; // declaring a property as 'private'
    }
?>
Now to see the effect of the visibility clauses in action, consider this:
<?php
/**
 * now we're creating another class outside of class Vehicle.
 * this class will try to get through class Vehicle's visibility control.
 * let's see if this class can get through class Vehicle's visibility control.
 */
class Ford
    {
     // creating an instance of class Vehicle:
     $obj = new Vehicle();

     // now try to get through class Vehicle's visibility control.

     /**
      * this reference is fine because the property is declared as
      * 'public'. so class Vehicle allows class Ford to use its property.
      */
     $obj->make = 'Ford';

     /**
      * this reference will cause a 'fatal error' because the property is declared as
      * 'protected'. so class Vehicle didn't allow class Ford to use its property.
      */
     $obj->model = 'F150';

     /**
      * this reference will cause a 'fatal error' because the property is declared as
      * 'private'. so class Vehicle didn't allow class Ford to use its property.
      */
     $obj->color = 'grey';
    }
?>
As you can see, declaring methods and properties as protected and private restricts outside classes like Ford from using its properties.
methods and property variables. For example:
<?php
/**
 * now we're adding methods to class Vehicle.
 */
class Vehicle
    {
     // declaring class Vehicle's properties:
     public $make; // declaring a property as 'public'
     protected $model; // declaring a property as 'protected'
     private $color; // declaring a property as 'private'

     /**
      * declaring class Vehicle's method as 'public'
      * notice that declaring a method without the visibility clause has
      * the same effect as 'public'. so the 'public' clause can be omitted!
      */
     public function setMake($make)
          {
           // assigning a value to class Vehicle's property
           $this->make = $make;
          }

     // declaring class Vehicle's method as 'protected'
     protected function setModel($model)
             {
              // assigning a value to class Vehicle's property
              $this->model = $model;
             }

     // again, declaring class Vehicle's method as 'private'
     private function setColor($color)
           {
            // assigning a value to class Vehicle's property
            $this->color = $color;
           }
    }
?>
Now to see the effect of the visibility clauses in action, consider this:
<?php
/**
 * now we're creating another class outside of class Vehicle.
 * this class will try to get through class Vehicle's visibility control.
 * let's see if this class can get through class Vehicle's visibility control.
 */
class Audi
    {
     // creating an instance of class Vehicle:
     $obj = new Vehicle();

     // now try to get through class Vehicle's visibility control.

     /**
      * this reference is fine because method setMake() was declared as
      * 'public'. so class Vehicle allows class Audi to use its method.
      */
     $obj->setMake('Audi');

     /**
      * this reference will cause a 'fatal error' because setModel() was declared as
      * 'protected'. so class Vehicle didn't allow class Audi to use its method.
      */
     $obj->setModel('A6');

     /**
      * this reference will cause a 'fatal error' because setColor() was declared as
      * 'private'. likewise, class Vehicle didn't allow class Audi to use its method.
      */
     $obj->setColor('grey');
    }
?>
As you can see, declaring methods and properties as protected and private can be accessed only from within the class that those methods and properties are defined.
Inheritance and Protected Visibility Access
In the previous description, in the beginning introductory description, it stated that 'protected properties or methods can be accessed within the class and by classes derived from that class'. What does that mean?
Let's take a look at the same class definition Vehicle but this time we will extend this Vehicle class further and see if child classes can get access to class Vehicle's visibility control:
<?php
class Vehicle
    {
     /**
      * declaring class Vehicle's properties as private:
      * notice that these two 'private' properties can be accessed only from inside
      * this Vehicle class. classes that extends from Vehicle cannot access these
      * two private properties.
      */

     private $price;
     private $tax;

     /**
      * declaring class Vehicle's constructor as 'public'
      * notice that declaring a method/constructor without the visibility clause
      * has the same effect as 'public'. so the 'public' clause can be omitted!
      */

     public function __construct($price, $taxRate)
          {
           /**
            * assigning values to class Vehicle's properties
            * 'private' properties can be accessed only from inside this Vehicle class
            */
           $this->price = $price;
           $this->tax = $taxRate;
          }

     /**
      * if calculateTax() was declared as 'private' no child class can access this
      * private method. the only method that can access this private method is from inside
      * the constructor using $this, for example: $this->calculateTax()
      *
      * let's be clear about this: ONLY if calculateTax() is declared as 'private'
      *
      * let's clarify that statement earlier a little bit:
      * 'the only method that can access this private method is from inside the constructor'
      *
      * that statement is only true if this Vehicle class has only the constructor method as
      * it stands right now.
      * if there are more methods to be had, regardless of their visibility clause,
      * then they all can access to these private properties as well as other private methods
      * of class Vehicle. so 'private' means ONLY within the class itself and not outside of
      * the class. this means that any method within the class can access 'private' properties
      * and methods declared within the class.
      * so make note of that!
      *
      * this means that no other class or classes even child class or classes of Vehicle can
      * get access to class Vehicle's private properties and methods.
      *
      * however, calculateTax() is declared as "protected" and therefore child classes of
      * Vehicle can get access to calculateTax() just fine!
      *
      * did you remember a phrase that goes like this [?]:
      * 'protected can be accessed only within the class itself and by classes derived from
      * that class'.
      *
      * this is exactly what that phrase means!
      *
      * here is the 'protected' method calculateTax()
      */

     protected function calculateTax()
             {
              /**
               * now since this method is declared as 'protected' child classes that extend
               * from this parent class Vehicle can get access to this 'protected' method.
               * no other classes can get access to this 'protected' method.
               */

              // getting a tax
              $tax = $this->$price x $this->$taxRate;
              return $tax;
             }
    }
?>
Now to see the effect of the protected or private visibility clause in action, consider this:
<?php
class Ford extends Vehicle
    {
     public function getTax()
          {
           // getting a tax from parent class Vehicle

           // calling a protected method, is it legal?
           // see below and an explanation later as well!
           $tax = $this->calculateTax();
           return $tax;

           /**
            * the 'protected' rule: child classes that extend from a parent class with
            * methods declared as 'protected' can get access to those 'protected methods.
            * no other classes can get access to those 'protected' methods.
            */
          }
    }
?>
Now to see the effect of the visibility clauses in action in child class Ford, consider this:
<?php
/**
 * now we're creating another class Audi outside of class Vehicle and Ford.
 * this class Audi will try to get through Vehicle's and Ford's visibility controls.
 * let's see if Audi can get through class Vehicle's and Ford's visibility controls.
 */
class Audi
    {
     // creating an instance of class Ford which extends Vehicle:
     $obj = new Ford('25000', '0.07');

     /** now try to get through class Ford's and Vehicle's visibility controls. **/

     /**
      * calling $obj->getTax() is OK because Ford's method getTax() was declared as
      * 'public'. so class Ford allows class Audi to use its method getTax().
      * now, in turn, getTax() calls calculateTax() (which is declared as 'protected') from
      * within the derived class Ford.
      *
      * a public method getTax() calls a protected method calculateTax()!
      *
      * is it legal for a public method to call a protected method?
      *
      * did you remember a phrase that goes like this [?]:
      * 'protected can be accessed only within the class itself and by classes derived from
      * that class'.
      *
      * '.... by classes derived from that class' means Ford derived from Vehicle.
      *
      * getTax() calls calculateTax() from inside class Ford.
      * class Ford is a derived class from Vehicle.
      *
      * as you can see, it is OK for a public method to call a protected method from
      * inside the derived class, in this case, Ford.
      */

     $obj->getTax();   // calling $obj->getTax() is OK because getTax() is 'public'
    }
?>
Summary
Let's re-cap what the three visibility control are:
public just the word implies, it is open to the public and anybody can get access to these public
methodsandproperties.protected just like the word implies, it is protected within the family and relative circle, and others outside of the family and relative circle cannot get accessed to the protected
methodsandproperties. This means that child class (or classes)methodsandpropertiesdeclaring as public can get access to parent classmethodsandpropertiesdeclared as protected.private just like the word implies, it is a private matter/affair and it is not open to the public or to their own descendant classes either. This is very strict even their own relatives and descendants can't even get accessed to
methodsandpropertiesof a private class.methodsandpropertiesinside a private class can only be accessed from inside that private class by their own membermethodsandproperties. Child class or classes of the private class cannot get accessed to their own parent'smethodsandproperties. That is very harsh!
So the key to remembering these three visibility controls is that, just think of them in term of real life examples like family and relatives and strangers and associate each scenario accordingly.
Another point is, to memorize protected first and leave the other two alone.
In other words, don't try to memorize the other two and only try to memorize protected very good. That way, you don't get them mixed up so easily.
Just think that protected is a protection within the family and relative, and descendants cycle and anybody outside of the cycle cannot get accessed to protected methods and properties.
What are the magic methods __set(), __get(), __isset(), and __unset() ?
Magic methods are special methods which override PHP's default's action when certain actions are performed on an object.
All methods names starting with __ are reserved by PHP. Therefore, it is not recommended to use such method names unless overriding PHP's behavior.
In other words, DO NOT use __ (that is double underscores) for your own variables, methods, or class names
For example, these are illegal: $__myVar, __MyMethod(), class __Connection.
I repeat: __ is reserved by PHP.
The following method names are considered magical: __get(), __set(), __isset(), __unset(), __construct(), __destruct(), __call(), __callStatic(), __sleep(), __wakeup(), __serialize(), __unserialize(), __toString(), __invoke(), __set_state(), __clone(), and __debugInfo().
Notice that they all use the __ (double underscores).
All magic methods, with the exception of __construct(), __destruct(), and __clone(), must be declared as public, otherwise an E_WARNING is emitted.
Magic methods in PHP provide mean to dynamically create properties and methods. These dynamic properties and methods are processed via magic methods one can establish in a class for various action types.
All magic methods are invoked automatically by PHP when interacting with properties or methods that have not been declared or are not visible in the current scope.
Let's clarify that last two paragraphs (or statements) above and explain it further.
Magic methods are being used frequently to overcome restrictions imposed by programming rules (or programming paradym) -- rules such as you can't access protected or private members variables and methods from outside the current scope or class. This is called access controll and is universally understood by programmers.
If you don't understand access control you can read my other tutorial on this website and the tutorial is called public verses protected verses private.
There are two use cases for magic methods:
1. Magic methods are frequently used to overcome the access control restriction to allow programmers to access protected and private variables and methods without running into the programming paradym restriction.
2. Another use for the magic methods is to create property variables 'on the fly' when you need new properties to be created on the fly or just-in-time.
Let's explain the second case first and then come back to explain the first case later.
When you create a class you have to declare properties and methods in your class, but that is not always feasible and it cluttered the space in your class. To solve this clutter issue and many other cases involving properties you are allowed to create properties 'on the fly'.
Let's say you created a class that contains properties and methods but later you need other properties for that class, you have two choices:
One, go back to your class and add your new properties to your class and you're good to go.
As you can see, it takes a lot of effort to do that because you have to track down your class (among many classes) and open that class and modify your code in that class.
That seems a lot of work just to add properties to your class.
Two, you can use magic methods to do your dirty work for you.
Magic methods make it easier to add properties to your (old) class by just using the magic methods to do the dirty work for you.
All you have to do is creating a magic method and when you have your (new) properties you can just refer to (or interacting with) those properties and PHP will call that magic for you automatically just like when you create an object of a class and PHP automatically calls the constructor for you.
Yes, that is right: __constructor() is a magic method and is invoked automatically by PHP.
Now that the second case was briefly explained, let's explain the first case in detail next.
That is not really true at all. It will illustrate for both the first and second case together in extended detail.
In actuality, the following actually illustrates both use cases in great detail: inaccessible protected or private and non-existing properties.
As you read the detail description below you'll see that there are four magic methods being illustrated: : __set(), __get(), __isset(), __unset().
These four magic methods are called or invoked automatically by PHP. However, PHP only calls or invokes these magic methods in the same manner when PHP calls or invokes the famous magic method __construct().
In other words, PHP only invokes these magic methods but does nothing else. You have to provide code inside these magic method for PHP to execute.
Just like you have to write code inside your __construct() magic method, you also have to write code inside your four magic methods as well.
Whatever you write inside these magic methods PHP will execute them for you in the same manner when you write code inside your constructor.
The kind of code you write in your constructor depends on the logic of your application; and likewise, the kind of code you write in your four magic methods depends on the logic of your application as well.
Let's take one magic method to illustrate the point stated above: __set().
__set() is run or invoked automatically when you attempt to write or assign data to inaccessible (protected or private) or non-existing properties. In other words, when you attempt to write to a non-existing or inaccessible property, PHP calls __set() method automatically.
You already know that in actuality you can't write data to protected or private or non-existing properties. You just can't!
Magic method __set() allows you to write data to protected or private or non-existing properties and therefore circumvent the restriction imposed by programming language paradym.
The access controll is the programming language paradym and is universally understood by programmers.
You can't write data to protected or private or non-existing properties. You just can't!
And you can't create properties 'on the fly' if you need new propterties. You just can't!
You have to use magic methods to do your dirty work.
The most popular magic methods frequently used by programmers are: __set(), __get(), __isset(), __unset() and have the following signature heading.
Let's see some examples on how to use magic methods to do your dirty work.
<?php
/**
 * __set() is run when writing data to inaccessible (protected or private) or non-existing properties.
 *
 * In other words, when you attempt to write to a non-existing or inaccessible property, PHP calls __set() method automatically.
 *
 * As stated earlier, you have to write the code logic inside this __set() method for PHP to execute it for you.
 * What kind of code is needed inside this __set() method ?
 *
 * Well, as the name implies, __set() is supposed to set or assign a value to a property (protected or private properties in this case).
 *
 * As you can see, you can now assign a value to a protected or private property from outside the scope using __set().
 *
 * For example, in a later example, you'll see the code that attempts to assign (or write) a value
 * to a non-existence property like this:
 *
 * $obj->propA = 100;
 *
 * Remember that without magic method __set() you can't assign a value to a protected or private property outside of the scope.
 *
 * Creating an instance of MyClass and call it as $obj and using $obj outside of the scope is illegal without using __set().
 *
 * $obj is an instance of class MyClass, propA was a non-existence property,
 * while 100 is an arbitrary value to write to the previously non-declared, non-existence property propA.
 *
 * The syntax signature looks like the following:
 *
 *      public __set(string $name, mixed $value): void
 *
 * The $name argument is the name of the property being interacted with (i.e., propA).
 * The __set() method's $value argument specifies the value the $name'ed property
 * should be set to (i.e., 100).
 *
 * So it seems that __set() will contain the code similar to the following:
 *
 *      public __set($name, $value)
 *           {
 *            // $obj->propA = 100
 *            $this->$name = $value;  // make note: it is $this->$name and not $this->name
 *           }
 *
 * Make note: propA did not previously exist when class MyClass was created; however, after the
 * referenced above that triggered a call to __set($name, $value), then propA magically exists;
 * and therefore later, we can access it or read it using the code like the following:
 *
 * $var = $obj->propA; // see __get() example later
 *
 * As stated earlier, you have to write the code logic inside your magic method __get() for PHP to execute it for you.
 *
 * You'll see that class MyClass did not declare a property called propA at all, so propA was a
 * non-existence property to begin with.
 *
 * Only after when you attempted to write to propA by specifying propA as a property
 * of class MyClass that propA existed. Very magic, indeed!!!
 *
 * But in actuality, propA didn't exist at all before the reference.
 * See the next code illustration signature below (in the __set() example).
 */

public __set(string $name, mixed $value): void
?>
<?php
/**
 * __get() is utilized for reading data from inaccessible (protected or private) or non-existing properties
 *
 * In other words, when you attempt to access a property that doesn't exist or a property that is
 * in-accessible, e.g., private or protected property,
 * PHP automatically calls the __get() method automatically.
 *
 * For example, in some later examples, you'll see the code that attempts to access (or read) a value
 * stored in propA property like this:
 *
 * Make note: propA is now exists only after the referenced that triggered a call to __set(), and then
 * propA magically exists; and therefore, we can access it or read it using the code like the following:
 *
 * $var = $obj->propA;
 *
 * $obj is an instance of class MyClass, propA is now an existence property that contains some value,
 * while $var is just an arbitrary variable to hold the value of the now existence property propA.
 *
 * You'll see that class MyClass did not declare a property called propA, so propA was a
 * non-existence property to begin with.
 *
 * Now it exists only after when you attempt to write to propA by specifying propA as a property of class MyClass.
 * But in actuality, propA didn't exist at all before the reference.
 * See the next code illustration signature below (in the __get() example).
 */

public __get(string $name): mixed
?>
<?php
/**
 * __isset() is triggered by calling isset() or empty() on inaccessible (protected or private) or
 *           non-existing properties.
 *
 * In other words, __isset() is another magic method that (we) programmers use when we want to check
 * the access of any non-existent or inaccessible properties of a class object.
 * To call the __isset() magic method, we have to call the __isset() with the inaccessible or
 * non-defined properties as its parameter.
 *
 * It is automatically invoked to check whether a needed object property is set or not.
 *
 * For example, consider the following code illustration for a better visualization.
 *
 * <?php
 *   class Example
 *       {
 *        private $data = array();
 *
 *        public function __isset($n)
 *             {
 *              echo "__isset() magic method invoked.";
 *              return isset($this->data[$n]);
 *             }
 *       }
 *
 *   // now create an instance of the class
 *   $obj2 = new Example();
 *
 *   // now let's trigger a call to the magic __isset($n) above
 *   echo isset($obj2->empid); // notice that empid is a non-existence property
 *
 * As you can see, the program wants to access the inaccessible object property which
 * is not defined as a part of the Example class.
 *
 * The isset() method takes the 'empid' inaccessible variable as a parameter for
 * checking the existence of the object property.
 *
 * See the follwoing code illustration signature.
 * ?>
 */

public __isset(string $name): bool
?>
<?php
/**
 * __unset() is invoked when unset() is used on inaccessible (protected or private) or non-existing properties.
 *
 * In other words, __unset() is another magic method that is invoked automatically for destroying a variable
 * and freeing up memory space.
 *
 * When __isset() is used for checking whether a variable exists or not,
 * the __unset() simply destroys a variable when used on non-existing or inaccessible properties.
 *
 * Consider the following code illustration:
 *
 * <?php
 *   class Example
 *       {
 *        private $dat = array();
 *
 *        public function __isset($n)
 *             {
 *              return isset($this->dat[$n]);
 *             }
 *
 *        public function __unset($n)
 *             {
 *              echo "__unset() magic method invoked.";
 *              unset($this->dat[$n]);
 *             }
 *       }
 *
 *   // now let's create an instance of the class
 *   $obj2 = new Example();
 *
 *   // this will trigger a call to __set()
 *   $obj2->a = 62;
 *
 *   // this will trigger a call to __isset()
 *   if (isset($obj2->a))
 *      {
 *       // and this one will trigger a call to __unset()
 *       unset($obj2->a);
 *
 *       // now property a is no longer exists because it was unsetted or destroyed!
 *       echo "Destroyed obj2 -> a ";
 *      }
 *
 * See the follwoing code illustration signature.
 * ?>
 */

public __unset(string $name): void
?>
Let's see some more examples usage of these four magic methods. For example:
<?php
/**
 * magic methods example
 *
 * The purpose or goal of creating this class and overriding these four magic methods is
 * to have PHP calls these four methods behind the scene whenever we refer to MyClass'
 * methods and properties.
 *
 * The keyword here is: "refer"
 *
 * For example, to set the property of MyClass, let's first create its instance:
 *
 * $obj = new MyClass();
 *
 * // now we can "refer" or set the property using the instance object $obj
 * $obj->propA = 100; // property propA = 100
 *
 * The above reference to the property "propA" will trigger a call to the magic method __set()
 * In other words, the code above will trigger a call to the magic method __set($name, $value) with
 * $name being the property name propA and $value being the assigned value of 100.
 *
 * // now to "refer" or get the property
 * $var = $obj->propA; // $var = 100
 *
 * The above reference to the property "propA" will trigger a call to the magic method __get()
 * In other words, the code above will trigger a call to the magic method __get($name) with
 * $name being the property name propA and holds a value of 100.
 *
 * If you reference a property in a boolean reference, it will trigger a call to __isset()
 *
 * In other words, if you reference a property in a test reference to see if the property exists or
 * not null, it will trigger a call to __isset()
 *
 * In another word, this PHP magic method __isset() will be implicitly called when executing
 * isset($object->property)
 *
 * For example: if ($obj->propA) or isset($obj->propA) // it will call __isset()
 *
 * For __unset(), this PHP magic method __unset() will be implicitly called when executing
 * unset($object->property)
 *
 * For example: unset($obj->propA) // it will call __unset()
 */

class MyClass
    {
     // declaring properties

     private $data = array();

     private $username;
     private $password;
     private $db_name;
     private $host;
     private $isConnect;

     // not used this property
     public $declared = 1;

     // only used this property when accessed outside the class
     private $hidden = 2;

     // This is a special magic method that we're using it on a regular basis
     // This is in addition to the four magic methods illustrated in the example

     public function __construct($user, $pass, $dbName, $url)
          {
           // initialize the variables username, password, host, db_name, with the
           // argument values sent in via the contructor heading: user, pass, dbName, url

           // notice that variable $this refers to the current object: $obj = new MyClass()

           $this->username  = $user;
           $this->password  = $pass;
           $this->db_name   = $dbName;
           $this->host      = $url;

           $this->isConnect = $this->Connect();
          }

     // This is not a magic method, it is just for illustration example only
     // In addition to the four magic methods and a special magic method (__construct()),
     // you can add your own methods to do other tasks a well,
     // and this Connect() is an example of that!

     public function Connect()
          {
           // notice that this function gets called automatically whenever class MyClass
           // gets referenced because this function gets included in the constructor above!

           // this function returns the PDO connection object

           return new PDO("mysql:host=$this->host;dbname=$this->db_name", $this->$username, $this->$password);
          }

     /**
      * // the reference/creation of the MyClass instance below will trigger a call to the constructor
      * // this is a PHP's magic method doing its magic behind the scene
      *
      * $obj = new MyClass('my_username_123', 'my_password_123', 'my_database_name_123', 'my_db_server_123');
      *
      * // similarly, now when you "refer" or set the property like the following,
      * // PHP is doing its magic behind the scene:
      *
      * $obj->propA = 100; // property propA = 100
      *
      * The above reference to the property "propA" will trigger a call to the following
      * magic method __set($name, $value) with $name being the property name propA and
      * $value being the assigned value of 100.
      *
      * in other words, PHP is doing its magic behind the scene, similarly when PHP is doing its
      * magic behind the scene on the constructor __construct(), by calling and executing a magic
      *  method __set() and assigning a value of 100 to the property name propA.
      *
      * notice that the magic method __set() is similar to the magic method __construct(), in which,
      * they both are empty methods, leaving the methods for you to fill in the blank.
      *
      * this applies to other magic methods as well, such as: __get(), __isset(), __unset(), etc.
      *
      * this means that you are freely to put any kind of code inside the magic methods as you see
      * fit based on your logic of your applications. however, a typical set() method would contains
      * two arguments: set($name, $value) -- hence, the below example being __set($name, $value) with
      * $name being the property name propA and $value being the assigned value of 100.
      *
      * and a typical get() method would contains one argument: get($name) -- hence, the below example
      * being __get($name) with $name being the property name propA and holds a value of 100.
      *
      * notice that property propA have not been declared, but is it being declared and
      * used on the spot.
      * this is very legal in PHP.
      */

     // notice that PHP only calls this magic method and will execute whatever code you place inside it
     // this is similar to the constructor __construct() where PHP only calls this magic method
     // and will execute whatever code you place inside it
     // so it's up to you to put the logic of your application inside this magic method

     public function __set($name, $value)
          {
           echo "Setting '$name' to '$value'\n";
           $this->data[$name] = $value;
          }

     /**
      * $obj = new MyClass('my_username_123', 'my_password_123', 'my_database_name_123', 'my_db_server_123');
      *
      * // now "refer" or get the property
      * $var = $obj->propA; // $var = 100
      *
      * in other words, the above code will cause PHP to do its magic behind the scene
      *
      * The above reference to the property "propA" will trigger a call to the
      * following magic method __get($name) with $name being the property name propA
      * in other words, to retrieve the property value contains in property name propA, use
      * the code reference above.
      *
      * notice that property propA have not been declared, but is it being declared and
      * used on the spot.
      * this is very legal in PHP.
      */

     // notice that PHP only calls this magic method and will execute whatever code you place inside it
     // this is similar to the constructor __construct() where PHP only calls this magic method
     // and will execute whatever code you place inside it
     // so it's up to you to put the logic of your application inside this magic method

     public function __get($name)
          {
           echo "Getting '$name'\n";
           if (array_key_exists($name, $this->data))
              {
               return $this->data[$name];
              }

           $trace = debug_backtrace();
           trigger_error(
                          'Undefined property via __get(): ' . $name .
                          ' in ' . $trace[0]['file'] .
                          ' on line ' . $trace[0]['line'],
                          E_USER_NOTICE
                         );

           return null;
          }

     /**
      * $obj = new MyClass('my_username_123', 'my_password_123', 'my_database_name_123', 'my_db_server_123');
      *
      * If you reference a property in a boolean reference, it will trigger a call to __isset()
      *
      * In other words, if you reference a property in a test reference to see if the property exists or
      * not null, it will trigger a call to __isset()
      *
      * In another word, this PHP magic method __isset() will be implicitly called when executing
      * isset($object->property) // with $object being $obj and property being propA
      *
      * For example: if ($obj->propA) or isset($obj->propA) // it will call the following __isset()
      */

     // notice that PHP only calls this magic method and will execute whatever code you place inside it
     // this is similar to the constructor __construct() where PHP only calls this magic method
     // and will execute whatever code you place inside it
     // so it's up to you to put the logic of your application inside this magic method

     public function __isset($name)
          {
           echo "Is '$name' set?\n";
           return isset($this->data[$name]);
          }

     /**
      * $obj = new MyClass('my_username_123', 'my_password_123', 'my_database_name_123', 'my_db_server_123');
      *
      * This PHP magic method __unset() will be implicitly called when executing this:
      * unset($object->property)
      *
      * For example: unset($obj->propA) // it will call the following __unset()
      *
      * notice that property propA have not been declared, but is it being declared and
      * used on the spot.
      * this is very legal in PHP.
      */

     // notice that PHP only calls this magic method and will execute whatever code you place inside it
     // this is similar to the constructor __construct() where PHP only calls this magic method
     // and will execute whatever code you place inside it
     // so it's up to you to put the logic of your application inside this magic method

     public function __unset($name)
          {
           echo "Unsetting '$name'\n";
           __unset($this->data[$name]);
          }

     // This is not a magic method, it is just for illustration example only
     // In addition to the four magic methods, you can add your own methods to
     // do other tasks a well, and this getHidden() is an example of that!

     public function getHidden()
          {
           return $this->hidden;
          }
    }


/* As you can see above, MyClass is a typical class that makes use of the */
/* four magic methods */

/* Note that PHP only calls these four magic methods and passing */
/* the appropriate property name and value (in the case of __set()) */

/* You have to implement the code inside these four magic methods any way */
/* according to your coding logic!!! */

/* Typically, you just set some properties (as shown in __set()) for __set() */
/* and retrieve some properties in the case of __get(), as for __isset(), */
/* check if a property exists in the case for __isset(). */
/* and likewise, perform an unset on the property in the case for __unset() */
/* self-explanatory!!! */


/**
 * Usage:
 *
 * $obj = new MyClass('my_username_123', 'my_password_123', 'my_database_name_123', 'my_db_server_123');
 *
 * $obj->a = 1; // doing this will trigger a call to __set($name, $value) and will output: Setting 'a' to '1'
 * notice the __set($name, $value) with $name being the property a and $value being assign to 1
 *
 * echo $obj->a . "\n\n"; // will trigger a call to __get($name) and will output: Getting '1'
 *
 * // notice that property a have not been declared, but is it being declared and
 * // use on the spot.
 * // this is very legal in PHP.
 *
 * var_dump(isset($obj->a));  // will trigger a call to __isset()
 * unset($obj->a);            // will trigger a call to __unset()
 * var_dump(isset($obj->a));  // will trigger a call to __isset()
 *
 * echo $obj->declared . "\n\n";
 *
 * echo "Let's experiment with the private property named 'hidden':\n";
 * echo "Privates are visible inside the class, so __get() not used...\n";
 * echo $obj->getHidden() . "\n";  // will not trigger any call to anyone
 * echo "Privates not visible outside of class, so __get() is used...\n";
 * echo $obj->hidden . "\n";
 *
 * The above example will output:
 *
 * Setting 'a' to '1'
 * Getting 'a'
 * 1
 *
 * Is 'a' set?
 * bool(true)
 * Unsetting 'a'
 * Is 'a' set?
 * bool(false)
 *
 * 1
 *
 * Let's experiment with the private property named 'hidden':
 * Privates are visible inside the class, so __get() not used...
 * 2
 * Privates not visible outside of class, so __get() is used...
 * Getting 'hidden'
 *
 */
?>
There you have it!!!
A Brief Introduction to Overriding Inherited Methods
What is overriding inherited methods?
Parent methods (such as constructors) can be overridden by child classes. To override parent methods, just redefine the parent methods (using the same name) in the child classes. For example, in class Vehicle shown earlier in the previous section, it has a constructor with two argument parameters: __construct($price, $taxRate) and a protected method called calculateTax().
You can define a child class called Toyota that overrides and extends class Vehicle to contain more constructor's argument parameters. Let's create a child class that has a constructor with two additional argument parameters in addition to the two argument parameters that parent class Vehicle already has. For example:
<?php
class Toyota extends Vehicle
    {
     // declaring class Toyota's properties as private:

     private $rebate;
     private $carbonTax;

     // declaring class Toyota's constructor with two additional parameters

     public function __construct($price, $taxRate, $rebate, $carbonTax)
          {
           /**
            * assigning values to class Vehicle's properties
            * $this refers to class Vehicle's properties
            */
           $this->price = $price;
           $this->tax = $taxRate;

           /**
            * assigning values to class Toyota's properties
            * $this refers to class Toyota's properties
            */
           $this->rebate = $rebate;
           $this->carbonTax = $carbonTax;
          }

     protected function calculateTax()
             {
              // getting a tax
              $tax = $this->$price x $this->$taxRate + $this->carbonTax - $this->rebate;
              return $tax;
             }
    }
?>
As you can see, the __construct() and calculateTax() methods in the child class (Toyota) override the __construct() and calculateTax() methods in the parent class (Vehicle).
Now to see the effect of the override methods in action in child class Toyota, consider this:
<?php
/**
 * now we're creating another class Ford outside of class Vehicle and Toyota.
 */
class Ford
    {
     // creating an instance of class Toyota which has four parameters:
     $obj = new Toyota('25000', '0.07', '5000', '2500');

     // call the newly inherited Toyota's method calculateTax()

     $obj->calculateTax();
    }
?>
Introduction to RSA Encryption
Check out the specification of the Public-Key Cryptography Standards (PKCS): The RSA Encryption Algorithm: RFC 8017 Public-Key Cryptography Standards (PKCS)
The RSA is a three-letter acronym derived from the names of its inventors at MIT in the 1970s using their last name's first letter as an acronym: Ron Revest, Adi Shamir, and Leonard Adleman.
The RSA encryption is a military-grade encryption scheme that is being widely used throughout the world, especially in banking applications and other top secret applications.
The RSA uses two keys: one called a public key and another called a private key. We'll discuss about keys later. For now, let's discuss about prime numbers.
The RSA uses prime numbers to create keys to encrypt and decrypt information.
For those of you who are not math inclined, or those who are not really into the historical and theoretical aspects of the RSA encryption, feel free to jump ahead to the implementation section.
For the rest, this section is probably of most significance (and of most importance) to those of you who are working with encryption or security in general. Having a detailed knowledge of how things really work (and why) is essential if you intend to keep your security systems one step ahead of hackers.
What are prime numbers?
Prime numbers have been of interest since the ancient Greek philosophers. However, they were not of interest for theoretical purposes until the latter half of the twentyth century: the 1960s and 1970s when computer technology was beginning to catch fire.
Researchers saw the vulnerability of the information age that computer technology brought and they began to find ways to make the information age secure. A group of researchers at MIT, namely Ron Revest, Adi Shamir, and Leonard Adleman, came on top and their fruit of labor is now being used widely throughout the world.
Let's start with the simplest definiton of a prime number. Prime numbers were discovered by Euclid, sometimes called Euclid of Alexandria.
Euclid was an Ancient Greek philosopher who was born in 300 BC. He was a super, super brilliant mathematician who contributed to the world of mathematics in epic proportion.
In the book VIII of Elements, Euclid defined a prime as a number that has no whole-number divisors other than 1 and the number itself. A few examples of prime numbers would be 2, 3, 5, 11, 13, etc.
As you can see, neither 2, 3, 5, 11, or 13 are divisible by any number other than 1 and itself.
On the other hand, a number that is not a prime is said to be a composite.
What is a relative prime number?
Another important definition is called relative prime. But some textbooks call it coprime. I call it relative prime.
A prime number is considered a relative prime to any other number if it does not divide that number. Make note: It does not divide that number! That number is not divisible by a prime!
In other words, a prime number has some relative numbers out there. It has lots of relatives out there. Somewhere in the world of numbers, there are numbers that are relative to this prime number.
Sort of saying a person born without knowing how many relatives he/she has in the world and that person needs to go out and find his/her relatives out there in the world.
The same thing is also true for prime numbers: They need to go out and find their relatives among the numbers in the set.
A prime number cannot divide a number if that number is considered to be a relative prime to a prime number.
This is sort of saying: A person out there whose one or both of his/her parents are not the same as the parent or parents of the person seeking to find relatives CANNOT be a relative to the person seeking to find relatives.
A simplier way of say is that, a person has to share of at least one parent with another person in order to qualify as a relative to that person.
Let's put it this way: If a prime number p is a relative prime to a number n, then: n mod p is not equal to zero. The two numbers are not divisible by one another. We can say that p is a relative prime to a number n or vice versa.
Note: mod is a remainder division function representing modulus operation. So the goal of mod is to return the remainder of a division. For example, 4 mod 2 = 0, 5 mod 2 = 1, 10 mod 5 = 0, and 10 mod 3 = 1 (because 10 divided by 3 resulted in the quotient of 3 with the remainder of 1.)
So if n mod p is equal to zero, it means that n is divisible by p. But n cannot be divisible by p in order to be considered as a relative prime number to p.
Knowing that, we can basically formulate the following three rules or theories or propositions as Euclid called them.
If a prime number p divides a product m * n (with m * n means m multiplies n), then p divides at least one of the two numbers m or n. See proposition 1 illustration below.
[By the way, in mathematics, a product is usually written as m * n, as well as m x n, as well as mn, and as well as m.n, too. The latter one with a dot "." notation.
So all four forms: m x n, m * n, mn, and m.n are all valid forms of a mathematical product.
You will see all of the above mathematical forms throughout this tutorial, particularly using parentheses to group multiple entities, for example:
]
(p - 1)(q - 1) = (p - 1) x (q - 1) = (p - 1) * (q - 1) = (p - 1) . (q - 1)Every number can be prime or else can be expressed as a product of prime in a way unique, apart from the order in which they are written.
This uniqueness is the key to the RSA cryptography.
A product of prime numbers will result in a prime number as well.
There are indefinitely many prime numbers (in the world of whole numbers.)
Okay, we have three propositions to prove, so let's lay them out one by one and then try to prove them:
Proposition 1:

If a prime number p divides a product mn,
then p divides at least of the two numbers m, n.

Proof:

Let the two numbers m and n multiplied by one another to make another
number o (letter o), and let any prime number p divides o.


Now we must prove that p divides m or n.

Let's assume that p does not divide m, therefore, p and m are relative primes.

Remember the definition of relative prime?

Now let's make another number e such that:

e = mn div p (we could use '/' instead of div as well)

(note: e is the number of units that p divides mn.)
(Make note: div and not mod.)
(div is a division function -- the same as '/'.)

Since p divides mn according to e, then pe = mn.

Therefore, p/m = n/e.

But p is a relative prime to m.

Therefore, they are the least of those that have the same ratio with them.
And the least divides the numbers that have the same ratio (p/n and m/e).

That is, p divides n (and m divides e.)

Similarly, we can also prove that if p does not divide n, then it must divide m.
Next up is Proposition II.
Proposition II is also known as the Fundamental Theorem of Arithmetic.
We'll prove Proposition II in two steps.
First, we can prove that a number can always be factored into primes, and then, secondly, we'll show that this process is unique; that is, there is only one prime factorization for each number.
This uniqueness is the key to the RSA cryptography.
See conclusion for similar statement at the end of Proposition II discussion for this second step.
Those are the two-step processes we are going to have to work through.
Proposition 2:

Every natural (or whole) number is either prime or can be uniquely factored as
a product of primes in a unique way.

Proof

Let's prove this using contradiction.

Let's assume that there are numbers that cannot be written as a product of primes.

Therefore, there must exist the smallest of such numbers; and we'll call it n.

By definition, n must be a natural number greater than 1.

'Nautral' means 'whole' and not fractional number.

So n = ab where a and b are natural numbers such as
a > 1 and b < n.

Therefore, a and b are smaller than n, so a and b can be factored into primes.

For example: n = (a - 1)(b - 1)

By substitution, n can be factored by primes.

This contradicts the assumption that there exist composite numbers that cannot be
factored into primes.

Conclusion: All natural numbers are either primes or can be written as a
product of prime numbers.

Now let's prove that this product is unique, again using contradiction.

This is the second step.

Let's assume that there are numbers that can be factored into primes in at least
two distinct "unique" ways.

Then, there must exist the smallest of such numbers, n,
where n can be represented by:

n = p1p2p3p4p5p6.....pk

OR

n = q1q2q3q4q5q6.....qk

Now let's select one of the members, say, p1.

We can say that p1 divides n, and, therefore,
it divides q1q2q3q4q5q6.....qk as well.

That means that n / p1 = q1q2q3q4q5q6.....qk / p1

But from Proposition I, if p1 divides the product q1q2q3q4q5q6.....qk,

then, p1 must divide at least one of its members, say,

q1 / p1

OR

q2 / p1

OR

q3 / p1

OR

q4 / p1

OR

qk / p1

Since all members on the right side of the equation (p1p2p3p4p5p6.....pk and
q1q2q3q4q5q6.....qk) are primes,
we can say that for a number qj (with 1 ⋜ j ⋝ n),
the following equality holds:

p1 = qj

We can, without loss of generality, assume j = 1

Therefore, p1 = qj

The result of n / p1 is a number smaller than n, and, consequently,
from our initial assumption,
it cannot be factorized in more than one unique ways.

It can only be factorized in one unique way!

Therefore, the consequences p2.....pk and q2.....qk contain the same primes,
possibly different only in their order.

Conclusion: There is only one way to factorize a number into primes.
This uniqueness is the key to the RSA cryptogrophy.

Well, if it wasn't the uniqueness property of the  prime,
the RSA cryptography would have not been invented and
the crytography landscape of the world would have been
a lot different than today's environment.

So the uniqueness property of the prime made the RSA cryptography possible.
Proposition III
Proposition 3:

There are indefinitely many prime numbers.

Proof

Let's start with the list: p1, p2, p3, ..... of all known primes.

We must prove that this list continues forever because proposition III states
that there are indefinitely prime numbers out there.

Let's assume that we have listed all primes up to some pm.

Now consider a number p such as:

p = p1p2p3....pm + 1

Note: that is pm + 1 and not pm + 1. Be careful to not confuse the two.

Note that p1p2p3.... means a product of multiple primes.

Likewise, p1p2 means a product of two primes.

If p happens to be a prime,
then p is a prime bigger than pm (because of the product)
and the list can continue (note that p might not be the next prime after pm,
in which case, p cannot be taken to be pm + 1).

If p is not a prime,
then it must be evenly divisible by a prime (Proposition 2).

But none of the primes p1p2p3....pm divides p.

If you carry out such division, you always end up with a remainder of 1.

Therefore, p must be divisible by a prime bigger than all primes up to pm.

Conclusion: We can always find a bigger prime for any given list p1p2p3....pm.

In other words, the list of primes continues forever because there are
indefinitely prime numbers out there.
Taken together, the first two propositions form the building blocks of all natural (or whole) numbers, much like the physicist's atoms.
Knowing the prime number factorization of a number gives complete knowledge about all factors of that number.
Now that we've learned some of the fundamental properties of prime numbers, we need to learn how to find them, and -- most importantly -- how to prove that they are in fact primes.
Finding Primes
How do we go about in finding primes?
There are many ways to find primes, and their efficiency usually depends on the size of the primes in which we are interested in, or on the probability of these numbers truly being primes.
One popular method of finding primes is called Sieve of Eratosthenes, which was invented by an ancient Greek philosopher named Eratosthenes in 280 BC.
To verify that n is a prime, follow this two-step process:
- You look at all numbers from 2 to n. For example, 2, 3, 4, 5, 6, 7, 8, 9, 10, 11, 12, 13, 14, 15, ......, n.
Here is a PHP code fragment to list the numbers from 2 to n:
<?php
$n = 2147483647;
$a = array();

$a[0] = 0; // we know that this is not a prime
$a[1] = 0; // we know that this is not a prime

// we start with 2 since 0 and 1 have already been initialzied above

// as you can see, it loops through $n = 2147483647 which
// takes some time to loop through!
// and (FYI) in my computer it overwhelmed the RAM and gives this error message:
// PHP Fatal Error: Allowed memory size of 134217728 bytes exhausted
//                 (tried to allocate 134217736 bytes)
// what that error message is saying is that the RAM in my computer is too small
// to hold the 134217736 bytes
// anyhow, let's go on in illustrating the code

for ($i = 2; $i < $n + 1; $i++)
    {
     // initialize all array indexes $a to 1 up to $n
     // so $a[2] = 1, $a[3] = 1, $a[4] = 1, $a[5] = 1, ...

     $a[$i] = 1;
    }
 ?>
So you start with the smallest number, which is 2, and work your way upward to n.
Then you eliminate all multiples of 2 up to n. For example, what is left is this: 2, 3, 5, 7, 11, 13, ......, n.
Notice that 15 is an odd number but it is not a prime number because in the definition of prime stated earlier, it says a number cannot be divided by another number and 15 can be divided by 3 (which is 5); and therefore, 15 fails the definition of prime.
Likewise, 9 is not a prime number either because 9 can be divided by 3 (which is 3); and therefore, 9 fails the definition of prime as well.
Here is a PHP code fragment to eliminate multiples of 2 up to n:
<?php
$n = 2147483647; // variable $n is an aribitrily number you supply!
$a = array();
$p = 2;

while ($p < $n)
    {
     // step through multiples of 2
     $j = $p * 2; // $j = 4, 6, 8, 10, 12, 14, .....

     // variable $n is an aribitrily number you supply!
     while ($j <= $n)
         {
          // eliminate multiples of two up to $n
          // and we know that these are not primes
          // so $a[4] = 0, $a[6] = 0, $a[8] = 0, $a[10] = 0, ...

          $a[$j] = 0;
          $j += $p; // $j = $j + $p   or  $j = 4, 6, 8, 10, 12, 14, .....
         } // end while ($j <= $n)

     do
         {
          // $p = 3, 4, 5, 6, 7, 8, 9, 10, 11, .... $n
          $p += 1;
         }
     while ($a[$p] != 1)
    } // end while ($p < $n)
 ?>
So now what is left is this: 2, 3, 5, 7, 11, 13, ......, n.
So what do these numbers in the list that were not eliminated mean?
Well, we'll look at the definition of prime again, and it goes like this: A prime is a number that has no whole-number divisors other than 1 and the number itself.
So the numbers in the list are prime numbers because they are not divisible by any other number other than 1 and themselves. So 2, 3, 5, 7, 11, 13 are prime numbers.
That's all you have to do to find prime numbers.
Although the numbers resulting from this method are sure to be primes, this algorithm is very slow and has exponential complexity, meaning it runs exponentially in the number of digits in the number n. As you can see in the fragment code illustration above, it loops through n = 2147483647 which takes some time to loop through.
Anyhow, let's go ahead and create a function to generate prime numbers using Sieve of Eratosthenes method illustrated above.
Let's put the whole pieces of code illustrated above together to form a complete code.
Here is an implementation of the Sieve of Eratosthenes:
<?php
/**
 * finding primes using Sieve of Eratosthenes
 */

public function prime($n)
     {
      $a = array();

      $a[0] = 0; // we know that this is not a prime
      $a[1] = 0; // we know that this is not a prime
      $p = 2;

      // we start with 2 since 0 and 1 have already been initialized above

      for ($i = 2; $i < $n + 1; $i++)
          {
           // initialize all array indexes $a to 1 up to $n, for example:
           // $a[2] = 1, $a[3] = 1, $a[4] = 1, $a[5] = 1, ...

           $a[$i] = 1;
          }

      while ($p < $n)
          {
           $j = $p * 2;

           // remember that all array $a was initialized to 1, for example:
           // $a[2] = 1, $a[3] = 1, $a[4] = 1, $a[5] = 1, ...

           // now the while loop below goes a step further to eliminate any
           // array $a (index) that is divisible by 2 (not primes)

           while ($j <= $n)
               {
                // eliminate a multiple of two up to $n
                // and we know that these are not primes, for example:
                // $a[4] = 0, $a[6] = 0, $a[8] = 0, $a[10] = 0, ...

                $a[$j] = 0; // set $a[4] = 0
                $j += $p; // now increase $j by 2 (now $j = 6, 8, 10, 12, 14, ....)
               } // end while ($j <= $n)

           // so after the while loop above, the array $a should now contains
           // a number 1 when its index is not divisible by 2, hence it is a prime
           // for example, $a[3] = 1, $a[5] = 1, $a[7] = 1, $a[11] = 1, ...

           // here, we're looking for primes
           // in other words, the do ... while loop below stops/exits once $a[$p] = 1

           // meaning, $a[$p] contains a prime number because the first time the loop
           // hits the condition $a[$p] = 1 when $p is 3 and then it exits the do .. while loop
           // and it goes to the outer while loop: while ($p <= $n) to continue its iteration,
           // and this time, $p is 3 and it comes down to execute the do ... while loop again
           // now it hits the condition $a[$p] = 1 again when $p is 5 and then it exits
           // the do .. while loop, and then it goes to the outer while loop again: while ($p <= $n)
           // it repeats this process over and over again until it reaches $n

           do
               {
                // $p = 3, 4, 5, 6, 7, 8, 9, 10, 11, .... $n
                $p += 1;
               }
           while ($a[$p] != 1)
          } // end while ($p <= $n)

      $k = 0;
      $prime = array();

      // iterate through n again, but this time we're only
      // looking to pick out only primes

      for ($i = 2; $i < $n + 1; $i++)
          {
           // test to see if any of array index $a = 1 up to $n
           // if $a = 1 then it is a prime!
           // so store it in array $prime for later retrieval

           if ($a[$i] != 0)
              {
               $prime[$k] = $a[$i];
               $k++;
              }
          }

      return $prime;
     } // end function prime($n)

/**
 * prime() above can be called like this:
 *
 * $n = 50;
 *
 * $p = prime($n);
 *
 * foreach ($p as $value)
 *       {
 *        echo $value . " ";
 *       }
 *
 * output: 2 3 5 7 11 13 17 19 23 29 31 37 41 43 47
 *
 * or if $n = 100;
 *
 * output: 2 3 5 7 11 13 17 19 23 29 31 37 41 43 47
 *         53 59 61 67 71 73 79 83 89 97
 */
?>
Here is another implementation of the Sieve of Eratosthenes that I want to illustrate. The code illustrated above and the following code (below) will achieve the same result, so that you can see that there are many ways to generate prime numbers. For a better alternative, use PHP's function called gmp_nextprime().
I want to illustrate that the code above is a tidbit slower than the one below; because, as you can see, the code above has four loops that loop from 2 to n, while the one below has only three loops (but four if you count the array_fill() loop, too).
The code above, I could have chosen to use array_fill() instead of the for() loop and both codes would have achieved the same performance. However, I chose to use for() loop just to illustrate that there are many ways to achieve the same result and also to point out that there are performance discrepancies between the two.
In the end, there isn't much meaningful differences in performance between the two -- only the one below is a very tiny, slightly faster only because of the use of the array_fill().
Because of the "computationally intensive" problem, it is generally a normal practice to generate primes randomly rather than using loops (four loops in this case).
In other words, randomly choose a number and then test that number for prime. That way it can be done without loops or fewer loops.
Use Fermat's Little Theorem to test for prime. See a section called Primality Test a little bit later.
If you don't want to use Fermat's Little Theorem to test for prime, it's not the end of the world to use loops (as my illustrations show). As a matter of fact, lots of people have done so for decades without using Fermat's Little Theorem.
However, wise guys tend to choose a random number, say, 3754 (or any number), and test it for prime. That is the quickest way to create prime numbers for your RSA applications.
If you want to use random primes, here is one way to do it.
You could use the Sieve of Eratosthenes code illustrated in this tutorial to create a list of prime numbers and store them in a file or database or some other storage mediums. See my code later about using a json file to store keys.
That way, you don't have to worry about taking too long to create prime numbers on the go, because you already created them and tested them for primes before hand.
Here is one way to do it:
<?php
/**
 * First, you have to create primes using Sieve of Eratosthenes method.
 * Second, store them in a file, database, or some other mediums.
 * Third, when you need random prime numbers, just retrieve them from
 * the storage device you created in the second step.
 *
 * This way, you don't need to create prime numbers on the fly as most
 * wise guys often do!
 *
 * Here is one way to do it:
 */

// retrieve prime numbers from a storage device
// and place them in an array, for example:

$prime = array();

// assuming you're retrieving them from a database

try
    {
     // assumming $conn is an instance of a PDO

     $stmt = $conn->prepare("SELECT prime FROM primetable");

     /**
      * retrieve prime numbers from the database
      * and place them in an array variable: $prime
      */

     $prime = $stmt->execute();
    }
catch (PDOException $e)
    {
     echo 'ERROR: Cannot select data from the database: ' . $e->getMessage();
    }

// mimicking a random prime number generator

// this example assumes we're working with
// 201 prime numbers: 0 to 200

do
    {
     $i = rand(0, 200);
     $j = rand(0, 200);

     $p = prime[$i];
     $q = prime[$j];
    }
while ($p == $q) // if p == q, keep looking!

// when p and q are distinct, we stop looking and keep them!

// now you can use p and q to calculate your RSA algorithm!
// you might want to put this fragment of code in a function
// and modify it slightly to return p and q
// so that you can call it conveniently!

// or leave it "AS IS" and use the following code to store them!

// remember that p and q are secret keys; and therefore,
// they need to be encrypted and stored in a secure medium

$data = [
         "p" => $p,
         "q" => $q,
         "date" => date("d-m-Y H:i:s") /* displays: 2016-04-26 20:01:04 */
        ];

try
    {
     $stmt = $conn->prepare("INSERT INTO keytable (p, q, date)
                                           VALUES (?, ?, ?) ");

     /**
      * $data contains three items: p, q, date.
      * execute the place holder ? ? ?
      */

     $stmt->execute($data);
    }
catch (PDOException $e)
    {
     echo 'ERROR: Cannot insert data into the database: ' . $e->getMessage();
    }
?>
There are lots of ways to test for prime. Google Miller-Rabin algorithm to test for primes as well.
Better yet, PHP has a function called gmp_prob_prime() which uses the Miller-Rabin algorithm to return primality test result. Function gmp_prob_prime() checks to see if a number is "probably prime."
Example usage: gmp_prob_prime($num).
If this function returns 0, $num is definitely not prime. If it returns 1, then $num is "probably" prime. If it returns 2, then $num is surely prime.
So use this function to your advantage to check if a number is prime or not. Check out the following link:
Side note: Also note that using this form ++$i is 1/3 faster than $i++, which matters for big loops. So I recommend using this form: ++$i (the pre-arithmetic operator) for most of your programming code rather than the post-arithmetic operator: $i++.
<?php
/**
 * Sieve of Eratosthenes method of finding primes
 *
 * php program to print all primes smaller than or equal to n
 *
 * $n = 2147483647
 */

public function sieveOfEratosthenes($n)
     {
      // create a boolean array "prime[0..n]"
      // and initialize all entries as true.
      // a value in prime[i] will finally be
      // false if i is not a prime, else true.

      $prime = array_fill(0, $n + 1, true);

      for ($p = 2; $p * $p <= $n; $p++)
          {
           // if prime[p] is not changed,
           // then it is a prime
           if ($prime[$p] == true)
              {
               // update all multiples of p
               for ($i = $p * $p; $i <= $n; $i += $p)
                   {
                    // if $prime[$i] is not a prime, return false
                    $prime[$i] = false;
                   }
              }
          }

      // print all prime numbers

      for ($p = 2; $p <= $n; $p++)
          {
           if ($prime[$p])
              {
               echo $p . " ";
              }
          }
     } // end function sieveOfEratosthenes()

/**
 * sieveOfEratosthenes() above can be called like this:
 *
 * $n = 50;
 *
 * sieveOfEratosthenes($n);
 *
 * output: 2 3 5 7 11 13 17 19 23 29 31 37 41 43 47
 *
 * or if $n = 100;
 *
 * output: 2 3 5 7 11 13 17 19 23 29 31 37 41 43 47
 *         53 59 61 67 71 73 79 83 89 97
 */
?>
Create a function that will return an array containing a range of prime numbers. Because of the way in which the algorithm works, the function above isn't possible to generate just a selection of numbers, and as you can see from the output above, the numbers must all be generated and stored in the array variable $prime.
That is not very useful if you just want one prime number to use in your application and not the whole list of primes. The following function aims to achieve that goal.
<?php
/**
 * find all the primes up to a given number using
 * the Sieve of Eratosthenes algorithm.
 *
 * @param $start The number to start searching for prime numbers.
 * @param $finish The number to stop searching for numbers.
 *
 * @return array The array of prime numbers.
 */

public function findPrimeRange($start, $finish)
     {
      // initialize the range of numbers.
      $number = 2;

      // create an array containing a range of elements from "2" to
      // "2147483647":
      // $range[2..2147483647]
      // Array ( [2] => 2 [3] => 3 [4] => 4 [5] => 5 ...... )

      $range = range(2, $finish);

      // create an array by using the key elements from first argument as
      // key and "value" from the second argument as value

      // $prime[2] => 2, $prime[3] => 3, $prime[4] => 4, ....

      $prime = array_combine($range, $range);

      // loop through the numbers and
      // remove the multiples from the primes array.

      while ($number * $number < $finish)
          {
           for ($i = $number; $i <= $finish; $i += $number)
               {
                if ($i == $number)
                   {
                    continue;
                   }
                unset($prime[$i]);
               }
           $number = next($prime);
          }

      // slice the array into the given range

      foreach ($prime as $p)
            {
             if ($p < $start)
                {
                 unset($prime[$p]);
                }
             else
                {
                 break;
                }
            }
      return $prime;
     }

/**
 *This can be used in the following way.
 *
 * print_r(findPrimeRange(30, 50));
 * Array
 *     (
 *      [31] => 31
 *      [37] => 37
 *      [41] => 41
 *      [43] => 43
 *      [47] => 47
 *     )
 */


/**
 * PHP code to check wether a number is prime or not
 * function to check the number is prime or not
 */

public function primeCheck($number)
     {
      // we know that 0 and 1 are not primes!

      if (($number == 0) || ($number == 1))
         {
          // not a prime
          return 0;
         }

      // we know that 0 and 1 are not primes, so start with 2

      for ($i = 2; $i <= sqrt($number); $i++)
          {
           if ($number % $i == 0)
              {
               return 0;
              }
          }
      return 1;
     }

/**
 * Usage:
 *
 * $number = 31;
 * $flag = primeCheck($number);
 *
 * if ($flag == 1)
 *    {
 *     echo "Prime";
 *    }
 * else
 *    {
 *     echo "Not Prime"
 *    }
 */
?>
Check this out to find the next prime number, say, if want to find the next prime number after a certain number, say, 10, gmp_nextprime(10) will return 11. This PHP function is suiteable for looking for a certain prime number after a certain number, say, you want to find a prime number after 2436.
You could use PHP function gmp_nextprime() to your advantage to generate a list of prime numbers. For example:
<?php
/**
 * mimicking a random prime number generator
 *
 * Usage:
 *      $prime = generatePrime(100);
 *
 * for() loop will loop through 100 times and generates 100 prime numbers
 */

public function generatePrime($n)
     {
      for ($i = 0; $i < $n; $i++)
          {
           // you can make the range as wide or narrow as you want!
           // or as large or small as you want!

           $j = rand(100, 200000);

           // function gmp_nextprime() returns the next prime number after $j

           $prime = gmp_nextprime($j);

           try
               {
                // assuming $conn is a PDO object!

                $stmt = $conn->prepare("INSERT INTO primetable (prime)
                                        VALUES (?) ");

                // execute the place holder ?

                $stmt->execute($prime);
               }
           catch (PDOException $e)
               {
                echo 'ERROR: Cannot insert data into the database: ' . $e->getMessage();
               }
          } // end for()
    } // end generatePrime()
?>
There you have it! A fast way to generate primes.
Here is more theories about generating primes.
Mathematicians for centuries have been trying to find equations for generating prime numbers, but their success has been slow and valid to only a small range of natural numbers.
Lenard Euler, the Swiss mathematician, came up with the following equation:
f(x) = x2 + x + 41, which is prime for x = 0, 1, 2, ..., 39.
This quadratic equation was the record holder for centuries as a consecutive, distinct quadratic prime-producer for an initial range of input values.
It is not, however, the current record holder. That distinction goes to this function:
f(x) = 36x2 - 810x + 2753, which is prime for x = 0, 1,..., 44.
As you have probably noticed, these functions are also very limiting in their range and are of very little or no practical use.
To be of any real use, we need a method that can produce an infinite number of primes, and of any size we want.
The best way found to deal with this problem, since there are no formulas for finding all prime numbers in sequence, is to instead find numbers that are "very likely" to be primes. Hence, testing for primes or primality.
Primality Test
If we are going to use our primes for industrial uses (e.g., encryption), we often do not need to prove that they are primes.
It may be enough to know that the probability they are composite is less than a given percentage (e.g., 0.000000000000000000000001). In this case, we can use (strong) probable primality tests.
Let's refresh our memory: A number that is not a prime is said to be a composite.
Most of these tests are based on what is known as Fermat's Little Theorem (named after a French mathematician named Pierre de Fermat (1601-1665)).
The Fermat's Little Theorem states:
If p is a prime and if a is any integer, then ap = a (mod p).
In particular, if p does not divides a, then a(p - 1) = 1.
You can't just pick a random number and use it as your RSA encryption key. It won't work. You have to test it for primality using Fermat's Little Theorem. You also can use PHP function gmp_prob_prime() which uses Miller-Rabin algorithm to return primality test result.
Basically, what Fermat's Little Theorem is trying to accomplish is to find the remainder of a number (a raise to the power of (p - 1)) by dividing a(p - 1) by p to equal 1.
That's what this equation a(p - 1) = 1 means.
And that's what the statement: "if p does not divides a, then a(p - 1) = 1" above means.
So p needs to be a prime number in order for it to be a remainder of 1.
Another way of saying is that, the left side divided by p equals to a remainder of 1. So you need to divide the left side by p until the remainder is equal to 1, then stop.
Please check out tutorials on YouTube on Fermat's Little Theorem
Let's see the proof of Fermat's Little Theorem.
Fermat's Little Theorem
Proposition:

If p is a prime and if a is any integer, then ap = a (mod p)

In particular, if p does not divide a, then a(p - 1) = 1.

Proof

Start by listing the first (p - 1) positive multiples of a

For a visual guide, see YouTube tutorials mentioned earlier.

For example:

a, 2a, 3a, .... (p - 1)a

Suppose that ra and sa are the same modulo p, then we have r = s (mod p),
so the (p - 1) multiples of a above are distinct and nonzero; that is,
they must be congruent to 1, 2, 3, ...., (p - 1) in some order.

Multiply all these congruences together and we find:

a.2a.3a .... (p - 1)a = 1.2.3 .... (p - 1) (mod p)

OR better:

a(p - 1) (p - 1)! = (p - 1)! (mod p)

Divide both sides by (p - 1)! to complete the proof.

Don't worry if you don't understand the proof! It's not important!

However, you need to know how to find the remainders of a number.
See YouTube tutorials mentioned earlier.

Conclusion: There is only one way to factorize a number into primes.
As you can see from the above proposition of the Fermat's Little Theorem, there is only one way to factorize a number into primes.
It's important to note that Fermat's Little Theorem is a compositeness test, and not a primality test; that is, it tells you for sure if a number is a composite (not a prime.)
If the test is positive, the number is guaranteed to be a composite, otherwise, it might be a prime.
However, statistically speaking, this method is good enough for many practical applications, including encryption--RSA in particular.
There are 1,091,987,405 primes less than 25,000,000,000; but only 21,853 pseudo-primes base two, which gives us an error probability less than 0.00009% (a very miniscule probability of error -- and we can live with that!).
Note that the term pseudo-prime refers to the result of the primality test to be a positive test (not necessarily that it is a prime. See the primality test above.
We can reduce this margin of error even further by using multiple bases. This is exactly what the Miller-Rabin method does. See next function illustration for the Miller-Rabin Primality Test below.
The Miller-Rabin primality test method gives us a proved probability of error less than 1/s2, where s is the number of bases we tried.
The following code illustration uses a built-in PHP function called gmp_prob_prime() to test the number for primality.
Behind the scene, function gmp_prob_prime() uses Miller-Rabin algorithm to return primality test result.
<?php
$max = 2147483647;

$primeFound = 0;
$probablePrime = 0;

for ($x = 1; $x <= $max; $x++)
    {
     $primeStatus = gmp_prob_prime($x);

     if ($primeStatus == 1)
        {
         $probablePrime++;
        }
     else if ($primeStatus == 2)
        {
         $primeFound++;
        }
    }
echo "Total primes found between 1 and " . $max;
echo " - certain primes found: " . $primeFound;
echo "probable primes: " . $probablePrime;
?>

Based on that the following results were obtained:

Total primes found between 1 and $max - certain primes found:

1 - 100000      - certain primes found: 9592,     probable primes: 0

Total primes found between 1 and $max is:

1 - 1000000     - certain primes found: 78498,    probable primes: 0

Total primes found between 1 and $max is:

1 - 10000000    - certain primes found: 78498,    probable primes: 586081

Total primes found between 1 and $max is:

1 - 100000000   - certain primes found: 78498,    probable primes: 5682957

Total primes found between 1 and $max is:

1 - 1000000000  - certain primes found: 78498,    probable primes: 50769036

Total primes found between 1 and $max is:

1 - 2147483647  - certain primes found: 78498,    probable primes: 105019067

Don't worry if you don't understand the code above! It's not that important!
It's for illustration purpose only!

Instead, check out PHP documentation on gmp_prob_prime()
?>
Let's focus our attention in finding and factoring primes.
Factoring Primes
The dual problems of factoring integers and testing primality have surprisingly many applications for a problem long suspected of being only of mathematical interest.
As we'll see below, the security of the RSA public-key cryptograph system is based on the computational intractability of factoring large integers [i.e., (p - 1)(q - 1)].
Before we go on, I want to clarify one term that is being used throughout this tutorial and in other texts describing the RSA cryptography. That term is: factoring or factorize or plainly as factor.
What does it mean?
Well, in mathematics, to factor a number is to derive or break that number into small chunks so that the chunks still retain the original property or meaning.
For example, how many smaller chunks can 6 be broken into?
How many factors can 6 be factored?
Well, let's see the possibilities: 6/6 = 1, 6/1 = 6, 6/2 = 3, 6/3 = 2. Answer: 4 or 4 factors.
Notice that 6/4 = 1.5 and 6/5 = 1.2 are not factorizable.
You'll see later that we multiply two prime numbers (p - 1)(q - 1) to create a public key.
For example: (3 - 1)(5 - 1) = 8
Now 8 is the result of the factorization of (p - 1)(q - 1)
Note: 8 is not the factor of (p - 1)(q - 1). It is the result of factoring (p - 1)(q - 1)
.So that's what the term: factoring or factorize or factorization or plainly as factor means.
Now let's continue on from where we left off:
[A side note: As a more modest application, hash table performance typically improves when the table size is a prime number.
To get this benefit, an initialization function must identity a prime near the desired table size.]
As you imagine, factoring and primality testing are related problems. However, they are quite different algorithmically.
In the sections above, we saw that we can demonstrate that an integer is composite (i.e., not prime) without actually giving the factors.
To convince yourself of the plausibility of this, note that you can demonstrate the compositeness of any nontrivial integer whose last digit is 0, 2, 4, 5, 6, or 8 without doing the actual division.
The simplest solution to factorization is also the simplest one used in primality tests; that is, brute-force trial-division.
However, this is extremely slow for big numbers; and therefore, impractical for any real application.
Another solution, a bit faster than trial-division, is the Square Root Method. See an illustration later.
The Square Root Method is okay for small numbers (15 digits or less), but will become too slow for anything larger than that.
[Note: For heavy-duty industrial commercial encryption purposes, anything less than 150 digits is considered small.]
The Square Root Method as the name implies used square root to implement the function.
The fastest known algorithm used in factorization is the Number Field Sieve. It uses randomness to construct a system of congruences, the solution of which usually gives a factor of the integer.
The method was developed by Pollard and was used to factor the RSA-130 number (such a feat required enormous amounts of computation power.)
As you can see, the strength of encryption algorithms such as RSA relies on the fact that it's really hard to decompose a large number into its factors.
These algorithms use an integer n made of two or more primes, such as: n = p x q or n = p x q x r x s where p, q, r, and s are large prime numbers.
Breaking n into its factors requires an enormous amount of computation that can last for many years (even when using multiple machines).
To demonstrate how secure such algorithms can be, cash prizes were offered to those who manage to factorize these numbers.
Message Encryption
This huge disparity between the ease of finding large prime numbers, and the difficulty of factoring large numbers, is fully exploited when devising secure forms of public key cipher systems.
In other words, finding large prime numbers is very easy, but factoring them is very hard.
The basic components of the system are two programs, an encryptor and a decryptor.
Both the sender/encryptor and receiver/decryptor need to have keys.
Typically, the keys will consist of one hundred or more digits -- a very large number. The security of the system depends on keeping some of the keys secret.
This method immediately raises the following question: How can we send the key to the receiver of our message?
If we decide to mail it through a postal mailing system, we need to trust that the mailing system is absolutely 100% secured and tampered proof. Can we trust that? If we send a food recipe to our family and relatives, there is no problem in sending the key through the mailing system.
Or we can always meet up with the person and hand the key to that person days, months, or years in advance and let that person use that key to send us encrypted materials whenever that person needs to do so.
Yeah, we can do that, but it's not very practical for other uses, say, when you want to send a sensitive document to a person far, far away in the other side of the world.
To solve this problem, Whitfield Diffie and Martin Hellman, in 1975, proposed the idea of a public key cryptosystem (PKS).
In a PKS, each potential message receiver A (which would be anyone who intends to use the system) uses a program that will produce not one, but two keys: An encryption key and a decryption key.
The encryption key is made public to all those interested in sending "the receiver" A a message, while the decryption key is kept secret.
Although the basic idea behind such a system is simple, designing it is not.
The one originally proposed by Diffie and Hellman turned out to be not as secure as they had thought, but a method devised a short time later by Rivest, Shamir, and Adleman (the RSA fame) proved to be much more robust and secure, and its byproduct, the RSA system, is now being used widely in international banking, online transactions, military and satellite communications, to name just a few.
The main difficulty for anyone designing such a system is that the encryption process should disguise the message to such an extent that it is impossible to decode it without the decryption key.
But because the essence of the system, and indeed of any cipher system, is that the authorized receiver can decrypt the encoded message, the two keys must be mathematically related.
The receiver's program and decryption key should exactly undo the effect of the sender's program and encryption key, so it should be theoretically possible to obtain the decryption key from the encryption key, provided one knows how the cipher programs work.
The trick is to ensure that, although it is theoretically possible to recover the decryption key from the publicly available encryption key, it is practically impossible.
Let's put it this way: To break the encryption, all you have to do is undoing or unraveling the public key that is publicly made available to anyone, including hackers. In other words, break the public key into its factors of p * q.
In mathematic, undoing the product of p * q means to do a multiplicative inverse of p * q.
So to break the public key, all you have to do is performing a multiplicative inverse of p * q.
This is how hackers break encryption by using computer programs to calculate the multiplicative inverse of the public key.
The public key = p * q
Or it is usually written as n = p * q.
To undo or break the public key, all you have to do is factoring the public key (or n) into its possible factors which is practically impossible if you use large prime numbers.
In the case of one-way ciphers such as RSA, the receiver's secret decryption key consists of two large prime numbers (p and q at least 75 digits each), and the public key consists of their product (a 150-digit number = 75 + 75).
With current technology, it's practically impossible to factor numbers of that size in a reasonable time.
In computer memory, each digit holds 16 bits. So when working with cryptography, you use numbers that are multiples of 16 or divisible by 16. For example, a 1024-bit and 2048-bit keys are divisible by 16.
In general, if you're working with numbers of size N bits, you'll need 2*N bits of storage. Each digit holds 16 bits. So, a 1024-bit key will need 1024 * 2 / 16 = 128 digits of storage.
Let's for the sake of simplicity, we use two primes: 2 and 6; and therefore, the public key becomes 6.
Now all we have to do to unravel the public key is to factor the public key, which is 6, into its original two primes: 2 and 3.
We can do it in our head with these small primes, and even with numbers reasonably large, hackers can still use computer programs to factor these public keys to unravel the public keys.
A computer can quickly compute the greatest common divisor of two numbers using the Euclidean algorithm, so an attacker can run the algorithm on two public keys. If their greatest common divisor is not 1, then the attacker has found a prime number dividing both keys, therefore breaking two keys at the same time.
For example, suppose two public keys were 239149 and 166381. It is difficult to factor either of these two numbers by hand, but the Euclidean algorithm can be done by hand, revealing that the two numbers have a greatest common divisor of 379.
To give you a quick idea of the importance of this algorithm, here are a few of the security protocols that currently implement RSA.
- IPSEC/IKE - IP data security.
- TLS/SSL - Transport data security (Web).
- PGP - Email security.
- SSH - Terminal connection security.
- SILC - Conferencing service security.
- and many others.
As I mentioned in the previous section, efforts to develop new algorithms to factorize such numbers are usually subjects for doctorate theses and can bring instant fame for those who succeed.
The current record for factorization is around 155 digits.
(Note: New algorithms designed for quantum computers, when and if they ever get to build one, may render this sort of encryption system obsolete, but until then, RSA will continue to be one of the safest encryption systems available.)
The RSA Algorithm
To create a good implementation of the RSA algorithm, you need three things:
- Arbitrary precision arithmetics (multiple precision arithmetic functions). See precision arithmetic functions later.
A pseudo-random number generator to use to generate random primes.
It is generallly a typical practice to create primes using some random methods (i.e., rand()) to generate a random number and then test for prime, rather than just picking some numbers and test for primes. See earlier sections on how to generate primes, especially function findPrimeRange().
Also, be mindful of the "computationally intensive" problem when selecting a range of number to use in findPrimeRange().
Check this out as well to find the next prime number say, if want to find the next prime number after 10, gmp_nextprime(10) will return 11. This PHP function is suiteable for looking for a certain prime number after a certain number, say, you want to find a prime number after 25436.
- A knowledge on how to use Euclidean Arithmetic to solve the Greatest Common Divisor of two numbers, especially finding the inverse of a number and taking a modulo on another number.
More on this topic later.
With the facts presented up to this point, we can now start a formal description of the algorithm behind RSA.
The best way to describe it is using the simplest case possible: Where a sender, call it S, wants to send a message to a receiver, call it R.
For the particular case of this example, we will assume that the message is a two-digit integer. For example, 77.
Before it can receive secure messages from S or anyone else interested in sending messages, R will need to generate a public key.
To do this, R must find two large prime numbers, call them p and q, having at least 75 digits, then multiply them to make a number n such as n = p.q.
PHP has a function called bcmul() that multiplies two arbitrary precision numbers p and q. So n = bcmul(p, q).
n will be R's public key (and R should keep p and q a secret).
Somewhere in your coding process, you need to handle the keys gracefully, such as store them in a database or file or some secure medium, while at the same time, making sure that they can be easy access to them so that you can retrieve them quickly and use them.
If you choose to store them in a file, PHP has two functions to make storing/retrieving very easy. These functions are called file_put_contents() and file_get_contents().
// reading/retrieving keys from config file containing keys

$config = json_decode(file_get_contents('http://www.example.com/config/config.json'));

$key_expiration_date = $config['key']['KEY_EXPIRE'];

$login_expiration_date = $config['login']['LOGIN_EXPIRE'];

foreach ($config as $k => $v)
      {
       if ($k == 'key')
          {
           // test for certain expiration date and handle it accordingly
           // you might find a more elegant way of comparing the two dates than this!
           // you get the point!
           if ($key_expiration_date > 'today's date')
              {
               // the expiration date has not been reached ... keys are still good!
               // proceed on!

               foreach ($v as $key => $value)
                     {
                      if ($key == 'P')
                         {
                          $p = $value;
                         }
                      elseif ($key == 'Q')
                         {
                          $q = $value;
                         }
                      elseif ($key == 'PUBLIC')
                         {
                          $public_key = $value;
                         }
                      elseif ($key == 'PRIVATE')
                         {
                          $secret_key = $value;
                         }
                     } // end inner foreach ($v as $key => $value)
              } // end if ($key_expiration_date > 'today's date')
           else
              {
               // keys have expired .... discard old keys and generate new keys!
               // and update your json file to reflect your changes!
              }
          } // end if ($key == 'key')
       elseif ($k == 'login')
          {
           // test for certain login expiration date and handle it accordingly
           // you might find a more elegant way of comparing the two dates than this!
           // you get the point!
           if ($login_expiration_date > 'today's date')
              {
               // the login expiration date has not been reached ... keys are still good!

               // handle login accordingly
              }
           else
              {
               // login keys have expired .... discard old keys and generate new keys!
               // and update your json file to reflect your changes!
              }
          } // end elseif ($k == 'login')
      } // end outer foreach ($config as $k => $v)

storing keys in the config file

this code below is incomplete due to space constraint.
please check out my other tutorial call "Introduction to Ajax" and navigate
to the very end of that tutorial to find example code similar to the one below.

$config = .......

file_put_contents('http://www.example.com/config/config.json',
json_encode($config, JSON_PRETTY_PRINT));

keys must be encrypted, especially the private key.
there are several pure PHP implementations of the symetry
algorithms on the Web that you can use to encrypt your keys,
such as RC4, AES, DES3, Blowfish, etc.

the process goes like this:

generate two primes and solve for d and then encrypt them and
store them.

when you need to use them, retrieve them and decrypt them and
use them.

there is a pure PHP implementation of the symetry algorithm
RC4 in my other tutorial called "Introduction to RC4."

now a json config.json file looks like this:

{
    "key":
          {
           "P": "1e8f50c3a80b7c0",
           "Q": "4a01fb7c0e92b6c",
           "D": "0f0c1b3c0e5a218",
           "E": "6a9e1f3c0e98b6c",
           "PUBLIC": "e201ab3c39c7d4e1d",
           "PRIVATE": "0f5b3c390g3d20b3c",
           "KEY_EXPIRE": "2592000"
          },

    "login":
          {
           "USERNAME": "my_username",
           "PASSWORD": "7ac1f1b7c0e92b6f",
           "LOGIN_EXPIRE": "2592000"
          }
}

note: do not embedd any comment in your json file!

basically, once you've retrieve this json file,
you can convert it into an array using json_decode() so that
you can iterate through your array as you normally would!

one last note:

it is a good idea to tie your keys to an expiration date,
so that you can discard them and issue new keys.
this practice adds extra security to your security system.

you can timestamp your key file and read the timestamp
of that file and compare it against the current timestamp.

for example, a value for a 24-hour timestamp is: 3600 * 24 * 30
or 2,592,000 miliseconds.

PHP's current timestamp function is: time()

$time is 24 hours old, it's 24 hours ago, it's yesterday!
$time = time() - (3600 * 24 * 30);

if your file time was created two days, filemtime() should
be less than $time. confusing?

check out PHP doc for filemtime()

filemtime() returns Unix timestamp in milliseconds: '20452718039105'
for example:
$filemtime = filemtime('http://www.example.com/config/config.json')

if ($filemtime < $time)
   {
    // expired
    // do something!
   }

how you implement such system is up to you!

the example shown here is not the only way to do it!
Besides the generation of the public key, R should agree with S on a method to encode the actual message text.
Now let's break the process of encrypting and decrypting the message into steps:
R needs to select two primes (see previous sections on finding primes, particularly function findPrimeRange()). Here, we'll use p = 17 and q = 31, for example.
Note that p and q must be kept secret.
But keep in mind that in real applications, this number must be at least 75 digits, depending on how secure you want your message to be.
As a rule of thumb, use a somewhat small number for your "not so important" message so that you don't consume too much processing power.
You increase the number accordingly as your message gets more sensitive.
That's why maintaining a storage device, i.e., file or database, for storing different levels of security is very crucial.
R now generates n by multiplying p and q. Such as n = 17 x 31; that is n = 527.
527 will be R's public key.
R now must calculate phi, which denoted by a Greek letter ϕ.
ϕ = (p - 1)(q - 1).
phi = (p - 1)(q - 1), which is 16 x 30 or 480.
R now chooses another number called it e (stands for encryption) which must meet these two conditions:
1. e must be between 1 and phi or 480.
2. e also must be a relative prime to phi or 480.
Remember the definition of relative prime?
To refresh your memory: A prime number is considered a relative prime to any other number if it (prime) does not divide that number. Another way of saying is that, choose a number e that is not divisible by the prime.
So e cannot divide 480. Or 480 is not divisible by e.
By the definition of relative prime, we know that the following numbers cannot divide 480: 7, 11, 13, 14, etc.
And 7, 11, 13, 14,.... must be between 1 and 480, so they all satisfy both conditions for step 4.
Notice that 14 is an even number and yet it does not divide 480. So it satisfies the definition.
Also notice that e doesn't need to be an odd number (as the even number 14 shows).
Now in real life (application) the hard part is finding e, especially if you're not math-inclined and especially when numbers must be very large as is the case when you program real RSA cryptography applications.
Basically, finding e comes down to finding a number e such as the Greatest Common Divisor (or GCD) between e and 480 is 1.
In other words, it's this equation: GCD(e, 480) = 1.
But not this equation: GCD(e, 480) = 0.
In practice, e is often chosen to be 216 + 1 = 655372, though it can be as small as 3 in some cases. In other words, do not choose e higher than 655372.
If your phi is larger than 655372, choose e between 3 and 655372 but no higher than 655372.
e will be the other half of the public key (and n is the other half).
Basically, the Greatest Common Divisor of two integers A and B is the largest integer that divides both A and B.
In other words, the Greatest Common Divisor of two integers e and 480 is the largest integer that divides both e and 480.
The Euclidean Algorithm is a technique for quickly finding the GCD of two integers.
PHP has a function to solve GCD. Check this out: Find the Greatest Common Divisor of two integers
Once you solve this equation: GCD(e, 480) = 1 using the Euclidean Algorithm to quickly find the GCD of two integers, then that is your number e for your step 4.
Please check out tutorials for the subject of Greatest Common Divisor on the Web, particularly on YouTube. It will make you a better RSA cryptosystem programmer.
Here are two of them:
The Extended Euclidean Algorithm to find the GCD of two integers The Extended Euclidean Algorithm to find the Modular Inverse of a number: How To Find The Inverse of a Number ( mod n ) - Inverses of Modular ArithmeticIn mathematic, an inverse of a number, n, is written as n-1 or 1/n.
Knowing that, we can use the Euclidean Algorithm to quickly solve the inverse of a number, say, 27, and then take a modulo of another number, say, 392.
Likewise, we can solve the inverse of a number, say, 11, and then take a modulo of another number, say, 480.
Later, I will show you how to calculate Euclidean Algorithm to find GCD(A, B) = 1.
For now let's forge on the rest of the description of the RSA algorithm.
If you look at the very beginning of this step 4, it says R needs to choose a number e. You can choose any number between 1 and 480 that does not divide 480 and it will work out just fine.
This is very easy using function findPrimeRange(1, 480) to list prime numbers between 1 and 480.
How you pick out a particular prime number from function findPrimeRange() is up to you.
However, it is very easy to do, for example, assuming prime holds the array of prime range generated by function findPrimeRange() [i.e., prime = findPrimeRange(1, 480)], you can easily pick out the array index: prime[3], prime[38], or prime[115], etc.
Let's do that now from the list: 7, 11, 13, 14, etc.
[Note: findPrimeRange() starts with prime[0] = 2, prime[1] = 3, prime[2] = 5, prime[3] = 7, prime[4] = 11]
Let's pick e = 11 for this example (or more specifically prime[4] = 11]).
The number e (11 in this case) is also part of the public key; and therefore, R will have to make it public together with n.
Make note: e and n are public keys. R can give both e and n to anyone that wants to send R messages.
So step 4 looks like this: GCD(11, 480) = 1
With the knowledge of n and e, the sender S can now prepare to send the message to R.
Let's call this message M.
It is necessary to convert the message M into a number because the RSA uses numbers to calculate the algorithm. One common conversion process uses the ASCII alphabet.
For this example, the message in our case is a single two-digit number. For example: M = 77. The ASCII code for M is 77.
It could be a file containing pages of texts, i.e.:
THE RED COATS ARE COMING! THE RED COATS ARE COMING! THE RED COATS ARE COMING!....
For more see Extended ASCII CodeT= 84,H= 72,E= 69,a space= 32,R= 82,E= 69,D= 68,C= 67,O= 79,A= 65,T= 84,S= 83,a space= 32,A= 65,R= 82,E= 69,a space= 32,C= 67,O= 79,M= 77,I= 73,N= 78,G= 71,!= 33.For example, the message (M)
THE RED COATS ARE COMING!would be encoded as847269328269686779658483326582693267797773787133.As you can see, that is an anormous large number. It is important that M < n, as otherwise the message will be lost when taken modulo n. In other words, the number
847269328269686779658483326582693267797773787133raise to any power will be too computationally intensive and the computer will go haywire on you.So if n is smaller than the message, as is often the case, it will be sent in pieces. In our example, n = 527, but our M is 77.
So it seems that we don't need to send the message character by character.
Now with n = 527 and M is 77, what else can we send? Not many characters. Try 'Me' =
7769. That is over 527.So no need to worry about M < n in this case. We'll send M as a single character.
Make note: If n is smaller than M, then S will have to send the message character by character (as our example M = 77 shows).
If you have a long string like
THE RED COATS ARE COMING!, send it one character at a time using our example (M = 77) as a guide.Use loop(s) to loop through the encryption process, encrypting one character at a time.
Likewise, on the decryption side, use loop(s) to loop through the decryption process, decrypting one character at a time.
Later, as a bonus material, I probably will show you a secret of sending long strings like
THE RED COATS ARE COMING!broken into smaller pieces (if I have time) by using loops to convert ASCII characters to its ordinal number and back to its original ASCII character.Other alternatives are to use one of the symetry encryptions like AES (Advanced Encryption Standard), DES (Data Encryption Standard), IDEA (International Data Encryption Algorithm), Blowfish (Drop-in replacement for DES or IDEA), RC4 (Rivest Cipher 4), RC5 (Rivest Cipher 5), RC6 (Rivest Cipher 6), etc.
I recommend using RC4 because it is fast and simple to use and millions of people, industries, and organizations have been using it for decades to send secure large documents. See my tutorial on RC4.
As for AES, DES, and IDEA are too overkilled for the majority of us who don't need military-grade encryption. Blowfish is also a little overkilled for the majority of our encryption tasks.
As for RC5 and RC6 are proprietary algorithms and you need to obtain permission from RSA Security to use them. That left us the RC4 as the best alternative to use.
So if you need military-grade encryption, use RSA encryption algorithm described in this tutorial, and for non-military-grade encryption, use RC4.
S now encrypts the message by appplying a sequence of mathematical operations over M that will result in the encrypted message C:
C = M e mod n, which for this example becomes:
C = 77 11 mod 527 or C = 8.
n and e are public keys.
Besides the public keys, the equation is the only information an attacker will be able to steal. Of course, you keep M as a secret, too.
To solve this equation, please check out tutorials on YouTube on Fermat's Little Theorem as well as on the subject of Greatest Common Divisor (on YouTube) listed below.
The following lists PHP's precision arithmetic functions that are suiteable for programming RSA encryption.
PHP has two functions for dealing with exponential and modulus -- the same sort of equation listed above. Please check these out:
bcpowmod() gmp_powm() to raise a number to a power with moduloIf your numbers are small enough not to cause memory overflow then using the two functions as well as other functions mentioned in this tutorial to calculate your RSA equations is fine. You have to decide of what level of security you're comfortable with your data and implement your RSA applications accordingly.
While you're at it, please check the following out as well. You probably will need to use a lot of these functions in your RSA algorithm code.
By the way, the function names listed below contain a "bc..." prefix, which stands for "basic calculator," because this precision arithmetic library extends from a GNU implementation utility interface created by Philip Nelson.
A simplier way of saying is that, the people at PHP created this precision arithmetic library by extending it from a GNU implementation utility interface created by Philip Nelson, and therefore, inheriting all of the functionalities from the parent interface.
See my other tutorial called "abstract verses interface" for more about how interfaces work.
Please note that Philip Nelson called it incorrectly as "basic calculator," but the people at PHP called it correctly as "binary calculator."
bcmod() mod() exp() pow() bcadd() bcsub() bcmul() bcdiv() bccomp() rand() array-rand() random_int()For more PHP mathematical functions check these out:
GMP Functions Mathematical Extensions Mathematical Extensions: Math_BigInteger PHP Secure Communications LibraryAs you can see from the functions above, all of these functions can handle large precision numbers, and you might be tempted to just calculate your RSA in raw fashion -- that is, calculate this equation
C = 77 11 mod 527 and this equation M = 8 131 mod 527 without breaking them down using
Euclidean Algorithm.That will cause RAM memory problems.
If you watch the tutorials on YouTube mentioned above, particularly Fermat's Little Theorem, you will hear them say that a calculator is overwhelmed by the sheer large numbers that the equation C = 77 11 mod 527 or M = 8 131 mod 527 generates. It overflows the available memory.
So you can't use the functions listed above to solve all these equations in raw form because the equations contain exponential number that is typically too large for the RAM memory to handle and it is computationally too intensive. You have to break them down into small pieces using Euclidean Algorithm or some other means.
You can use the functions listed above for a reasonably medium size exponential numbers but not for larger exponential numbers, especially exponential larger than two digits such as 723 131 and 8 631. This one is probably okay: 723 11.
Remember that an RSA key that is more than 2500 bits is very very computationally expensive even just to generate it.
It's not the functions that cause the problems -- it's the computer's memory called RAM memory that is causing the problems.
Remember that the RAM memory is like a blackboard you find in schools for teachers to write on.
You know that a blackboard does not have a lot of spaces for a teacher to write on, so a teacher has to erase the chalk so that he/she can write new materials on. The RAM memory is the same thing. It has a limited space for programs to run on.
A calculator also uses RAM memory as its chip.
So take this warming seriously and break the equations into small pieces. Use the Euclidean Algorithm and Fermat's Little Theorem techniques to solve your equations.
Having said that, with a stern warning, you can still use the precision arithmetic functions listed earlier to calculate your RSA in raw fashion if your security level doesn't need to use large exponential numbers as long as you practice a sound encryption process.
In other words, you can still use a reasonably small number (or exponential number) according to your security level and still be secured as long as you practice a sound encryption process by encoding your encryption using bases, i.e., base16, base32, base64, base92, etc.
As a matter of fact, thousands and thousands of people, industries, organizations have been using these functions in raw fashion without having to break their equations into small pieces because they practice sound encryption process, such as encoding their encryption using bases, i.e., base16, base32, base64, base92, etc.
Please see my other tutorial called Introduction to Base64 Encryption.
You can also use sample codes from 'users contributed' section of the base_convert()
Encoding your RSA encryption adds extra security and makes it very very hard to break your RSA algorithm.
See bonus materials later where you break your strings into small pieces, and at the same time, encrypt those pieces twice: one with your RSA algorithm and after that, with the base encoding process to make it very very hard to break.
Not only that, you can also wrap your encryption using RC4 algorithm as well (on top of everything else) to make it even more hard to break -- making it a triple encoded firewalls. That is a very sound encryption process that you should always practice.
Now R, after receiving the encrypted message C, must decrypt it using the secret pair of prime numbers (p and q) used to create the public key.
R must first find another number call it d (stands for decryption) such that:
e.d mod (p - 1)(q - 1) = 1.
To compute the value for d, use the Extended Euclidean Algorithm to calculate d = e-1 mod phi, also can be written as d = 1/e mod phi.
This is known as modular inversion. Note that mod is not integer division. It's a remainder division.
The modular inverse d is defined as the integer value such that ed = 1 mod phi.
It only exists if e and phi have no common factors.
In other words, d only exists if e and phi have no common factors.
Basically (in our case), find d = (1/e) mod 480.
In our case, we can substitute the above equation (e.d mod (p - 1)(q - 1) = 1) with actual values:
11.d mod 480 = 1.
In other words, compute d = (1/e) mod 480.
Or it can be written in a formal mathematic notation like this: d = (1/e) mod 480 = 1.
But we're going to use this notation to compute d = (1/e) mod 480.
Now compute the right hand side for d.
We know the value of e = 11, so compute d = (1/11) mod 480 using the following tutorial on YouTube:
How To Find The Inverse of a Number ( mod n ) - Inverses of Modular Arithmetic.An inverse of a number 11 is written as 11-1 or 1/11
Or we can just pick d that satisfy this condition: d = (1/11) mod 480 = 1.
As you maybe well aware that there are several choices for d that will work out just fine for our equation.
Again, we can quickly find some suitable candidates for d, for example: d = 131 satisfies the condition.
The problem of finding d is equivalent to finding the modular inverse of a number.
Again, please check out tutorials for the subject of Modular Inverse of a number on the Web, particularly on YouTube. It will make you a better RSA cryptosystem programmer.
PHP has a function to solve Modular Inverse of a number. Check this out:
Find the modular inverse of a GMP number (GNU Multiple Precision : For large numbers)For example:
$inverse = gmp_invert("11", "480");
echo gmp_strval($inverse) . "\n";
While you're at it, check this out as well:
Find the modular inverse of a number: See 'Users Contributed' at the bottom of that page.Here is a function to compute the modular inverse of an integer using Extended Euclidean Algorithm that mimicks the PHP's gmp_invert() above:
<?php
// function to compute the modular inverse of an integer

public function Euclidean($a, $b)
     {
      // initializing players

      $x = '1';
      $y = '0';
      $mod = $b;

      do
          {
           // first, find the remainder of dividing a by b

           $remainder = bcmod($a, $mod);

           // next, find the quotient of dividing a by b

           $q = bcdiv($a, $mod);

           // now re-arranging the players

           $a = $mod;
           $mod = $remainder;

           // now finishing up the calculation

           $remainder = bcsub($x, bcmul($y, $q));

           // now re-arranging the players again to be run through the loop again

           $x = $y;
           $y = $remainder;
          }
      while (bccomp($mod, '0'));  // while (b == '0')

      // test to see if b == '0'
      // if it is, we're finished calculating, add b to x
      // and then return x

      if (bccomp($mod, '0') < 0)
         {
          $x = bcmadd($x, $b);
         }

      return $x;
     } // end function Euclidean()

Usage:

$num = "64941057316178801556773346239351236811";

$mod = "2447995268898324993537772139997802321";

// verifying that ($num * $m) * Euclidean($num) is equal to $m

$m = "123456789";

$i = Euclidean($num, $mod);

// then test it out to see if the function works by

// verifying that ($num * $m) * Euclidean($num) is equal to $m

// you need to echo out this equation:

// echo bcmod(bcmul(bcmod(bcmul($num, $m), $mod), $i), $mod);

// if (bcmod(bcmul(bcmod(bcmul($num, $m), $mod), $i), $mod) == $m)

// if the left side equals to the right side, it works!
?>
Finally, to decode the message, R applies a sequence of mathematical operations on C as follows:
M = C d mod n, which for this example becomes:
M = 8 131 mod 527 or M = 77.
In other words, R translates M back into its original alphabet letter, retrieving the original message: M = 77.
Here is a video on YouTube on the subject of Modular Inverse of a number that explains it very well: How To Find The Inverse of a Number ( mod n ) - Using Fermat's Little Theorem.
As you can see, as long as R can keep the original two primes used to generate the public key a secret, he can be sure that messages addressed to him cannot be decoded and read or tampered with by anyone else.
So R needs to keep the original two primes a secret, but can give n and e to anyone that wants to send messages to him.
R can even give n and e to hackers (just in case if hackers want to hack messages other people sent to R).
That's it!
Just follow these eight steps just outlined and you're on your way to programming applications very secure.
This concludes the formal RSA Algorithm tutorial. What you'd learned thus far will enable you the knowledge necessary to program very secure and powerful security applications. The sky is the limit! And don't forget to thank me later!
For the rest of the materials, they are just extra (bonus) materials to help you understand RSA algorithm further.
Recap:
Let's refresh our memory again about our eight steps.
Create two prime numbers called them p and q.
p and q must be kept a secret.
Find n = p * q.
Create a function called phi = (p - 1) * (q - 1).
Find e, which stands for the encryption public key.
e must satisty two conditions:
1. 1 < e < phi
2. e must be a relative prime to phi.
The two conditions above can be easily handled using this function findPrimeRange().
For example, e = findPrimeRange(1, phi)
Prepare the message using either a character by character encoding or by other means.
Find d, which stands for the decryption private key.
d must be kept a secret.
The basic formula used to encrypt a message M is this:
C = M e mod n
where M is the plain text message and C is the resulting encrypted message.
And e will be dependent on the two initial two primes (p and q) used to generate n. Notice that e stands for encryption.
e and n are public keys and can be given to anyone that wants to send messages. You can even give them to hackers as well.
The basic formula used to decrypt a message C is this:
M = C d mod n
where d (stands for decryption) will be dependent on the two initial two primes (p and q) used to generate the public key n.
Again, d is the private key and must be kept a secret.
As you can see from the two formulas for both encryption and decryption, the syntax for both is the same; and that is, a number M or C raise to the power (e or d) and then mod n. The only difference between the two formulas is the base number (M or C) and the raise power number (e or d).
This means that you can create only one function to calculate both encryption and decryption by passing to this function the appropriate values and the function should return the correct algorithm accordingly.
For example:
/**
 * assuming $num is the number to be raised to the power $power
 * and then modulo $mod, we can write the function for both
 * encryption and decryption like this:
 */

public function rsa($num, $power, $mod)
     {
      // return the result of the calculation: M e mod n or C d mod n

      // just remember to be mindful of the concept called
      // "computationally intensive!"
     }

/**
 * Usage:
 *
 *      $encrypt = rsa($encryption_number, $power_e, $mod_n);
 *
 *      $decrypt = rsa($encrypt, $power_d, $mod_n);
 *
 * as you can see, you still call the same function, but with different values!
 */
By the way, the eight steps outlined above and the description described in this tutorial is not pertain to just PHP - it applies to other languages as well. You can implement RSA alogrithm described in this tutorial in other languages as well, such as Javascript, just to name one.
Later, I will provide Javascript precision arithmetic functions that mimick PHP's precision arithmeth functions listed earlier.
You can use most of them to do your own implementation of RSA alogrithm described in this tutorial.
Check out these videos on YouTube as well:
The RSA Encryption Algorithm (1 of 2: Computing an Example) The RSA Encryption Algorithm (2 of 2: Generating the Keys) The RSA Encryption Algorithm: Public Key Crypto with RSA)Check out the Public-Key Cryptography Standards (PKCS):
The RSA Encryption Algorithm: Public-Key Cryptography Standards (PKCS)Now that you know an extensive detail about RSA Algorithm, you can use that knowledge to program very powerful and secure applications on your own.
However, as is always the case, there are lots of third-party tools out there that you can use to make your life easier. For example, to generate the public and private keys, you can use a tool called OpenSSL.
Please Google it.
See my other tutorial called Introduction to OpenSSL.
OpenSSL is a very popular tool that is widely being used all over the world. OpenSSL uses the RSA Algorithm that just outlined in this tutorial to generate both public and private keys and as well as certificates.
There are countless tools out there that use RSA Algorithm to make your life easier so that you don't have to do the hard math yourself. Check this out:
PHP Secure Communications LibraryFor your information: Nowaday, the RSA Algorithm is not the only algorithm available out there. There are plenty of algorithms out there available for your use. To list just a few, here they are: AES, DES, Blowfish, RC6 (an extension of Rc4), Rijndael, Serpent, MARS.
Please Google them.
Advanced Encryption StandardAdvanced Encryption Standard (AES) is a symmetric block cipher chosen by the U.S. government to protect classified information. AES is implemented in software and hardware throughout the world to encrypt sensitive data. It is essential for government computer security, cybersecurity and electronic data protection.
Symmetric, also known as secret key, ciphers use the same key for encrypting and decrypting, so the sender and the receiver must both know -- and use -- the same secret key.
The National Institute of Standards and Technology (NIST) started development of AES in 1997 when it announced the need for an alternative to the Data Encryption Standard (DES), which was starting to become vulnerable to brute-force attacks.
Blowfish is an encryption technique designed by Bruce Schneier in 1993 as an alternative to DES Encryption Technique. It is significantly faster than DES and provides a good encryption rate with no effective cryptanalysis technique found to date. It is one of the first, secure block cyphers not subject to any patents and hence freely available for anyone to use.
RC6 is a derivative of RC5 (and RC5 is a derivative of RC4) and is a block cipher designed for RSA Security. RC6 uses four working block size registers in its algorithmic computations, whereas RC5 uses only two. Thus, RC6 is faster. RC6 was designed as part of the Advanced Encryption Standard (AES) competition, where it was a finalist. It is a propriety algorithm patented by RSA Security.
So to use the RC5 or RC6, you have to obtain a permission for their uses. However, the RC4 is not patented and is freely available for anyone to use.
Rijndael (pronounced rain-dahl) is the algorithm that has been selected by the U.S. National Institute of Standards.
Rijndael is a symmetric key encryption algorithm that's constructed as a block cipher. It supports key sizes of 128, 192 and 256 bits, with data handling taking place in 128-bit blocks. In addition, the block sizes can mirror those of their respective keys.
The Rijndael Block Cipher - NIST Computer SecurityRSA Algorithm Arithmetic
As stated earlier, to create a good implementation of the RSA algorithm, you need three things, which were listed earlier.
One of the three things is that, you need to do a precision arithmetic (actually multiple precision arithmetics).
Feel free to skip this RSA Algorithm Arithmetic section and jump to the RSA Algorithm Implementation section ahead to see the actual implementation of the RSA algorithm using what w've learned thus far, plus using the upcoming RSA algorithm arithmetic as well.
Okay, let's touch bases on some of the arithmetics involved in the RSA algorithm using precision arithmetics.
As you may already know, the PHP functions listed above is enough for calculating precision RSA Algorithm Arithmetic. But sometimes, you need Javascript precision arithmetics as well. The following are Javascript functions that mimic the behaviors of PHP precision arithmetic functions listed above.
/**
 * initilize cryptography functions of the specified bits
 *
 * function initcrypt(bit)
 *     {
 *      if (bit != 0)
 *         {
 *          setTimeout(('sendinit(' + bit + ')'), 200);
 *         }
 *     }
 *
 * returns a to the power of b mod c
 *
 * Ah.... this function needs a refinement!
 *
 * Usage:
 *
 * function sendinit(bit)
 *     {
 *      rc4key = rand(0, 9) + rand(0, 9) + rand(0, 9) + rand(0, 9) +
 *               rand(0, 9) + rand(0, 9) + rand(0, 9) + rand(0, 9);
 *
 *      while (rc4key.length + 8 <= RSAmodulok.length - 3)
 *          {
 *           rc4key += (rand(0, 9) + rand(0, 9) + rand(0, 9) + rand(0, 9) +
 *                      rand(0, 9) + rand(0, 9) + rand(0, 9) + rand(0, 9));
 *          }
 *
 *      ibPowmodInPart(rc4key, RSApublick, RSAmodulok, '1', 0);
 *     }
 *
 */

function ibPowmodInPart(a, b, c, r, i)
    {
     // RSA encryption is broken up into parts
     // because it is computationally expensive
     r = ibmod(ibmul(r, a), c);
     i++;
     if ( i < parseInt(b))
        {
         var h = 'ibPowmodInPart("' + a + '", "' + b + '", "' +
                                  c + '", "' + r + '", "' + i + '")';
         setTimeout(h, 500);
        }
     else
        {
         return r; // returns the results to caller
        }
    }

// Integer Binary Math library

// returns 0 on equel, 1 on a > b, -1 on a < b
// in other words, it returns true if a > b
function ibgreater(a, b)
    {
     a = a + '';
     b = b + '';
     if (a.length > b.length)
        {
         return 1;
        }

     if (a.length < b.length)
        {
         return -1;
        }

     var i = 0;

     while (a.charAt(i) == b.charAt(i) && i < a.length)
         {
          i++;
         }

     if (i == a.length)
        {
         return 0;
        }

     if (a.charAt( i) > b.charAt(i))
        {
         return 1;
        }
     else
        {
         return -1;
        }
    }

// returns a + b
function  ibadd( a, b)
    {
     a = a + '';
     b = b + '';
     var l = a.length;
     while (b.length < l)
         {
          b = '0' + b;
         }

     if (b.length > l)
        {
         l = b.length;
        }

     while (a.length < l)
         {
          a = '0' + a;
         }

     l--;
     var c = 0;
     var r = '';
     for (var i = l; i > = 0; i--)
         {
          c = c + parseInt(a.charAt(i)) + parseInt(b.charAt(i));
          if (c > 9)
             {
              c = c - 10;
              r = '' + c + r;
              c = 1;
             }
          else
             {
              r = '' + c + r;
              c = 0;
             }
         }
     if (c == 1)
        {
         r = '' + c + r;
        }

     while (r.charAt(0) == '0' && r.length > 1)
         {
          r = r.substring(1);
         }
     return r;
    }

function  ibsub(a, b)
    {
     // returns a - b or NV9999. . . if b > a
     a = a + '';
     b = b + '';
     var r = '';
     var l = a.length;
     while (b.length < l)
         {
          b = '0' + b;
         }

     if (b.length > l)
        {
         l = b.length;
        }

     while (a.length < l)
         {
          a = '0' + a;
         }

     l--;
     var c = 0;
     var r = '';
     for (var i = l; i >= 0; i--)
         {
          c = parseInt(a.charAt(i)) - parseInt(b.charAt(i)) - c;
          if (c < 0)
             {
              c = c + 10;
              r = c + r;
              c = 1;
             }
          else
             {
              r = c + r;
              c = 0;
             }
         }

     while (r.charAt(0) == '0' && r.length > 1)
         {
          r = r.substring(1);
         }

     if (c == 1)
        {
         r = 'NV' + r;
        }
     return r;
    }

// returns a * b
function ibmul(a, b)
    {
     a = a + '';
     b = b + '';
     var v = [a];
     var vr = [1];
     var i = 0;

     while (ibgreater(b, vr[i]) != -1)
         {
          v[i + 1] = ibadd( v[i], v[i]);
          vr[i + 1]= ibadd( vr[i], vr[i]);
          i++;
         }

     var r = '0';
     var d = b;

     for (var i = v.length - 1; i >= 0; i--)
         {
          if (ibsgreater(d, vr[i]) != -1)
             {
              r = ibadd(r, v[i]);
              d = ibsub(d, vr[i]);
             }
         }
     return r;
    }

// returns a / b
function ibdiv(a, b)
    {
     a = a + '';
     b = b + '';

     if (ibgreater(b, '0') == 0)
        {
         return 'NV';
        }

     if (ibgreater(a, b) == -1)
        {
         return '0';
        }

     if ( ibgreater(a,  ibadd(b, b)) == -1)
        {
         return '1';
        }

     var r = 0;
     var d = a;
     var v = [b];
     var vr = [1];
     var i = 0;
     var t = '';

     while (ibgreater(d, v[i]) == 1)
         {
          v[i + 1] = ibadd(v[i], v[i]);
          vr[i + 1] = ibadd(vr[i], vr[i]);
          i++;
         }

     for (var i = v.length - 1; i >= 0; i--)
         {
          if (ibgreater(d, v[i]) != -1)
             {
              d = ibsub(d, v[i]);
              r = ibadd(r, vr[i]);
             }
         }
     return r;
    }

// returns a mod b
function ibmod(a, b)
    {
     //return ibsub(a, ibmul(b, ibdiv(a, b)));
     a = a + '';
     b = b + '';

     if (ibgreater(b, '0') == 0)
        {
         return 'NV';
        }

     if (ibgreater(a, b) == -1)
        {
         return a;
        }

     var r = 0;
     var d = a;
     var v = [b];
     var vr = [1];
     var i = 0;
     var t = '';

     while (ibgreater(d, v[i]) == 1)
         {
          v[i + 1] = ibadd(v[i], v[i]);
          vr[i + 1] = ibadd(vr[i], vr[i]);
          i++;
         }

     for ( var i = v.length - 1; i >= 0; i--)
         {
          if (ibgreater(d, v[i]) != -1)
             {
              d = ibsub(d, v[i]);
              r = ibadd(r, vr[i]);
         }
     }
     return d;
    }

// raise a to power b
function ibpow(a, b)
    {
     a = a + '';
     b = b + '';
     var v = [a];
     var vr = [1];
     var i = 0;

     while (ibgreater(b, vr[i]) != -1)
         {
          v[i + 1] = ibmul(v[i], v[i]);
          vr[i + 1] = ibadd(vr[i], vr[i]);
          i++;
         }

     var r = '1';
     var d = b;

     for (var i = v.length - 1; i >= 0; i--)
         {
          if (ibgreater(d, vr[i]) != -1)
             {
              r = ibbmul(r, v[i]);
              d = ibsub(d, vr[i]);
             }
         }
     return r;
    }

// small power mod
function ibpowmod(a, b, c)
    {
     a = a + '';
     b = b + '';
     c = c + '';
     var r = '1';

     for (var i = 0; i < parseInt(b); i++)
         {
          r = ibmod(ibmul(r, a), c);
         }
     return r;
    }


Here are two Javascript functions to find the GCD
of two integers a and b:

This one uses while loop to achieve the result:

function gcd(a, b)
     {
      var r;

      while ((a % b) > 0)
          {
           r = a % b;
           a = b;
           b = r;
          }

      return b;
     }

This one uses recursive calls to achieve the result:

function gcd(a, b)
     {
      if (b == 0)
         {
          return a;
         }
      else
         {
          return gcd(b, (a % b));
         }
     }
Next up is the Greatest Common Divisor.
Okay, let's go over the Greatest Common Divisor involved in the RSA algorithm.
Warning This tutorial is very confusing and complex. So please use tutorials on YouTube instead.
The Euclidean Algorithm for finding GCD(A, B) is as follows:
- If A = 0 then GCD(A, B) = B, since the GCD(0, B) = B, and we can stop.
- If B = 0 then GCD(A, B) = A, since the GCD(A, 0) = A, and we can stop.
The above illustration can be written in code like this:
<?php // if everything divides 0 if ($a == 0 || $b == 0) { return 0; } ?>- Write A in quotient remainder form (A = B.Q + R)
- Find GCD(B, R) using the Euclidean Algorithm since GCD(A, B) = GCD(B, R)
Example:
Find the GCD of 270 and 192
Or as an equation: GCD(270, 192) = 1
- A = 270, B = 192
- A ≠ 0
- B ≠ 0
Another way of illustration for the above case can be written in code like this:
<?php function Euclidean($a, $b) { // you know from basic math: any number divides 0 is 0 if ($a == 0 || $b == 0) { return 0; } } ?>- Use long division to find that 270/192 = 1
with a remainder of 78.
This is in keeping up with the form A = B.Q + R,
with Q is the quotient from dividing A by B and R is the remainder.
In other words, if you divide 270 by 192, it will
result in the quotient of 1 and with the remainder of 78.
We can write this as: 270 = 192 * 1 + 78
Now we can continue on to the next line to form a new equation by moving the right side
greatest common divisor number 192 to the left side of the equation and
following this form A = B.Q + R again. For example:
192 = 78 * ? + ?
Notice that the question marks '?' represent quotient and remainder, respectively. - In other words, find GCD(192, 78), since GCD(270, 192) = GCD(192, 78)
Again, we can write it as an equation: GCD(192, 78) = 1
And we can continue on until GCD(192, 78) = 0, as you can see from the following pattern.
A = 192, B = 78
- A ≠ 0
- B ≠ 0
- Use long division to find that 192/78 = 2
with a remainder of 36.
We can write this as:
- 192 = 78 * 2 + 36
- Find GCD(78, 36), since GCD(192, 78) = GCD(78, 36)
A = 78, B = 36
- A ≠ 0
- B ≠ 0
- Use long division to find that 78/36 = 2
with a remainder of 6.
We can write this as: - 78 = 36 * 2 + 6
- Find GCD(36, 6), since GCD(78, 36) = GCD(36, 6)
A = 36, B = 6
- A ≠ 0
- B ≠ 0
- Use long division to find that 36/6 = 6
with a remainder of 0.
When a remainder is equal to 0, we can stop the process.
However, for the sake of completeness, we'll complete the process to the end.
We can write this as: - 36 = 6 * 6 + 0
- Find GCD(6, 0), since GCD(36, 6) = GCD(6, 0)
A = 6, B = 0
- A ≠ 0
- B = 0, GCD(6, 0) = 6
So we have shown that:
GCD(270, 192) = GCD(192, 78) = GCD(78, 36) = GCD(36, 6) = GCD(6, 0) = 6
So we found the final answer to be: 6.
Or more specifically:
GCD(270, 192) = 6
That's it!
Understanding the Euclidean Algorithm
If we examine the Euclidean Algorithm we can see that it makes use of the following properties:
- GCD(A, 0) = A
- GCD(0, B) = B
- If A = B.Q + R and B ≠ 0 then GCD(A, B) = GCD(B, R)
where Q is an integer,
R is an integer between 0 and B - 1
The first two properties let us find the GCD if either number is 0.
That's why at the begining of this Euclidean Algorithm, we point out these two cases to solve:
- If A = 0 then GCD(A, B) = B, since the GCD(0, B) = B, and we can stop.
- If B = 0 then GCD(A, B) = A, since the GCD(A, 0) = A, and we can stop.
The above illustration can be written in code like this:
<?php
// if everything divides 0
if ($a == 0 || $b == 0)
   {
    return 0;
   }

?>
The third property lets us take a larger,
more difficult to solve problem,
and reduce it to a smaller,
easier to solve problem.
This third property is the lengthy process we just did.
And we got the answer to be 6.
The Euclidean Algorithm makes use ofthese properties by rapidly reducing the
problem into easier and easier problems,
using the third property,
until it is easily solved by using one of the
first two properties.
We can understand why these properties work by proving them.
We can prove that GCD(A, 0) = A is as follows:
- The largest integer that can evenly divide A is A.
- All integers evenly divide 0, since for any integer, C,
we can write (using dot notation) C . 0 = 0.
So we can conclude that A must evenly divide 0. - The greatest number that divides both A and 0 is A.
The proof for GCD(0, B) = B is similar.
(Same proof, but we replace A with B).
To prove that GCD(A, B) = GCD(B, R) we first need to
show that GCD(A, B) = GCD(B, A - B).
Suppose we have three integers A, B and C such that A - B = C.
Proof that the GCD(A, B) evenly divides C
The GCD(A, B), by definition, evenly divides A.
As a result, A must be some multiple of GCD(A, B).
i.e. X.GCD(A, B) = A where X is some integer.
The GCD(A, B), by definition, evenly divides B.
As a result, B must be some multiple of GCD(A, B).
i.e. Y.GCD(A, B) = B where Y is some integer.
A - B = C gives us:
- X.GCD(A, B) - Y.GCD(A ,B) = C
- (X - Y).GCD(A, B) = C
So we can see that GCD(A, B) evenly divides C.
An illustration of this proof is shown in
the left portion of the figure below:
Proof that the GCD(B, C) evenly divides A
The GCD(B, C), by definition, evenly divides B.
As a result, B must be some multiple of GCD(B, C).
i.e. M.GCD(B, C) = B where M is some integer.
The GCD(B, C), by definition, evenly divides C.
As a result, C must be some multiple of GCD(B, C).
i.e. N.GCD(B, C) = C where N is some integer.
A - B = C gives us:
- B + C = A
- M.GCD(B, C) + N.GCD(B, C) = A
- (M + N).GCD(B, C) = A
So we can see that GCD(B, C) evenly divides A.
An illustration of this proof is shown in the figure below
Proof that GCD(A, B) = GCD(A, A - B)
- GCD(A, B) by definition, evenly divides B.
- We proved that GCD(A, B) evenly divides C.
- Since the GCD(A, B) divides both B and C evenly it is
a common divisor of B and C.
GCD(A, B) must be less than or equal to, GCD(B, C), because
GCD(B, C) is the "greatest" common divisor of B and C.
- GCD(B, C) by definition, evenly divides B.
- We proved that GCD(B, C) evenly divides A.
- Since the GCD(B, C) divides both A and B evenly it is
a common divisor of A and B.
GCD(B, C) must be less than or equal to, GCD(A, B), because
GCD(A, B) is the "greatest" common divisor of A and B.
Given that GCD(A, B) = GCD(B, C) and
GCD(B, C) = GCD(A, B) we can conclude that:
GCD(A, B) = GCD(B, C)
Which is equivalent to:
GCD(A, B) = GCD(B, A - B)
An illustration of this proof is shown in the
right portion of the figure below.
Proof that GCD(A, B) = GCD(B, R)
We proved that GCD(A, B) = GCD(B, A - B)
The order of the terms does not matter so we can
say GCD(A, B) = GCD(A - B, B)
We can repeatedly apply GCD(A, B) = GCD(A - B, B) to obtain:
GCD(A, B) = GCD(A - B, B) = GCD(A - 2B, B) = GCD(A - 3B, B) = ... = GCD(A - Q.B, B)
But A = B.Q + R so A - Q.B = R
Thus GCD(A, B) = GCD(R, B)
The order of terms does not matter, thus:
GCD(A, B) = GCD(B, R)
Quiz: Find the GCD
Question: Find gcd(421, 111).
Answer:
We use the Euclidean algorithm as follows:
this is basically using the form: A = B.Q + R,

with Q is the quotient from dividing A by B and R is the remainder.


421 = 111 x 3 + 88    larger number on left (i.e. 421). if B is larger, then put B on left

111 = 88 x 1 + 23     shift left by moving B to the left and shift R in place of B

88 = 23 x 3 + 19      note how 19 moves down "diagonally" all the way to the left side

23 =  19 x 1 + 4

19 = 4 x 4 + 3

4 = 3 x 1 + 1          last non-zero remainder is 1 <--- this is our answer in this case

3 = 1 x 3 + 0
The last non-zero remainder is 1 and therefore gcd(421, 111) = 1.
Notice that it could be any number other than 1. It just happens that this equation turns out to be 1.
The thing to remember is that, once your equation resulted in a remainder of zero, then stop and use the last non-zero remainder as your final answer.
The GCD Implementation using PHP
Now that we know how GCD works, let's put it into code.
This code still haven't solve the "computationally intensive" problem when you have large exponential numbers.
In that case, you still have to break it down into small pieces.
Hopefully, this code example below will give you enough idea to proceed to program RSA encryption that is very secure using large exponential numbers.
<?php
/**
 * PHP program to find modular inverse of a
 * under modulo m using Fermat's little theorem.
 * This program works only if m is prime.
 *
 * See function modInverse() below that makes use of this gcd() function
 *
 * Usage:
 *
 * $a = 3; $m = 11;
 * modInverse($a, $m);
 *
 * To compute x raised to the
 * power of y under modulo m
 *
 * See function modInverse() below that makes use of this gcd() function
 *
 * Recursive function to
 * return gcd of a and b
 */

public function gcd($a, $b)
     {
      /**
       * anything that divide 0 is equal to 0
       * make note: not divide by zero, which is undefined
       *
       * 0/30 = 0, 0/-1 = 0, 0/5 = 0
       *
       * so the equation GCD(0, B) = 0
       * so the equation GCD(A, 0) = 0
       */

      if ($a == 0 || $b == 0)
         {
          return 0;
         }

      // if both are the same, return either one of them
      if ($a == $b)
         {
          return $a;
         }

      // if a is greater
      if ($a > $b)
         {
          /**
           * continue to recursively call itself if $a > $b
           *
           * remember the equation GCD(A, B) = 1 ?
           *
           * for example: GCD(270, 192) = 1
           */
          return gcd($a - $b, $b);
         }

      /**
       * or else continue to recursively call itself if $a < $b
       */
      return gcd($a, $b - $a);
     }

Here is a much faster function to do the same thing as above:

public function gcd($a, $b)
     {
      return $b ? gcd($b, $a % $b) : $a;
     }

// Function to find modular
// inverse of a under modulo m
// Assumption: m is prime
public function modInverse($a, $m)
     {
      if (gcd($a, $m) != 1)
         {
          // echo "Inverse doesn't exist";
          return null;
         }
      else
         {
          // If a and m are relatively prime,
          // then modulo inverse is
          // a(m - 2) mode m
          // echo "Modular multiplicative inverse is ",
          //                   power($a, $m - 2, $m);

          return power($a, $m - 2, $m);
         }
     }

// To compute xy under modulo m
public function power($x, $y, $m)
     {
      if ($y == 0)
         {
          return 1;
         }

      $p = power($x, $y / 2, $m) % $m;
      $p = ($p * $p) % $m;

      return ($y % 2 == 0) ? $p : ($x * $p) % $m;
     }

// here is a function (largePrecisionPowMod()) to mimick PHP's bcpowmod()
// for any exponent greater than a few tens of thousands,
// you can use this function!

// as you can see, this function uses PHP's bcpowmod() if it is available
// if you don't want to use PHP's bcpowmod() just comment out the "if" statement block!

public function largePrecisionPowMod($base, $power, $modulus)
     {
      // check if PHP's bcpowmod() is available
      // if it is available, use it!

      if (function_exists("bcpowmod"))
         {
          return bcpowmod($base, $power, $modulus);
         }

      // start with 1
      $result = "1";

      // loop until the exponent is reduced to zero
      while (TRUE)
          {
           if (bcmod($power, 2) == "1")
              {
               $result = bcmod(bcmul($result, $base), $modulus);
              }

           // when the exponent is reduced to zero, we exit the loop
           // and return $result

           if (($power = bcdiv($power, 2)) == "0")
              {
               break;
              }

           $base = bcmod(bcmul($base, $base), $modulus);
          } // end while

      return ($result);
     }
?>
Earlier, I mentioned about converting text to its ordinal number so that it can be used in the RSA algorithm.
So here, I want to share a secret with you all that no one will never bother to tell you about. But I will!
Here is one way to do it.
Remember that the encryption/decryption formulas given earlier work with exponential numbers (or powers), and when working with RSA applications often require you to work with large numbers to make RSA application more secure. The following is an attempt to reduce the numbers to a more manageable so that we can use them in the encryption/decryption formulas given earlier.
The most frequently used method of code is the ordinal number of the ASSCII code and it can be very large given how long your text message you want to encrypt.
If you have a long string like THE RED COATS ARE COMING! (or longer), you can format the long string by breaking it down into small pieces.
Remember M = 77 example shown earlier?
Well, you can think of each small piece as M or 77.
But each small piece will contain a much larger number than the two-digit M has.
Refer to the code below where we have a variable called $result which basically holds a sum of the products of all of the characters: THE RED COATS ARE COMING! by multiplying each of its ordinal numbers (847269328269686779658483326582693267797773787133) together and add them all together to make it much and much smaller than the actual ordinal numbers listed here.
So this is the secret: create a 'sum of the products of all of the ordinal character numbers to make it much and much smaller to be used in the RSA encryption/decryption formulas given earlier.' See the code below.
Now the code below assumes the long string of THE RED COATS ARE COMING! as one piece.
If you have longer string, you can break it down using PHP's function str_split() to split your long string into pieces, and then use loops to loop through the code shown below. You can think of variable $string (below) as one of the pieces broken down by str_split().
When breaking your long string into pieces using str_split(), be mindful of the concept computationally intensive, because your 'sum of the products of all of the ordinal character numbers' in each piece can be large as well.
Not only that, you will have to raise your 'sum of the products of all of the ordinal character numbers' in each piece to the power of your number e or d.
Let's see the code that converts regular piece of string into the sum of all the products of their ordinal numbers. In other words, let's make each piece of the long string to look like M or 77.
// turn regular text into a number that can be manipulated by the RSA algorithm
// in other words, let's turn regular text's ordinal numbers into a smaller number,
// particularly the exponential numbers, that can be used and manipulated by the RSA algorithm

// variable $string is just one piece for this example
// in a real application, variable $string could contain a very long text or pages of document
// but you'll have to break it (variable $string) into pieces and loop it through the pieces
// one way to do it is to create a function and put this snippet of code in it and pass in
// the variable $string as one piece and return it back to your application and then
// make another call to your function again and repeat this same process until you're done!
// self-explanatory!

$string = 'THE RED COATS ARE COMING!';

$result = '0';
$n = strlen($string); // n is 25

while ($n > 0)
    {
     // reduce $n by 1 to 24, so $string[24] = !
     // remember that $string[0] = T, $string[1] = H, $string[2] = E,
     //                                               $string[3] = a space

     --$n;


     // $result is analogous to the message 'M' described in this tutorial!

     // $result basically holds a sum of the products of all of these characters:
     // THE RED COATS ARE COMING! by multiplying each of its ordinal numbers
     // by 256 and add them all together as well
     // notice that the ASCII values only go up to 256 in total

     // as you can see, we work from the end of the string ($string[24] = !) and then
     // work our way toward the beginning of the string: $string[0] = T
     $result = bcadd(bcmul($result, '256'), ord($string[$n]));// ASCII values only go up to 256
    } // end while

// the above while loop converts THE RED COATS ARE COMING! to
// 847269328269686779658483326582693267797773787133 and then
// sum all of the products of all their ordinal numbers to make the number
// smaller that can be used and manipulated by the RSA algorithm

// you might want to encode $result with base: 16, 32, 64, etc.

echo $result;
As far as using these ordinal numbers in the RSA algorithm is concern, you might want to wrap this while loop (above) in your RSA algorithm process described in this tutorial.
For extra security, you might want to encode each piece of your RSA algorithm above using bases of your choice, for example: base 16, base32, base64, base92, etc, to make your RSA algorithm even more secure and robust.
Please see my other tutorial called Introduction to Base64 Encryption.
You can also use sample codes from 'users contributed' section of the base_convert()
Likewise, you can convert the ordinal number to its original ASCII character after you decrypted your message using RSA algorithm described in this tutorial.
Here is one way to do it:
// turn the numeric representation of text back to its original ASCII text after
// it has been manipulated by the RSA algorithm

// variable $num is just one piece for this example
// in a real application, you might need to create a function and put this snippet of code
// in it and pass in the variable $num as an argument containing just one piece of the string
// and return it back to your application and then make another call to your function again
// and repeat this same process until you're done!

// in other words, break your string into small pieces and pass them one by one as $num
// actually, $num is the result calculated in the previous example containing in the variable $result
// so use the result in variable $result from the previous example as $num
// self-explanatory!

$num = 847269328269686779658483326582693267797773787133;

// as noted above, $num does not contain ordinal numbers
// it contains the sum of products of ordinal numbers. so make not of that!

// again, $num contains the value found in the variable $result from
// the previous example!

// so $num = $result

$result = ''; // initialize $result to null

do
    {
     // $result will hold the original message 'THE RED COATS ARE COMING!'

     $result .= chr(bcmod($num, '256')); // ASCII values only go up to 256

     $num = bcdiv($num, '256');
    }
while (bccomp($num, '0'));

// the above while loop converts 'the sum of products of ordinal numbers'

// back to:

// THE RED COATS ARE COMING!

// don't forget to decode $result if you encoded it!

echo $result;
There you have it!
My secret to encrypt long strings (or pages of document!)
You might have to tweek the code above a little bit to suit your objective, like breaking down your long string using str_split() and loop through each piece using the above two code examples as guide.
Hopefully, the two code illustrations above will help you implement your own robust and secure RSA applications containing large documents.
The sky is the limit!
And don't forget to thank me later!
RSA Algorithm Implementation
Now that we thoroughly covered all of the theoretical bases, it's time to create our own implementation of the RSA algorithm. Don't forget to make use of PHP precision arithmetic functions (bc...) listed earlier.
There are seven functions that we need to write. For example:
First, you could use PHP function gmp_nextprime() to generate a list of prime numbers. For example:
<?php
/**
 * mimicking a random prime number generator
 *
 * Usage:
 *      $prime = generatePrime(100);
 *
 * for() loop will loop through 100 times and generates 100 prime numbers
 */

public function generatePrime($n)
     {
      for ($i = 0; $i < $n; $i++)
          {
           // you can make the range as wide or narrow as you want!
           // or as large or small as you want!

           $j = rand(100, 200000);

           // function gmp_nextprime() returns the next prime number after $j

           $prime = gmp_nextprime($j);

           try
               {
                // assuming $conn is a PDO object!

                $stmt = $conn->prepare("INSERT INTO primetable (prime)
                                        VALUES (?) ");

                // execute the place holder ?

                $stmt->execute($prime);
               }
           catch (PDOException $e)
               {
                echo 'ERROR: Cannot insert data into the database: ' . $e->getMessage();
               }
          } // end for()
    } // end generatePrime()
?>
Next, retrieve the prior generated prime numbers from the database.
<?php
/**
 * when you need random prime numbers, just retrieve them from
 * the storage device you created before hand
 */

public function getKey()
     {
      // retrieve prime numbers from a storage device
      // and place them in an array, for example:

      $prime = array();

      try
          {
           // assumming $conn is an instance of a PDO

           $stmt = $conn->prepare("SELECT prime FROM primetable");

           /**
            * retrieve prime numbers from the database
            * and place them in an array variable: $prime
            */

           $prime = $stmt->execute();
          }
      catch (PDOException $e)
          {
           echo 'ERROR: Cannot select data from the database: ' . $e->getMessage();
          }

      // mimicking a random prime number generator

      // this example assumes we're working with
      // 201 prime numbers: 0 to 200

      do
          {
           $i = rand(0, 200);
           $j = rand(0, 200);

           $p = prime[$i];
           $q = prime[$j];
          }
      while ($p == $q) // if p == q, keep looking!

      // when p and q are distinct, we stop looking and keep them!

      // remember that p and q are secret keys; and therefore,
      // they need to be encrypted and stored in a secure medium
      // use rc4 to encrypt these keys and store them in a secure medium

      $data = [
               "p" => $p,
               "q" => $q,
               "date" => date("d-m-Y H:i:s") /* displays: 2016-04-26 20:01:04 */
              ];

      try
          {
           $stmt = $conn->prepare("INSERT INTO keytable (p, q, date)
                                           VALUES (?, ?, ?) ");

           /**
            * $data contains three items: p, q, date.
            * execute the place holder ? ? ?
            */

           $stmt->execute($data);
          }
      catch (PDOException $e)
          {
           echo 'ERROR: Cannot insert data into the database: ' . $e->getMessage();
          }

      return $data;
     } // end getKey()
?>
Next, generate the two prime numbers (p, q) needed to be used in the RSA algorithm. I prefer this (below) function as appose to the one above, because all you need is just two primes and not a whole database of prime numbers.
For some scenarios, the above function will serve you well -- say, you have some records that you want to encrypt and decrypt it later. Have your keys stored in a database is a "MUST" -- otherwise, your data are useless if you don't store your keys for a later retrieval and use them later. So storing your prime numbers and keys are not useless (nor bad ideas) -- in fact, they are part of the sound encryption practice.
<?php
/**
 * mimicking a random prime number generator
 *
 * Usage:
 *      $prime = generateTwoPrime(20000);
 *
 * make $this->prime an array of 2 primes under 20,000
 * meaning that the 2 prime numbers can range anywhere from 2 to 20,000 in strength
 * remember that the larger the number the stronger the encryption algorithm
 * so in theory both p and q could be as small as 2 and as large as 20,000
 */

public function generateTwoPrime($n)
     {
      //

      $prime = [];

      // mimicking a random prime number generator

      // this example assumes we're working with
      // number range: 0 to 20,000 ($n) but we only want two prime numbers out of 20,000
      // that is a very large range to choose from

      $i = 0;
      $j = 0;

      do
          {
           $i = rand(0, $n);
           $j = rand(0, $n);

           // function gmp_nextprime() returns the next prime number after $i or $j
           $p = gmp_nextprime($i);
           $q = gmp_nextprime($j);
          }
      // if p == q and  ($p < 100 && $q < 100), keep looking because we don't want the two primes that are the same and less than 100!
      while (($p == $q) && ($p < 100 || $q < 100));

      // if p and q are distinct, and also they are bigger than 100, we keep them as our two primes
      $prime = [$p, $q];

      return $prime;
     } // end generateTwoPrime()
?>
Next, get the public key e.
<?php
/**
 * Using step 4 instruction to find a random relative prime number e: a public key e
 *
 * Usage:
 *
 *      $prime = generateTwoPrime(200000);
 *
 *      // find e by passing prime numbers p and q
 *      $relativePrime = getE($prime[0], $prime[1]);
 *
 * make $relativePrime relative prime number bigger than 1 and less than phi (or 480 in the example shown in the tutorial step 4)
 *
 * This is basically performing step 4 by choosing a number e, for example:
 * now I have to pick a number e (for step 4) that meets this conditions: 1 < e < $phi
 */

public function getE($p, $q)
     {
      // Find phi
      $phi = bcmul(bcsub($p, 1), bcsub($q, 1));

      // mimicking a random relative prime number generator that meets this conditions: 1 < e < $phi

      $i = 0;

      do
          {
           // since random() includes both starting and ending numbers, we need to start from 2 and end with $phi - 1
           // in other words, generate a random relative prime number that meets this conditions: 1 < e < $phi
           // this is performing step 4 by choosing a number e
           $i = rand(2, $phi - 1);

           // function gmp_nextprime() returns the next prime number after $i
           $e = gmp_nextprime($i);
           $mod = bcmod($phi, $e); // find the remainder by dividing $phi by $e
          }
      // if $phi mod $e == 0, it is not a relative prime, and therefore, just keep looking for the relative prime number until we find one
      while ($mod == 0);

      // when $phi mod $e != 0, then it is a relative prime

      $relativePrime = $e;

      return $relativePrime;
    } // end getE()
?>
There are so many ways to achieve the same result as the one shown above, and here is another way to do it to get the same result and get the public key e.
<?php
/**
 * Using step 4 instruction to find a random relative prime number e: a public key e
 *
 * Usage:
 *
 *      $prime = generateTwoPrime(200000);
 *
 *      // find e by passing prime numbers p and q
 *      $relativePrime = getE($prime[0], $prime[1]);
 *
 * make $relativePrime relative prime number bigger than 1 and less than phi (or 480 in the example shown in the tutorial step 4)
 *
 * This is basically performing step 4 by choosing a number e, for example:
 * now I have to pick a number e (for step 4) that meets this conditions: 1 < e < $phi
 */

public function getE($p, $q)
     {
      // Find phi
      $phi = bcmul(bcsub($p, 1), bcsub($q, 1));

      // mimicking a random relative prime number generator that meets this conditions: 1 < e < $phi

      $random = 0;

      do
          {
           // this is basically performing step 4 by choosing a number e that meets this conditions: 1 < e < $phi
           // since random() includes both starting and ending numbers, we need to start from 2 and end with $phi - 1
           // in other words, generate a random relative prime number e that meets this conditions: 1 < e < $phi

           $random = rand(2, $phi - 1);

           // this time we'll use PHP's function gmp_prob_prime()
           // if this function returns 0, $random is definitely not prime
           // if it returns 1, then $random is "probably" prime
           // if it returns 2, then $random is surely prime

           $num = gmp_prop_prime($random);

           if ($num == 2)
              {
               // $random is definitely a prime
               $e = $random;
              }
           else
              {
               continue;
              }

           $mod = bcmod($phi, $e); // find the remainder by dividing $phi by $e
          }
      // if $phi mod $e == 0, it is not a relative prime, and therefore, just keep looking for the relative prime number until we find one
      while ($mod == 0);

      // when $phi mod $e != 0, then it is a relative prime

      $relativePrime = $e;

      return $relativePrime;
    } // end getE()
?>
Next, calculate the Extended Euclidian Algorithm to find the private key d.
<?php
/**
 * generating the private key d
 *
 * Usage:
 *
 *      Find d using the Extended Euclidian Algorithm: $d = euclid($e, $phi);
 *
 * See function getD() below
 */

public function euclid($num, $mod)
     {
      // The Extended Euclidian Algorithm
      $x = '1';
      $y = '0';
      $num1 = $mod;

      do
          {
           $temp = bcmod($num, $num1);
           $q = bcdiv($num, $num1);

           $num = $num1;
           $num1 = $temp;

           $temp = bcsub($x, bcmul($y, $q));
           $x = $y;
           $y = $temp;
          }
      while (bccomp($num1, '0'));

      if (bccomp($x, '0') < 0)
         {
          $x = bcadd($x, $mod);
         }

      return $x;
    } // end euclid()
?>
Next, get the private key d.
<?php
/**
 * generating the private key d
 *
 * Usage:
 *
 *      $d = getD($e, $phi);
 */

public function getD($e, $phi)
     {
      // Find d using the Extended Euclidian Algorithm: $d = euclid($e, $phi)
      // Notice that function euclid($e, $phi) (above) is a user-define function that you need to create,
      // so you'll have to call it accordingly as well, i.e., $your_class_instance->euclid($e, $phi) if you put it in your class

      return euclid($e, $phi);
    } // end getD()
?>
Now let's recap the steps again:
$key = getKey();
OR
$key2 = generateTwoPrime(20000); // you can pass in any number
n = getN($key['p'], $key['q']).
OR
n2 = bcmul($key2['0'], $key2['1']).
This is basically calculating this product of p*q and return its result.
Just return this equation: n = bcmul($key['p'], $key['q']). Very simple!
phi = getPhi(p, q), or more specifically phi = getPhi($key['p'], $key['q']).
OR
phi2 = bcmul($key2[0] - 1, $key2[1] - 1).
This is basically calculating this equation (p - 1)(q - 1) and return its result.
In other words, inside function getPhi(), just return this equation: bcmul($key['p'] - 1, $key['q'] - 1).
For p - 1, q - 1, use bcsub(), for example: bcsub(p, 1) and bcsub(q, 1), or more specifically bcsub($key['p'], 1) and bcsub($key['q'], 1). Very simple!
e = getE(). Use the function getE() shown above.
d = getD(). Use the function getD() shown above.
The argument message in the function RSAEncode() in step 7 below is analogous to the variable $string = THE RED COATS ARE COMING! used in the example earlier. So you'll have to create a function and put the ASCII character numbers code conversion shown earlier in it and call it accordingly. This step 6 is for doing the ASCII character numbers code conversion shown earlier.
encrypted_text = RSAEncode(message, e, n). message is the plain text message you want to encrypt, while e and n are public keys. Function RSAEncode is a user-defined function that you'll need to create, and you can name it any name you want. I named it as RSAEncode. See function rsa() below as a guide.
As a matter of fact, you can create your own RSAEncode(message, e, n) function and call the user-define function rsa() (below) from inside function RSAEncode(message, e, n). As you can see, function rsa() uses this formula: M e mod n. With M = message. Note that you should encode the strings in the variable encrypted_text using bases of your choice, for example: base 16, base32, base64, base92, etc., before sending it over the Internet.
See function rsa() below on how to use step 7 and 8.
decrypt_text = RSADecode(encrypted_text, d, n). encrypted_text is the text message that has been encrypted, while d is the private key and n is the public key. The argument encrypted_text in the function RSADecode() is the result from the encrypted strings in step 7 above. If you encoded the strings encrypted_text in step 7 above, using bases of your choice, for example: base 16, base32, base64, base92, etc., you'll have to decode it (or peel it off) before putting it through the decoding function RSADecode(). In other words, you have to peel off your encoded string variable encrypted_text (from step 7) first in order for the RSA algorithm to correctly doing its job. Function RSADecode is a user-defined function that you'll need to create, and you can name it any name you want. I named it as RSADecode. See function rsa() below as a guide.
As a matter of fact, you can create your own RSADecode(encrypted_text, d, n) function and call the user-define function rsa() (below) from inside function RSADecode(encrypted_text, d, n). As you can see, function rsa() uses this formula: C d mod n. With C = encrypted_text.
See function rsa() below on how to use step 7 and 8
As you can see from the two formulas (M e mod n or C d mod n ) outlined in the eight steps earlier for both encryption and decryption, the syntax for both is the same; and that is, a number M or C raise to the power (e or d) and then mod n. The only difference between the two formulas is the base number (M or C) and the raise power number (e or d).
This means that you can create only one function to calculate both encryption and decryption by passing to this function the appropriate values and the function should return the correct algorithm accordingly.
For example:
/**
 * assuming $num is the number to be raised to the power $power
 * and then modulo $mod, we can write the function for both
 * encryption and decryption like this:
 */

public function rsa($num, $power, $mod)
     {
      // return the result of the calculation: M e mod n or C d mod n

      // just remember to be mindful of the concept called
      // "computationally intensive!"
     }

/**
 * Usage:
 *
 *      $encrypt = rsa($encryption_number, $power_e, $mod_n);
 *
 *      $decrypt = rsa($encrypt, $power_d, $mod_n);
 *
 * as you can see, you still call the same function, but with different values!
 */
Here is a more detailed example:
/**
 * assuming $num is the number to be raised to the power $power
 * and then take the modulo $mod, we can write a function for both
 * encryption and decryption like this:
 */

public function rsa($num, $power, $mod)
     {
      // return the result of the calculation: M e mod n or C d mod n

      // just remember to be mindful of the concept called "computationally intensive!"
      // this is all you need: only one line of code and nothing else!!!

      // now after one block of encrypting the text, return it to your calling application so that
      // you can encode it using bases: base 16, base32, base64, base92, etc.

      return bcpowmod($num, $power, $mod);
     }

/**
 * Usage:
 *
 * // in your application that you do your algorithm processing tasks, here is one way to do it.
 * // for encryption: first you have to chop your long text strings and use foreach() loop to loop piece by piece
 * // and then call the function rsa() above by passing the appropriate values, for example:
 *
 * $array_of_your_chop_string = str_split($your_long_string, 32); // personally, I prefer 16 due to the "computationally instensive" problem
 *
 * foreach ($array_of_your_chop_string as $piece)
 *       {
 *        // make note of the $piece - you need to convert $piece to a smaller number so that it can be used in the RSA calculation
 *        $encryption_number = use_the_ordinal_character_number_conversion_shown_earlier_to_convert_$piece_to_a_smaller_number;
 *
 *        // now $encryption_number is a smaller number that can be used and manipulated by the RSA algorithm
 *        // then call function rsa() to manipulate and calculate the RSA algorithm
 *
 *
 *        // make note: you need your 2 public keys: e ($power_e) and n ($mod_n)
 *        $encrypt = rsa($encryption_number, $power_e, $mod_n);
 *
 *        // now after each block of encrypted text you can encode it using bases, for example: base 16, base32, base64, base92, etc.
 *        // you need to create a function that converts the base (i.e., base 92) and then call it from here
 *        // see my tutorial called 'Introduction to Base64 Encryption' on how to create your_long_base_converter_function()
 *        // you can even use the 'Users Contributed' functions mentioned in the tutorial
 *
 *        $encoded .= your_long_base_converter_function($encrypt, 10, 92) . " "; // notice "a space" between blocks as a delimiter
 *       }
 *
 * return $encoded; // now you need to send this $encoded strings to the receiver (or to function rsa()) to decode it
 *
 *
 * // now for decryption: once you got the $encoded string sent to you, you can decode it using function rsa()
 * // but first, you have to chop your long $encoded text strings and use foreach() loop to loop piece by piece
 *
 * $blocks = explode(" ", $encoded); // remember it used a space " " as a block delimiter (above)
 *
 * foreach ($blocks as $piece)
 *       {
 *        // now you have to decode it first using bases, for example: base 16, base32, base64, base92, etc.
 *        // see my tutorial called 'Introduction to Base64 Encryption' on how to create your_long_base_converter_function()
 *        // you can even use the 'Users Contributed' functions mentioned in the tutorial
 *
 *        $decode = your_long_base_converter_function($piece, 92, 10); // notice the 92 and 10 switch places
 *
 *        // as you can see, you still call the same function, but with different values!
 *        // make note also: you need your private key d ($power_d) and your public key n ($mod_n)
 *        $number = rsa($decode, $power_d, $mod_n); // $number is just a condense number
 *
 *        // now you have to convert the condensed $number into normal ordinary text characters
 *        $decode_to_normal_text .= use_the_number_to_ordinal_character_number_conversion_shown_earlier_to_convert_$number_back_to_characters;
 *       }
 *
  * return $decode_to_normal_text; // this is the decrypted (plain) text you wanted
 *
 * as you can see, it is very simple to program RSA encryption applications!!!
 */
To be continued!
Introduction to RC4 Encryption
In my other tutorial called Introduction to RSA Encryption, I layout an extensive description about the RSA encryption scheme. The RSA encryption scheme is an asymetric encryption scheme where you have a public key and a private key and both the sender and receiver would use different keys to encrypt and decrypt the message.
On the other hand, the RC4 encryption scheme is a symetric encryption scheme where both the sender and receiver would use the same key to encrypt and decrypt the message.
The RC4 encryption scheme was adopted and certified by the National Institute of Standards and Technology (or NIST) for safety uses for other uses that don't require military grade encryption like the RSA encryption scheme.
In other words, the RSA encryption scheme is a military grade encription scheme that is being used widely in banking applications and other top secret applications. The RC4 encryption scheme is an encryption scheme that is targeted for applications that do not require military grade encryption applications.
In a symetric encryption like the RC4, both the sender and receiver would use the same key to encrypt and decrypt the message. There is only one key, and each time a sender or receiver decides to change it and create a new one, they both need to meet again to create the key and exchange it among themselves.
This is analogous to a typical key you used on a daily basis where you need the same key to lock and unlock your doors.
This method is very secure as long as the key is not fallen into the wrong hands. And the same thing can be said about your regular key: If thieves don't get a hold of your key, they can't get in your house and steal your stuffs.
But the drawback for this method is that it is very inconvenient to both parties (sender/receiver) since both parties have to create the key and exchange it among themselves, unlike the RSA encryption scheme where you don't need to meet the other parties and exchange the key.
In the RSA encryption scheme, the sender does not need to get the key from the receiver. The sender can just obtain the public key that is available to the public because of the receiver made the key very public to anyone, including hackers. The sender can be far away across the occeans and never have to meet or know the receiver to exchange the key. This makes the RSA encryption scheme very powerful and popular all over the world -- not to mention that it is also a military grade encryption scheme as well.
In the asymetric encryption system, particularly the RSA encryption system, it has both a public and a private key and only one party (the receiver) needs to create the keys and neither need to meet with each other in order to exchange the keys securely.
In 1977, a group of three researchers at MIT developed an asymetric encryption algorithm for public-key cryptography known by its acronym as the RSA, which stands for the inventors' last names: R being Ron Rivest, S being Adi Shamir, and A being Leonard Adleman.
In cryptography, RSA encryption system is an asymetric encryption algorithm for public-key cryptography. It was the first algorithm known to be suitable for signing as well as encryption, and one of the first great advances in public key cryptography. RSA is widely used in electronic commerce protocols, and is believed to be secure given sufficiently long keys and the use of up-to-date implementations.
RSA involves a public key and a private key. The public key can be known to everyone and is used for encrypting messages. Messages encrypted with the public key can only be decrypted using the private key.
In this tutorial, I'm going to show you how to use a subset of the RSA encryption system called the RC4 cryptography (Rivest Cipher version 4). RC4 is an encryption algorithm that was created by Ronald Rivest of the RSA Security fame. He created this subset alone (by himself), unlike the RSA, which he and two others created together. The RC4 is used in WEP (or Wireless Encryption Protocal) and WPA (or Wireless Portable Adapter), which are encryption protocols commonly used on wireless routers.
Some notable uses of RC4 are implemented in Microsoft Excel, Adobe's Acrobat 2.0 (1994), and BitTorrent clients and as well as the following:
- Wireless security
- Processor security and file encryption
- SSL/TLS protocol (website security)
- Wi-Fi security
- Mobile app encryption
- VPN (virtual private network)
- Any large documents containing pages (hundreds of pages)
- And many more!
RC4 was developed to serve a niche segment of the online community that want speed and simplicity but also still obtained enough encryption strength without having to dip their toes into the military-grade algorithm of the likes of RSA algorithm. RC4 was not (and should not be) considered military-grade encryption algorithm. This means that RC4 should be used for any encryption tasks that involved moderate to somewhat high security channels.
Avoid using RC4 for online banking, which requires military-grade algorithm like the RSA. However, you may use RC4 for online credit card transtactions, provided you take some pre-cautions and implement some safe mechanism in your coding practices. It is fairly safe to implement RC4 algorithm in your online credit card processing tasks and lots of people have done so for decades and nothing have stopped them from using RC4 thus far.
The specification states that to begin the process of RC4 encryption, you need a key, which is often user-defined and between 40-bits and 256-bits. A 40-bit key represents a five character ASCII code that gets translated into its 40 character binary equivalent (for example, the ASCII key "pwd12" is equivalent to 0111000001110111011001000011000100110010 in binary. Make note: that o's and 1's are total of 40).
For more information about the ASCII code check out the Web on the topic of ASCII code or see the following link. In the following link, look for code under the title heading "BIN" for your particular character. ASCII Code
p = 01110000
w = 01110111
d = 01100100
1 = 00110001
2 = 00110010
The specification also gives the generic code example that we can adapt to whatever programming language we choose, and it is listed below.
Here is an illustration to accompany the generic code example specification:
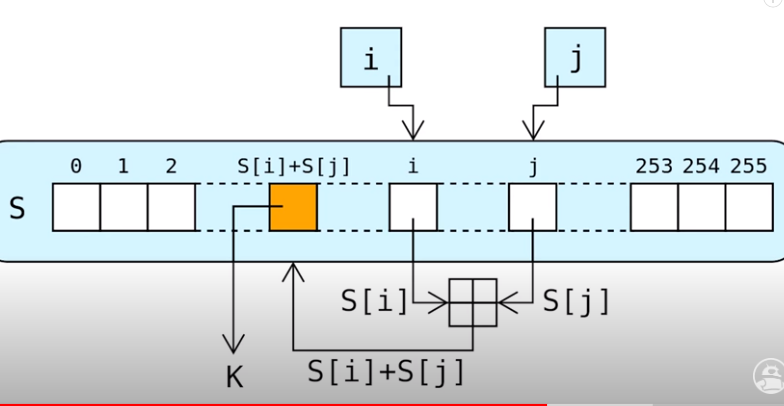
// For key handling

for i from 0 to 255
     S[i] := i
endfor


j := 0

for i from 0 to 255
     j := (j + S[i] + key[i mod keylength]) mod 256

     // swap the value of i into j and j into i and
     // it looks like this:
     //                     x = s[i];
     //                     s[i] = s[j];
     //                     s[j] = x;

     // here it is
     swap(S[i], S[j])
endfor


//The pseudo-random generation algorithm (PRGA).

i := 0
j := 0

while GeneratingOutput:
     i := (i + 1) mod 256
     j := (j + S[i]) mod 256

     // swap the value of i into j and j into i and
     // it looks like this:
     //                     x = s[i];
     //                     s[i] = s[j];
     //                     s[j] = x;

     swap(S[i], S[j])
     output S[(S[i] + S[j]) mod 256]
endwhile
You can implement the generic code above in whatever language you like, but to be more versatile, it is best to implement it in both client-side and server-side languages. So I'm going to adapt it in Javascript as the client-side and PHP as the server-side channels, and it is as follows:
First, we'll create a class for the server-side script in PHP:
<?php
class RC4Encryption
    {
     public function rc4($key, $str)
          {
           $s = array();

           for ($i = 0; $i < 256; $i++)
               {
                $s[$i] = $i;
               }

           $j = 0;

           for ($i = 0; $i < 256; $i++)
               {
                $j = ($j + $s[$i] +
                     ord($key[$i % strlen($key)])) % 256;

                $x = $s[$i];
                $s[$i] = $s[$j];
                $s[$j] = $x;
               }

           $i = 0;
           $j = 0;
           $res = '';

           for ($y = 0; $y < strlen($str); $y++)
               {
                $i = ($i + 1) % 256;
                $j = ($j + $s[$i]) % 256;
                $x = $s[$i];
                $s[$i] = $s[$j];
                $s[$j] = $x;

                // could it be this instead ????
                // $res.= chr(ord($str[$y]) ^ $s[($s[$i] + $s[$j]) % 256]);

                $res .= $str[$y]^ chr($s[($s[$i] + $s[$j]) % 256]);
               }
           return $res;
          }
    }// end class RC4Encryption
?>
Next, we'll create client-side algorithm script in Javascript.
/*
 * RC4 symmetric cipher encryption/decryption
 *
 * @param string key - secret key for encryption/decryption
 * @param string str - string to be encrypted/decrypted
 * @return string
 */
function rc4(key, str)
    {
     var s = [], j = 0, x, res = '';

     for (var i = 0; i < 256; i++)
         {
          s[i] = i;
         }

     for (i = 0; i < 256; i++)
         {
          j = (j + s[i] + key.charCodeAt(i % key.length)) % 256;

          x = s[i];
          s[i] = s[j];
          s[j] = x;
         }

     i = 0;
     j = 0;

     for (var y = 0; y < str.length; y++)
         {
          i = (i + 1) % 256;
          j = (j + s[i]) % 256;

          x = s[i];
          s[i] = s[j];
          s[j] = x;

          res += String.fromCharCode(str.charCodeAt(y)^ s[(s[i] +
          s[j]) % 256]);
         }
     return res;
    }
Now that we have a class for the server-side in PHP that returns the encrypted and decrypted messages and a client-side algorithm script in Javascript, we can use both the client- and server-side scripts in any applications to process the encrypted and decrypted messages.
Make note: function rc4() does both encrypting and decrypting the message. Yes, it seems very odd that one function returns both the encryption and decryption algorithms. Nonetheless, it does that both using the same key and the same algorithm. Very odd, indeed!
First of all, you may only need to use one of the scripts above; for example, you may choose to use the server-side PHP code but not the client-side Javascript code, or vice versa, depending on your application logic.
So, yes, you don't need to use both of the client-side and server-side code above at all: they can work independently of one another.
Depending on your application logic, you can use the server-side algorithm only or in conjunction with the client-side algorithm. They are provided here for those of you who need to work with both the client- and server-side applications in situation where you want to encrypt form data when users enter them on the input boxes, e.g., username and password, and encrypt those data before sending them to the server-side script for processing.
Once arrived at the server-side script the server-side script can decrypt the data using the server-side algorithm. So this ensures that no hackers can intercept the data while intransition.
Speaking of application logic and username and password, you can use this function rc4() to encrypt and decrypt RSA keys when you create the two primes (p, q). It is a very convenient function that is suiteable for such tasks.
If you need to use only one of the versions, here is all you need to do:
// PHP usage

// supply your own secret key

// you should use function rc4() to encrypt and decrypt this key.
// you should create keys, encrypt them and store them in a db or file.
// when you need to use them, retrieve them, decrypt them, and then
// use them like in here!

// decrypt the key before using it!

$key = "redalerttherussiansarecoming";

// the content to be encrypted
$plaintext = "Hello World!";

// encrypt the content by calling the rc4()
$ciphertext = rc4($key, $plaintext);

// from here, you can do whatever you wish with the cipher.
// now here is where you decrypt the content:
// you pass the same key used to encrypt and also the cipher text

$decrypted = rc4($key, $ciphertext);

// from here, you can do whatever you wish with the decipher. That is it!
echo $decrypted . " = " . $plaintext . "\n";

// Javascript usage

// supply your own secret key
var key = "0123456789abcdef"; // or in phrase: theskyisblue

// the content to be encrypted.
// usually getting from the input boxes, e.g., username, password
// once arrives in the server script (php) and decrypted,
// use explode('&', decryptedFromClient)

var plaintext = "username&password";

// encrypt the content by calling the rc4()
var ciphertext = rc4(key, plaintext);

// from here, you can do whatever you wish with the cipher
// now here is where you decrypt the content
// you pass the same key used to encrypt and also the cipher text

var decrypted = rc4(key, ciphertext);

// from here, you can do whatever you wish with the decipher
document.out.write(decrypted + " = " + plaintext + "\n");
As you can see from the examples above for both versions, you can generate a key and the content you want to encrypt, and then call the function rc4() to encrypt the content. For decryption, you need to supply the same key that was used to encrypt along with the encrypted content by calling the same function rc4(). Simple enough? That's it!
Now all you need to do is adapt it to your applications accordingly based on the logic of your applications. That's all you need: just two simple code algorithms.
For those of you who need to use both the client-side and server-side code logic, the following illustrates how to use them.
Before I dig deep into the heart and soul of the illustration, I just want to touch bases on the client-server model. The Web is a client-server model, or more precisely, a request-response model where the client requests the server (for some kind of information) and the server, well, serves the information back to the client. Hence, client-server model. So the client-side script is usually javascript and the server-side script is usually PHP but not strictly just PHP: it can be other server-side languages as well.
So we need to use Javascript and Ajax as the client-side code and PHP as the server-side script. So first we need to create a browser request object called XMLHttpRequest, and it looks something like this:
<script type="javascript">
function getxmlHttp()
    {
     var xmlHttp = null;
     // if the user's browser is FireFox, Safari, and
     // for all other non-Microsoft browsers.

     if (window.XMLHttpRequest)
        {
         // FireFox, Safari, and for all other browsers.
         xmlHttp = new XMLHttpRequest();

         if (typeof xmlhttp.overrideMimeType != 'undefined')
            {
             xmlHttp.overrideMimeType('text/xml'); // Or anything else
            }
        }
     // else if all Microsoft browsers
     else if (window.ActiveXObject)
        {
         // MSIE
         xmlHttp = new ActiveXObject("Microsoft.XMLHTTP");
        }
     else
        {
         // No known browsers -- consider aborting the application
         alert("unknown browser");
        }
     return xmlHttp;
    }
</script>
With the browser object encapsulated in a function, we can just use that object by just call that function whenever we need to use that object. You can give that code a file name and place it in your directory and link to it using a script tag: <script src="your-path/browser_object_file.js"></script> or place it in the header section of your page.
Next, we'll create a form that contains some items to be sent to the server-side script. We need to collect the items from that form and format them as a single string and then encrypt it before we send it to the server-side script. Simple enough?
Note that you cannot (nor should) use server-side script like PHP to directly collect the items from the form, because it defeats the purpose of trying to encrypt items before sending it over the internet and on to the server-side script.
To clarify what we're doing is that we're trying to encrypt the content on the client-side before sending it to the server-side. We don't want our content to be maliciously tampered while in transition on the internet. So we'll create an Ajax form containing some input boxes:
<form method="post" action="POST">
    <input type="text" name="name" value=""
                         onChange="getInfo()">
    <input type="text" name="email" value=""
                         onChange="getInfo()">
    <input type="text" name="content" value=""
                         onChange="getInfo()">
    <input type="text" name="username" value=""
                         onChange="getInfo()">
    <input type="password" name="password" value=""
                         onChange="getInfo()">

    <!-- make sure that you encrypt the key and password using ->
    <!-- Javascript function listed earlier ->
    <!-- see function getInfo() listed later ->

    <input type="password" name="key" value=""
                         onChange="getInfo()">
    <input type="submit" name="submit" value="Submit"
                         onClick="getInfo();">
</form>
The form is just a typical HTML form containing the usual attributes except one special event handler: onChange which fires off the event whenever any content is put in the input box. In other words, when someone type something in the input box it calls function getInfo(). This is Ajax at work! Notice that the action attribute doesn't contain a destination url and instead it contains the directive "POST", signifying the Ajax engine to do its job. You can implement it in jQuery as well and it will work just fine.
So now, we need to grab the content of the form one by one when the event fires off the function getInfo() and prepare them for encryption as follows:
<script type="javascript">
function getInfo()
    {
     /**
      * notice that the following values are obtained from the form,
      * in your local machine and no values are travelled outside of
      * of your local server/machine and therefore no security issue
      * is in harm's way.
      */

     var name     = document.getElementById("name").value;
     var email    = document.getElementById("email").value;
     var content  = document.getElementById("content").value;
     var username = document.getElementById("username").value;
     var password = document.getElementById("password").value;

     var key      = document.getElementById("key").value;

     //concatenate the name/value pairs
     var str = "name=" + escape(name) + "&email=" +
     escape(email) + "&content=" + escape(content) +
     "&username=" + escape(username) +
     "&password=" + escape(password) +
     "&key=" + escape(key);

     // now you need to encrypt it (str)

     ciphertext = rc4(key, str);

     var xml_obj = getxmlHttp(); // create an Ajax object

     // set up a url of the server-side script where to
     // send the encrypted str to (url) as a GET method!

     // alternatively, you use post method as well, but modify it accordingly!

     var url = "/Encryption/server_side.php?cipher=" + ciphertext;
     var isNS4 = (document.layers)?true:false;
     var isNS6 = document.getElementById &&
                 (navigator.appName == "Netscape")?true:false;

     if (!(isNS4 || isNS6 || "Macintosh" == "Windows"))
        {
         if (event.keyCode == 13)
            {
             // we do a "GET" to the server
             xml_obj.open("GET", url, true);
             // no POST to send to server, we did a "GET" instead
             xml_obj.send(null);

             xml_obj.onreadystatechange = function()
                 {
                  if (xml_obj.readyState != 4)
                      return; // do nothing ... not ready state yet

                  if (xml_obj.status != 200)
                     {
                      // do nothing ... handle request failure here...
                      return;
                     }

                  // read the response from server-side,
                  // which contains a ciphertext and decrypt it also
                  // noitice that xml_obj.responseText contains a ciphertext
                  // while response contains the decoded plain text

                  var response = rc4(key, xml_obj.responseText);
                  var piece = response.split("|"));

                  // for each array variable piece call a function outResponse()
                  // passing two arguments: item, index

                  piece.forEach(outResponse);
                 }
            }
         if (event.keyCode < 45 || event.keyCode > 57)
             event.returnValue = false;
        }
    }
function outResponse(item, index)
    {
     document.out.write("key: " + index + " = value: " + item);
    }
</script>
The code is self-explanatory. It first grabs each form's element content, it then concatenates the name/value pairs and then calls the function rc4() to encrypt the concatenated string. It then sets up a url of the server-side script where to send the concatenated string to. Next, it goes through a series of browser testing and also test if an enter key was pressed when the form (above) was filled out and submitted.
If the browser is ok and a submit button was pressed, it sends the encrypted content to the server-side script and waits (onreadystatechange) for a response from the server script to send back the content. When the server-side script responses it will fires off the onreadystatechange event and the code below it can grab the content of the response (xml_obj.responseText). Notice that the function rc4 got passed in the server response (xml_obj.responseText) and decrypted on the spot.
Since the server-side script formatted the response using "|" to delimit the content, it splits the content into array values by using the Javascript split(). It then iterates through the array by which calls user-defined function outResponse(item, index) to output the content of the array. You can choose to do whatever you wish with the response, but here, I chose to output it using an arbitrary user-define function. That's it for the client-side script.
A few words about the key: You need to figure out a better way to handle the key and you should not pass the key via the browser as shown here. You should store it in a database or a file or session and then retrieve it whenever you need it.
Now the server-side script: Again, you need to figure out a better way to handle the key.
<?php
include_once "rc4.php";

$obj = new RC4Encryption();

//get a key from the database
$key       = '0123456789abcdef';
$plaintext = array();

if (isset($_GET['cipher']))
   {
    $encryptedFromClient = $_GET['cipher'];
    $decryptedFromClient = $obj->rc4($key, $encryptedFromClient);
    $plaintext = explode('&', $decryptedFromClient);

    foreach ($plaintext as $k => $v)
          {
           // you can do something with $v, such as save it in db,
           // but here, we'll just format it and send it back to client
           $str .= $v . '|';
          }

    //let the client know we're sending back plain text data (not XML)
    header("Content-Type: text/plain");

    $encryptedToClient = $obj->rc4($key, $str);

    //send it back to the client
    echo $encryptedToClient;
   }
?>
This script (server_side.php) grabs the incoming http request content using a "GET" variable ($_GET['cipher']) and decrypts it using the function rc4(). It then chops the content into array values (key => value) and then formats the content using "|" as the array values delimiter. It then encrypts and sends the content back to the client. That's it!
Introduction to OpenSSL Encryption
The goal of the OpenSSL is to generate keys, certificates, and encrypt/decrypt messages and do other things related to encryption.
However, as often the case, you can do all these things with other tools as well. In later sections, we'll use PHP to do all these things to make our lives easier since using OpenSSL tool is not the easiest thing to do.
For those of you who want to use OpenSSL tool to accomplish the tasks, read on.
Check out the official OpenSSL docs for explanations of the standard commands:
OpenSSL Cryptography and SSL/TLS ToolkitOpenSSL is a cryptography toolkit implementing the Secure Sockets Layer (SSL v2/v3) and Transport Layer Security (TLS v1) network protocols and related cryptography standards required by them.
The openssl program is a command line tool for using the various cryptography functions of OpenSSL's crypto library from the shell to generate the following tasks.
- Creation and management of private keys, public keys and parameters
- Public key cryptographic operations
- Creation of X.509 certificates, CSRs and CRLs
- Calculation of Message Digests
- Encryption and Decryption with Ciphers
- SSL/TLS Client and Server Tests
- Handling of S/MIME signed or encrypted mail
- Time Stamp requests, generation and verification
Internet Security
When a client (browser) requests a secure connection to a server, the server, in turn, requests specific protocol information to figure out which types of cryptographic security the client can support. Once it determines the most secure option, the following takes place:
- The server sends a security certificate that is signed with the server's public key.
- Once the client verifies the certificate, it generates a secret key and sends it to the server encrypted with the public key.
- Next, both sides use the secret key to create two sets of public-private keys. At last, secure communication can commence.
SSL and TLS are two of many security protocols used to accomplish these steps. To implement these protocols, we need software like OpenSSL.
You'll come across tons of abbreviations in this guide and other OpenSSL tutorials. For quick reference, here is a short list of some terms you might encounter:
- CSR: Certificate Signing Request
- DER: Distinguished Encoding Rules
- PEM: Privacy Enhanced Mail
- PKCS: Public-Key Cryptography Standards
- SHA: Secure Hash Algorithm
- SSL: Secure Socket Layer
- TLS: Transport Layer Security
To use OpenSSL, follow these steps:
Download the source code for most platforms from the official OpenSSL website.
Download the source code for OpenSSLIf you need a windows distribution, Shining Light Productions has a good one although there are plenty of alternatives. For simplicity and for Windows OS users, I recommend using Shining Light Production, which you can download it below. In other words, you don't need to download the OPENSSL binaries from the OPENSSL website listed above, but instead, you can download it from the Shining Light Project listed below:
Download the Shining Light binaries insteadYou need to download the Shining Light and extract it and install it by just following the installation prompts.
In the Shining Light download page, choose the 64-bit version -- the first one in the list for a 64-bit -- by clicking on the EXE link under the Win64 OpenSSL v1.1.1g Light version (as of this writing), and extract it and install it on your system by just following the easy installation prompts.
Once everything is successfully installed, you can begin to use the OpenSSL commandline tool to generate keys, certificates, and countless other things.
For this tutorial, let's experimenting with the OpenSSL command line tool to get a better feel for it.
First, you need to open your command line prompt tool. For Windows OS, you can use the default command line tool that comes with the Windows Operating System by typing 'cmd' in the Windows search box at the lower left hand corner, and press enter.
A command line window that looks like the one below opens up and ready for your use.
As you can see from the Windows command line tool above, you can type any command to execute it.
For me, I installed my Shining Light tool in the directory called C:\Users\Home\. So the Shining Light comes with a folder called 'OpenSSL-Win64' if you download the 64-bit version.
So you need to navigate to the directory that contains the Shining Light binaries. For me, it's C:\Users\Home\OpenSSL-Win64\bin\openssl.
Notice the last entry: openssl. This is the executable file name and you need to execute this openssl.exe program.
Since the command prompt points to my default directory C:\Users\Home\, I need to change the default directory to the directory where it can find the Shining Light binaries, which resides in a directory called bin.
So at C:\Users\Home\ default directory, I can navigate to the binaries by changing the directory level by level by changing the directory level one at a time like this:
C:\Users\Home>cd OpenSSL-Win64 and press enter.
Now it should point to the current directory of:
C:\Users\Home\OpenSSL-Win64>
Now again you need to change the directory to a higher level -- namely the 'bin' directory -- by doing this:
C:\Users\Home\OpenSSL-Win64>cd bin and press enter.
Now it should point to the current directory of 'bin':
C:\Users\Home\OpenSSL-Win64\bin>
Now at the current directory of 'bin', you can enter the 'openssl' executable program and press enter. For example:
C:\Users\Home\OpenSSL-Win64\bin>openssl and press enter.
This will will point the current directory to the OpenSSL binaries that you can basically execute.
Now the command prompt will show this: OpenSSL>
And the cursor should be blinking and waiting for you to type something. Type a command and press enter.
Now you can try to type a command at the above prompt to see the result.
Let's try to see what the current version of the OpenSSL is by typing the following and press enter:
OpenSSL>version
Now it should say something like this:
OpenSSL 1.1.1g 21 April 2020.
If you need to know what type of commands you can use to execute, just type 'help' and press enter.
To close the Windows command line tool and exit the program, just type 'exit' at the prompt and press enter.
Let's try to generate the RSA encryption keys by typing the following and press enter:
OpenSSL>genrsa -out mykey.pem 2048
Now the tool generates an RSA private key, 2048 bit long modulus (2 primes)
You should now have a file called mykey.pem containing a private key in a folder called PEM. In the PEM folder, there should be a lot of stuffs that belong to OpenSSL for OpenSSL to use. But you only care about your private key that you generate, which in this case, mykey.pem.
See PEM folder in the directory that look like this: C:\Users\Home\OpenSSL-Win64\bin\PEM.
Notice that as the file's name suggests, the private key is coded using the Privacy Enhanced Email, or PEM, standard.
To encrypt our private key, we use the following code and press enter.
The command reads in from a file called mykey.pem using des3 as an algorithm and output the encrypted key to a file name my-encrypt-key.pem. Note that the minus sign ('-') in -des3 is part of the command and not part of the algorithm.
OpenSSL>rsa -in mykey.pem -des3 -out my-encrypt-key.pem
[
You can use any algorithm in place of the des3. To find the available algorithms, type in the command prompt: help.
Look under the category: Cipher commands. For example, aes-128-cbc, aes-256-cbc, rc4, etc.
]
Now the OpenSSL tool will display a message saying:
Writing RSA key
Enter PEM pass phrase
While showing a blinking cursor waiting for you to enter the password.
After you type your password and press enter, it will display the message:
Verifying - Enter PEM pass phrase
You need to enter the exact password you entered the first prompt and press enter.
If the passwords are verified, the tool will encrypt the key without displaying any message. It will display a command prompt for you to enter another command. For example:
OpenSSL>
And the cursor should be blinking and waiting for you to type something.
On the other hand, if the passwords are not verified, the tool will display the error message, telling you what's wrong with your entry.
If you entered the correct password for both entries, you should see a file name called my-encrypt-key.pem in the the PEM folder along with the already file mykey.pem that was created earlier.
//
- Creating digital signatures
- Certificate signing requests
- Generating SSL certificates
- Viewing certificates
- Miscellaneous
To be continued!
What is steganography?
Please check these out:
Steganography Steganography: How to Hide Top-Secret Data in Photos Steganography: Secrets Hidden in ImagesSteganography is an encryption method that uses images to embed messages. It is an encryption method that encodes text into images.
In the dictionary, the definition of steganography is the art of hiding messages in an image.
If you had watched a TV episode series called The FBI Declassified on CBS, which aired on October 13, 2020 where the FBI counter-surveillanced the ten Russian spies that took place from 2004 to 2009, you would know that the Russian's method of hiding messages was the steganography (encode text into image) method of encryption.
This is a great way to send a secret message to a friend without drawing attention to it (as the Russians have used to their advantage in their spy ring during the surveilance by the FBI).
Compare this method to simply sending someone an encrypted piece of text using the RSA, RC4, or any of the other algorithms and you'll draw attention to you immediately.
No matter how strong the encryption method is, if someone is monitoring the communication, they'll find it highly suspicious.
With steganography, no one is aware of what you're doing covertly.
The fact that digital images are just streams of bytes like any other file makes them a particularly effective medium for concealing secret text and other data.
When they open a picture on a device, i.e, mobile phone or laptop, few people ever have reason to look beyond the visual presentation displayed to what lies hidden inside the .jpg, .png, .bmp or other image file format.
Popular algorithms include simple least significant bit (LSB) steganography, group-parity steganography, and matrix embedding.
How Steganography Hides Information
To understand how image steganography works, let's take a look at some basic ways you can hide text in an image file.
A Work-in-progress! To be continued!
By the way, the slang word for steganography is stego!
Also a message is sometimes called a payload!
To embed the message, some pixels in the cover image must be modified by an embedding operation so that the resulting stego image conveys the message bits.
Two popular operations are LSB replacement and LSB matching.
In LSB replacement, odd pixels are decremented and even pixels are incremented.
In LSB matching, pixels are either incremented or decremented as necessary.
By storing the message in the LSBs, the resulting stego image looks similar to the cover image, making it difficult to detect by steganalysis detectors. Despite being careful, if the number of changes is sufficiently large, it is still possible to detect stego images as suggested by the square root law of steganographic capacity (Ker, 2007, Filler et al., 2009, Ker, 2009).
Once a stego image is detected, further processing is needed to extract the hidden message, which is inherently a difficult problem. One approach is to search for the embedding key (Fridrich et al., 2004).
This technique is applicable when the key space is small and details about the embedding software are known. The advantage is that once the key is found, the hidden message can be extracted readily.
An alternative approach that may lead to the eventual message extraction is to locate the message using a number of stego images where each stego image has the payload at the same locations (Ker, 2008, Ker and Lubenko, 2009, Quach, 2011a, Quach, 2011b, Quach, 2012, Quach, 2014).
This could happen if the naive steganographer reuses the embedding key and the stego images are the same size.
As an example, the steganographer takes several pictures using his digital camera and then embeds messages into these pictures using the same password, e.g., embedding key. Message location (or sometimes called payload location) can be used in this scenario.
Message location can be effective against simple LSB steganography as well as group-parity steganography. Message location algorithms generally rely on computing the residuals of pixels indicating whether they have been modified in the embedding process.
Payload location, however, can only reveal the message bits; the messages themselves remain hidden as we do not know the logical order of the located payload. In order to extract the messages, we need to establish the correct order on the located payload.
The current work addresses this fundamental problem. Specifically, we show that if the size of the payload in each stego image is not fixed, the expected mean residuals impose the correct logical order on the located payload.
In particular, the expected mean residual of logical payload bit i is strictly greater than the expected mean residual of logical payload bit j for i < j. The hidden messages, therefore, can be obtained by ordering the located payload in descending mean residual.
Following a brief overview of steganography and payload location in Section Background, our main result is presented in Section Message extraction. Experimental results to further support our analysis are presented in Section Experiments. Concluding thoughts are provided in Section Discussion and conclusion.
Background
In simple LSB steganography, each payload bit is determined by a single pixel. Given cover image c = (c1,..., cn)2 and message m = (m1, m2,..., mm), where and m = n, a naive algorithm would use the pixels in their natural order to embed m to produce stego image s = s1, s2,..., sn so that LSB(s1) = m1, LSB(s2) = m2, etc., where LSB(.) returns the least significant bit.
This is not recommended due to the fact that the introduced stego noise is concentrated in the first m pixels of the stego image, possibly making it easier to detect.
More importantly, the message can be extracted by examining the LSBs of the first m pixels. To overcome these undesirable characteristics, a key is often used in the embedding process to distribute the payload over the entire image. Both embedding processes are illustrated in Fig. 1.
To be continued!
What is base64?
Please check these out:
Base16, Base32, and Base64 Data Encodings base64_encode - Encodes data with MIME base64 base64_decode - Decodes data encoded with MIME base64 What is Base64?Base64 is a method to convert ordinary text characters you type on your keyword to a binary form that a computer can understand. However, despite the title of this tutorial, it is not an encryption method, but rather, it is an encode method used to encode (or convert) normal text characters into a binary form that a machine can understand.
The base64 encoding is designed to make binary data survive transport through transport layers that are not 8-bit clean.
Why is the need to convert normal text characters to a binary form?
Rather than spending time explaining it, I'll refer to this excellent explanation on the Web:
What is base 64 encoding used for?Base64 over RSA
In the RSA encryption tutorial, you can make it even more secure and robust by encoding the RSA's encrypted message with other bases such as base64, base10, base16, base32 or other bases like base26, base62, base92, etc.
As a matter of fact, wise guys like to encode their RSA encrypted text with other bases to make their RSA encryption algorithm even more secure.
Note that you have to keep the base that you're using a secret; otherwise, hackers can use your base to convert back to your original encrypted text.
In other words, don't let hackers see your function that converts your base.
You don't need to be too secret with your base (or function that converts your base), just keep it out of sight and don't advertise to the public like you do with your public keys.
Even if hackers got a hold of your base, they still have to break your RSA encryption algorithm as well. So there is no need to worry about being too secrecy about your base.
Remember that the RSA encryption algorithm is your heart and soul of your encryption!
So don't worry too much about hackers getting a hold of your base, they still need to break your RSA encryption algorithm, too.
You can use the following code provided by PHP's user contributed forum notes:
base_convert: Users contributed forum notesHere is a base 92
/**
 * Returns a string containing number represented in base $tobase.
 * The base in which number is given is specified in $frombase.
 *
 * Both $frombase and $tobase have to be between 2 and 92, inclusive
 *
 * Digits in numbers with a base higher than 10 will be represented with
 * the letters a-z, with 'a' meaning 10, 'b' meaning 11 and 'z' meaning 35.
 *
 * The case of the letters doesn't matter, i.e.,
 * number is interpreted case-insensitively.
 *
 * from Stackoverflow:
 *
 * base64_encode(1234) = "MTIzNA=="
 * base64_convert(1234) = "TS" // if the base64_convert function existed
 * base64 encoding breaks the input up into groups of 3 bytes (3*8 = 24 bits),
 * then converts each sub-segment of 6 bits (2 6 = 64, hence "base64") to
 * the corresponding base64 character:
 *
 * values are "ABCDEFGHIJKLMNOPQRSTUVWXYZabcdefghijklmnopqrstuvwxyz0123456789+/",
 *
 * where A = 0, / = 63
 *
 * In our example, base64_encode() treats "1234" as a string of 4 characters,
 * not as an integer (because base64_encode() does not operate on integers).
 */

public function longBaseEncode($numstring, $frombase, $tobase)
     {
      // Converts a long integer (passed as a string) to/from any base from 2 to 92

      // Notice that the following code is one continuous line!
      // It is broken into two lines to fit the display area!

      $char = "0123456789abcdefghijklmnopqrstuvwxyz
               ABCDEFGHIJKLMNOPQRSTUVWXYZ_-+=!@#$%^*(){[}]|:,.?/`~&';\"\\";

      $fromstring = substr($char, 0, $frombase);
      $tostring = substr($char, 0, $tobase);

      $length = strlen($numstring);
      $result = '';

      for ($i = 0; $i < $length; $i++)
          {
           // Array and string offset access syntax with curly braces is deprecated
           // $number[$i] = strpos($fromstring, $numstring{$i});

           // so use [] instead of {}
           $number[$i] = strpos($fromstring, $numstring[$i]);
          }

      do
          {
           $divide = 0;
           $newlen = 0;

           for ($i = 0; $i < $length; $i++)
               {
                $divide = $divide * $frombase + $number[$i];

                if ($divide >= $tobase)
                   {
                    $number[$newlen++] = (int)($divide / $tobase);
                    $divide = $divide % $tobase;
                   }
                elseif ($newlen > 0)
                   {
                    $number[$newlen++] = 0;
                   }
               } // end for

           $length = $newlen;


           // Array and string offset access syntax with curly braces is deprecated
           // $result = $tostring{$divide} . $result;

           // so use [] instead of {}

           $result = $tostring[$divide] . $result;
          } // end do
      while ($newlen != 0);

      return $result;
     } // end function longBaseEncode()

/**
 * Usage:
 *
 * first, you need to break your message into small pieces that
 * looks like this one piece:
 *
 * 'THE RED COATS ARE COMING!'
 *
 * see the "bonus" materials in the "RSA" tutorial.
 *
 * next, once you have the pieces, you can use loops to encrypt your pieces
 * and at the same time, you can encode your pieces using this 'longBaseEncode()'
 *
 * assuming:
 *
 * $piece = 'THE RED COATS ARE COMING!';
 *
 * make sure that $piece has been encrypted before
 * wrapping 'longBaseEncode()' around it!
 *
 * for example:
 *
 *     wrapping longBaseEncode() around $piece to make it even more secure:
 *
 *     $ciphertext = longBaseEncode($piece, 10, 92) . " ";
 *
 * notice that $ciphertext should contains chunks of encrypted text seperated
 * each chunk with a blank " ".
 *
 * so it should looks like this:
 *
 *     $ciphertext = 'a65xa07491k f5zyfpvbo76g33 3o47re02jzqisvio rgo9la0 ....'
 *
 * make note of the space between chunks!
 */
You can use some of the "User Contributed" code examples shown in the link mentioned earlier to encode your RSA encrypted text.
There you have it!
Go at it!
To be continued!
Introduction to Autonomous Vehicles
Technology is like fashion: it has trends!
Just a few years ago starting right around 2014 and beyond the trend in technology was about drone delivery - delivering everything like packages to residential households in cities and rural areas as well as delivering lifesaving medicines to hard to reach remote corner of the world.
Remember they were saying that you can order packages from Amazon and Amazon was going to air drop your packages in your backyard without you being present while you are still at work in your office away from home?
Has it happened yet?
The jury is still out on this one!
Now the year is 2018 and a hot new technology trend is called autonomous self-driving vehicle. Yes, autonomous self-driving vehicle is all the rage these days and it reminds me of the rage that Ajax garnered right around 2004-5 as if it was the second coming of the birth of the internet.
Yes, Ajax was all the rage for quite some time in those days and continued for much of the first half of the millenial decade (up to 2015).
Now (2018 and beyond) all the rage is about autonomous self-driving vehicle and it catches people's imagination all over the world these days and therefore I thought it's a good time to take a look at autonomous sphere and shed some lights on it. Sort of a beginner's guide to autonomous self-driving vehicle technology.
Like drone technology which requires a government body to regulate how it is operated: that is, drones operations is like airplane operations where safety issues are paramount above all else; autonomous self-driving vehicle also requires a government body to regulate how it is operated to ensure that safety issues are fully tested and certified.
The SAE International is the professional association of automotive engineers formed by the automotive industry of the world to standardize the way automotive function in a standardize way.
The acronym SAE is derived from the association name: Society of Automotive Engineers.
The SAE is a group of automotive engineers who specialize in developing automotive technologies, such as air bags, elastic seat belts, and many other essential automotive products. Since 2005, the SAE has been focusing its attention on autonomous self-driving vehicle technologies.
They adopted the following guideline for the automotive industry to follow:
Autonomous Levels
What do terms like "Level 4" and "Level 5" mean?
Here's the complete guide.
What does it mean when someone refers to "Level 4" or "Level 5" self-driving?
What are the levels, and who decides which systems qualify?
The "levels" are taken from a framework established by SAE International -- SAE is the acronym for Society of Automotive Engineers, the professional association of automotive engineers, as a shorthand to describe how far a particular system goes in automating the task of driving a vehicle. The SAE's framework has been widely adopted by (government) regulators, engineers, and automakers -- and by investors, too.
The SAE's framework describes six levels of vehicle automation, ranging from no automation at all -- an old-school car -- to fully automated, meaning a system that can drive at least as well as a skilled human in any situation.
It's very important for investors looking at companies in the self-driving space to understand what is meant by the various levels, who decides what level to assign to a given system, and the differences between the levels -- particularly as they get more advanced. (I'll tell you a secret up front: Sometimes, systems described as "self-driving" really aren't.)
It hasn't always been easy to make sense of this framework. As you'd expect from a society of automotive engineers, the SAE's own descriptions of the levels are jargony and a little hard for nonexperts to parse. But for the most part, they make sense when explained in plain English -- and that's what you'll find in the following.
What is autonomous driving?
First and foremost, an "autonomous driving" system is one that allows a vehicle to drive safely on public roads without human involvement. Terms like "automated driving," "driverless vehicle," and "self-driving car" are all describing the same technology: A computer "brain" and sensors that can drive a vehicle in place of a human, at least under some circumstances.
Here are a few key things to keep in mind as we dig into the world of automated driving systems:
Advanced driver-assist and driverless systems rely on several types of sensors, including cameras, radar, and lidar (a sensor that uses invisible laser beams to precisely measure distances) to help the vehicle's computer "brain" understand where the vehicle is relative to its surroundings.
The number of sensors used, the amount of computing power required for the "brain," and the overall cost of the system all typically increase as the level of automation increases.
Self-driving systems are a form of artificial intelligence. They generally incorporate machine learning, meaning algorithms that can adjust themselves and improve their effectiveness as more data is acquired.
Fully driverless systems acquire vast amounts of data as they travel from place to place and encounter new traffic situations. The individual vehicles' systems typically share that data with a remote data center, which updates all of the vehicles using the system with lessons learned. This process is called fleet learning.
There's one more thing to know, and it's very important to keep in mind as you assess claims about particular systems:
The level assigned to any given system is assigned by its manufacturer. As of right now, there is no independent or government agency certifying a given system as Level 3 or Level 4 or whatever. Until that changes, the levels are best thought of as a manufacturer's claim: They might be a bit optimistic, so drive carefully.
If you'd like to dig deeper, you'll find a comprehensive overview of driverless-vehicle systems by Googling SAE autonomous driving vehicle.
For now, let's see what these levels mean:
Level 0: No automation.
Level 1: A little automation.
Level 2: Control of steering or brakes, but not both, under limited circumstances.
Level 3: More automation, but not self-driving.
Level 4: True self-driving, but under limited circumstances.
Level 5: Full self-driving with no limitations.
Detail Explanation
Level 0: No automation
The SAE's framework begins with Level 0: No automation. The human driver is responsible for 100% of what the SAE refers to as "the dynamic driving task," meaning the work of actually driving the vehicle on an ongoing basis. (Keep that word "ongoing" in your mind as you read on -- it's a key part of how the SAE defines automation.)
Level 0 isn't that hard to understand, but even here there are some nuances. Probably the most important point is this: There are plenty of modern cars with driver-assistance features that still qualify as Level 0.
For instance, antilock brakes don't count as automation because the human still has to step on the brake pedal. Even systems that automate a momentary task -- like the automatic emergency braking systems found on some new cars -- don't count as automation for our purposes, because they don't automate the "dynamic driving task" on -- you guessed it -- an ongoing basis.
The takeaway: While your grandfather's old Buick is certainly a Level 0 vehicle, so are many modern cars that are equipped with what we think of as "driver-assist" features.
Level 1: Some assistance for the human driver
The SAE defines a Level 1 system as one that provides either steering control or acceleration-and-braking control on an ongoing basis -- but only under limited, specific circumstances.
What does that mean?
Here's an example using technology that's probably familiar to you.
Aside from very basic entry-level model, most cars made in recent years have a cruise-control system. You've almost certainly used one, but if you haven't, the principle is simple: Accelerate to a desired speed, activate the cruise control, and the system will hold the vehicle at that speed, even up and down hills, after you take your foot off of the accelerator pedal.
That doesn't count as "automation" in the SAE's framework, because the dynamic part of the driving task isn't automated: The human still has to be ready to hit the brakes (and deactivate the system) if there's slower traffic ahead.
In recent years, automakers have begun offering more advanced cruise-control systems, so-called adaptive cruise control. Adaptive cruise control systems are smarter: They use radar to keep your car at a safe distance behind the vehicle ahead. If the car ahead slows, the system automatically slows your car as well in an effort to maintain a safe distance.
With adaptive cruise control, one part of the dynamic driving task -- controlling acceleration and brakes -- is automated. Of course, it's only automated under specific circumstances, namely when you turn the system on while driving on the highway. But that's sufficient to lift an adaptive cruise-control system into Level 1.
Level 2: Limited help with steering and braking
Level 2 is "partial automation." It's for driver-assistance systems that provide both steering and acceleration-and-braking control, but again, only under limited circumstances. If the human driver has to intervene regularly -- for instance, when the car is exiting a highway -- then it's probably a Level 2 system. Importantly, it's not "self-driving," even if it kinda-sorta seems like the vehicle is driving itself.
That can make understanding Level 2 a little tricky. Let's take a closer look.
Level 2 can sometimes seem like self-driving, but it isn't Tesla's (NASDAQ: TSLA) Autopilot and General Motors' (NYSE: GM) Super Cruise, both of which can accelerate, brake, and steer under many (but not all) circumstances, can certainly deliver an experience that seems like "self-driving."
But there's a reason that GM and (usually) Tesla are very careful not to describe them as full self-driving systems in their current forms: With both, the human driver needs to be alert and ready to take over the driving task on very short notice -- more or less instantly.
That's a critical distinction. If a human driver is needed on short notice, then a system shouldn't be described as "self-driving." Instead, it's properly referred to as an advanced driver-assist system (ADAS).
That may sound like splitting hairs, but it's a big deal because the expectations around a given system can affect how safe it is in practice. A Tesla Model S equipped with an early version of Autopilot was involved in a fatal accident in May 2016 when the car's system failed to recognize a tractor-trailer crossing the road -- and the human driver apparently didn't intervene to hit the brakes.
That was the first known fatal accident involving anything close to a self-driving system, and it emphasized that these systems needed to do a better job of ensuring that human drivers were alert and ready to take control on short notice.
That in turn led to considerable discussion within the industry: How could a system ensure that a human driver was alert without excessively annoying the human?
The challenge: How to keep the driver alert, but not annoyed?
Annoyance may seem like a trivial consideration when we're talking about avoiding fatal accidents. But consider this: If the system is too annoying to use, it won't get used.
The current version of Tesla's Autopilot warns drivers not to take their hands off of the steering wheel while the system is in use. To enforce that, the system has sensors that aim to detect whether the driver's hands are on the wheel.
If the driver's hands aren't on the wheel, the system gives a visual reminder after 30 seconds, followed by an audible warning after 45 seconds. After a minute with no intervention by the driver, the Autopilot system shuts off and can't be turned back on until the car is restarted.
It's not a bad system, but review have suggested that it's easy to fool -- drivers can just nudge the wheel when the lights come on to reset the warning cycle, while otherwise driving hands-free.
GM's Super Cruise incorporates an elegant solution
GM's solution allows for hands-free driving. Instead of detecting steering-wheel motions, it uses a camera to track the driver's head position. If the system detects that the driver's eyes aren't on the road, it begins a series of prompts to try to get the driver's attention back on the road.
Similar to Tesla's alerts, Super Cruise's prompts progress from a flashing light in the steering wheel's rim, to a beeping sound and seat vibrations, to a voice command -- at which point the Super Cruise system disengages. But GM goes further than Tesla: If the driver still doesn't take control at that point, the system will gradually bring the vehicle to a complete stop, activate the hazard warning flashers, and call for help (using GM's OnStar system.)
GM also built a slew of additional safeguards into Super Cruise to try to ensure that it's only used in circumstances it can safely handle. For starters, if the vehicle isn't on a highway, the road's lane markings aren't clearly visible, or the system thinks that the driver isn't fully attentive -- it won't even switch on. That may sound like a recipe for constant annoyance, but it's all elegantly implemented.
Most reviewers have agreed that Super Cruise is a pleasure to use.
The thing to remember: "Hands-free" isn't necessarily self-driving.
To sum up, a Level 2 system is an advanced driver-assist system that can allow for hands-free driving under limited circumstances. But the human driver has to remain alert and ready to take over the "dynamic driving task" on short notice, and the leading systems attempt to ensure that the driver remains alert while the systems are in use.
Level 3: A little closer to self-driving
The SAE defines Level 3 as "conditional automation." The difference between Level 2 and Level 3 is a matter of degree. In practice, it depends on the answer to this question: How alert does the human in the vehicle's driver's seat have to be?
With a Level 2 system, the driver needs to be very alert, ready to take over the driving task right away right away if the system encounters something it can't handle. With Level 3, the expectation is that the system can handle the driving as long as it's within its "operational design domain," meaning that the human's role is to be a "fallback."
Here's how the SAE puts it:
The sustained and [operational design domain]-specific performance by an [automated driving system] of the entire [dynamic driving task] with the expectation that the [dynamic driving task] fallback-ready user is receptive to [automated driving system]-issued requests to intervene, as well as to [dynamic driving task] performance-relevant system failures in other vehicle systems, and will respond appropriately.
Got that?
If you're thinking that it's only a vague difference from Level 2, you're not alone.
Why many automakers are steering clear of Level 3?
The difficulty in defining (and explaining) a difference between Level 2 and Level 3 is the problem with Level 3 in practice. It's easy for us to understand that a Level 2 system isn't true self-driving, while (as we'll see below) Level 4 is self-driving, and it's fairly easy to explain that difference to users. But Level 3 seems to exist in between.
It's self-driving, except when it isn't.
That presents a challenge for engineers charged with developing a system. In a presentation in 2016, Ford Motor Company's (NYSE: F) former global product chief, Raj Nair, explained why Ford's road map for self-driving technology skips Level 3 entirely:
We found we couldn't safely get through scenarios that really concerned us without adding technology like LiDAR and like high-definition 3D maps. Once you go to that point, you're really at the solution for Level 4.
So we changed our direction from walking up driver assist technologies, the camera-based and radar-based technologies increasing at percentage, et cetera, to all the way leapfrogging into what does it take to get to Level 4, what does it take to get rid of the driver, what does it take to get rid of the steering wheel, the pedals, and then working on that technology problem.
Put simply: Once Ford engineers had added all of the technology needed to make their prototype Level 3 system meet their safety standards, they were essentially at Level 4. Given that, they reasoned, why plan to offer Level 3 at all?
But a few Level 3 systems are headed to market.
A lot of other automakers have reached the same conclusion about Level 3, but not all. There's another point of view, namely that Level 3 could be interpreted as a nicer implementation of the concepts behind Level 2 systems like Super Cruise.
That's Audi's view. Audi will launch a Level 3 system it calls "Traffic Jam Pilot" on its 2019 A8 sedan. Audi's pitch for the system effectively captures what it sees as the distinction between Level 2 and Level 3:
With Traffic Jam Pilot engaged, drivers no longer need to continuously monitor the vehicle and the road. They must merely stay alert and capable of taking over the task of driving when the system prompts them to do so.
But note: While Audi will offer this system in Germany, which recently passed laws making this type of system explicitly legal, Audi won't bring it to the United States -- at least, not yet -- because of concerns about liability and regulatory exposure.
It's not hard to see why. Even in Audi's own words, the distinction is still vague. The idea seems to be that Audi's system will give the human a bit more time to take over than a Level 2 system would.
But still: Does the human in the driver's seat need to be paying attention, or not?
Fortunately, the next level doesn't require such hair-splitting to understand.
Level 4: True self-driving, but with limits
The SAE says that Level 4 is "high driving automation": The system doesn't need a human backup at all, as long as it's operating within its "operational design domain." Put another way, a Level 4 system still has limits, but as long as it's within those limits, no human intervention will be needed -- it's real self-driving.
Here's what that means in practice.
Most of the "self-driving" systems under development today depend on highly detailed 3-D maps to help the vehicle's "brain" know exactly where it's located, down to a few centimeters (or less). These systems generally use several lidar units to "map" the vehicle's surroundings from moment to moment. The lidar images are then compared to a stored 3D map.
Some of the systems under development use the lidar-and-maps method as a primary method of locating the vehicle, while others use it as a backup. (One of the principles of full self-driving systems, like autopilot systems in aviation, is that all critical subsystems should have backups in case something fails.)
A Level 4 system is true self-driving as long as the system is operating within its limits. It doesn't matter whether the human sitting in the driver's seat is distracted, asleep, or not even present -- a Level 4 system will get the vehicle safely to its destination, as long as it's operating within its intended limits.
General Motors' first Level 4 vehicle, set to enter production in 2019, doesn't have a steering wheel or pedals. They're not needed as long as the vehicle operates within specified limits.
True Level 4 vehicles are beginning to arrive.
Level 4 vehicles are coming soon -- in fact, they're already here. Waymo, the Alphabet (NASDAQ: GOOGL) (NASDAQ: GOOG) subsidiary formerly known as the Google Self-Driving Car Project, began deploying Level 4 vehicles in a pilot ride-hailing service in Chandler, Arizona, earlier this year (2018).
General Motors (NYSE: GM) has said that its own self-driving subsidiary, GM Cruise, expects to deploy a fleet of "thousands" of Level 4 taxis in dense urban environments in the U.S. starting in 2019. Others will follow over the next few years.
But note that Waymo and GM aren't choosing locations at random. Waymo spent months "training" its prototype vehicles on the roads and traffic conditions in and around the Chandler area; GM Cruise has been doing the same with its Chevrolet Bolt-based vehicles in San Francisco.
For now, those vehicles are limited to the areas with which their systems are most familiar, all of which have been very carefully mapped.
Those limits are what make the systems Level 4. For instance, no matter how the maps are used, if the vehicle is dependent on a map, that means it's limited, because it can't go anywhere that isn't yet mapped. Of course, a Level 4 system could have other limits; it may not switch on if it detects heavy snow, for instance.
Long story short: If a system offers full automated driving within limits, the limits are what makes it Level 4.
Level 5: Full unconditional automated driving
Level 5 is the dream: Unconditional (that is, no-limits) automated driving, with no expectation that a human driver will ever have to intervene.
Put another way, a Level 5 system should be able to go anywhere a skilled human driver could go, under any conditions a skilled human driver could handle, entirely on its own.
Needless to say, there aren't any Level 5 systems available now. A few automakers, including Tesla and BMW, have claimed that they will have Level 5 systems within a few years -- but many experts believe that true Level 5 autonomy will take years to develop, if it ever happens at all.
It's possible that Level 5 systems will be the eventual result after lots of connected Level 4 vehicles are deployed and learning. Remember what I said about machine learning and fleet learning above?
Systems that are deployed in thousands of vehicles operating every day will amass huge amounts of data and encounter lots of new situations -- both of which mean they'll advance quickly on their own. Between this ongoing fleet learning and the expansion of well-mapped areas, the most widely deployed systems will effectively become Level 5 -- eventually.
Maybe.
It's also possible that a true Level 5 system -- a single system that can safely drive in a Montana snowstorm, a Shanghai traffic jam, and anywhere else a skilled human driver might be able to go -- won't come into being for many, many years (notwithstanding the bold promises made by certain CEOs).
Why full self-driving might still be years away?
Full self-driving is an incredibly difficult problem to solve. Consider that even Waymo -- which began way back in 2009 as the Google Self-Driving Car Project and has some of the best and most experienced engineers in the field -- is still having trouble getting its vehicles to safely navigate some routine traffic situations in suburban Chandler, where the situations are all known and the area is carefully mapped.
How do you think they'd fare in a completely unfamiliar environment -- downtown Mumbai, for instance?
A capable human driver from suburban Arizona would probably be able to navigate Mumbai pretty well with a smartphone and a bit of familiarization.
But at least right now in 2018, it looks like it could be many years before a self-driving system will be able to do the same -- and that means that true "full self-driving" won't arrive anytime soon.
However, in the long run it will happen as enginuity gets more advanced and sophisticated.
There you have it!
A beginner's guide to autonomous self-driving vehicle!
A Brief Introduction to Machine Learning/Neural Network
This tutorial is being worked on and improvement and fine-tuning and simplifying are forthcoming. Stay tuned!!!
Neural networks are parallel computing programs or model, which are basically an attempt to make a computer model of the brain. The main objective is to develop a system to perform various computational tasks faster than the traditional systems. This tutorial covers the basic concept and terminologies involved in Artificial Neural Network.
Biological Neuron
A nerve cell (neuron) is a special biological cell that processes information. According to an estimation, there are huge number of neurons, approximately 1011 with numerous interconnections, approximately 1015.
As shown in the above diagram, a typical neuron consists of the following four parts and with the help of Wikipedia I can briefly explain its working.
Note that you don't need to memorize the terms (or names) presented above or the following four terms below, either. It's for illustration purpose only:
- Dendrites - Are brain cells that receive and response signals from/to other parts of the brain cells. They are tree-like branches, responsible for receiving the information from other neurons it is connected to. In other sense, we can say that they are like the ears of neuron.
- Soma - It is the cell body of the neuron and is responsible for processing of information received from dendrites.
- Axon - It is just like a cable through which neurons send the information.
- Synapses - It is the connection between the axon and other neuron dendrites.
So the combined brain cells shown in the above diagram is called neural network. It's how brain functions. We use a form of machine learning called neural network to mimick how human brain works. I should say we try to mimick how human brain works. We will never be able to replicate how human brain works using machine learning.
Just like human brain receives and responses to signals from other cells within the brain, in machine learning, we mimick that feature by providing signals to the computer program to process the signals. To do that, we fetch in information through the input channels so that the computer can use the input to further process the information. See the diagram below.
Note that up to this point you don't need to understand any of the content presented above; it's for illustration purpose only and you don't need to understand it, nor do you need to memorize it either. In other words, you don't need to memorize the terms presented above. It's for illustration purpose only.
However, starting from the diagram below, you'll need to understand the context of the illustration and its meaning.
As you can see, this is a very simple model to illustrate how neural network works. Starting from the left side neuron is where information is fetched in (or bring in or input in) to be processed. Next, the middle neuron (ellipse x 180) is where all the first layer of processing takes place. In this layer, we have only one input ; and therefore, there is only one processing task to do. And that is, to multiply the input obtained from the circle on the left by an arbitrarily value called weight. Notice that I put x 180 in the ellipse diagram to show that 180 is my weight to be multiplied by the input. I will come back to discuss weight in a little bit later.
So if the input is 2, 2 x 180 = 360.
If the input is 5, 5 x 180 = 900.
If the input is 10, 10 x 180 = 1800.
Simple enough?
Now about the weight: Just remember this:
Every input can contain a weight - but it doesn't have to.
Now that we have the result we can pass it to the output which is denoted as a circle with letter 'y' under it on the right side. And that is the final result.
Now a little more sophisticated neuron. This time we have three input neurons, labeled x1, x2, x3, and everything else stays the same. [Disregard the letter 'b' in the middle layer. It's my typo]:
We need to do the same thing as we did with our simple neuron, and that is, to multiply the input obtained from each input value on the left by an arbitrarily weight value that we can assign. Again, I'll come back to this weight in a little bit.
So the idea is that you take each input and multiply it by its weight. You do this for all the inputs and then once you got all the results from the multiplications, you add them all up to get the final result. This is called the weighted sum.
Now assuming we assign a weight value of 100 for the first input, x1, a weight value of 20 for the second input, x2, and a weight value of 50 for the third input, x3, we obtain the multiplication results as follow:
So if the first input, x1, is 2, 2 x 100 = 200.
If the second input, x2, is 5, 5 x 20 = 100.
If the third input, x3, is 10, 10 x 50 = 500.
Now we have three results, but we can't have three results; so we need to normalize it by what is called the weighted sum. So add all the neurons together to get the result so that we can pass it on to the output. So 200 + 100 + 500 = 800. So the output y = 800. That is it!
Simple enough?
We're moving right along. This time, we have three input neurons, four hidden neurons in hidden layer 1 , four hidden neurons in hidden layer 2, and the usual output layer which is just one output neuron.
Note that, as with the input and the hidden layers, the output can have limitless neurons. Here, it only illustrates one output neuron as to simplify the tutorial a little bit.
If you look at the diagram, you'll see three input neurons and the next layer, hidden layer 1, has four neurons. To get the result for each of the four neurons in hidden layer 1, we need to do a weighted sum for all three inputs, x1, x2, x3. For example:
I'm going to label each input using subscript like so, top to bottom: x1, x2, x3.
I'm going to label each weight using subscript like so, top to bottom: w1, w2, w3, w4.
Now we have three inputs, x1, x2, x3, and also we have four weights, w1, w2, w3, w4.
We can now do the multiplications and the weighted sums together in one step for each of the four neurons in the hidden layer 1:
But first, let's suppose that we have the three inputs, x1 = 2, x2 = 5, x3 = 10, and also we have the four weights, w1 = 100, w2 = 20, w3 = 8, w4 = 30.
We can do a weighted sum for the top neuron in hidden layer 1 like this: x1 * w1 + x2 * w1 + x3 * w1.
Do you see how a weighted sum works?
Each input has to be multiplied by each weight for each neuron. If you look at x1, it has four lines (or arrows) pointing to the four neurons in hidden layer 1.
Likewise, x2 has four lines (or arrows) pointing to the four neurons in hidden layer 1. And also, x3 has four lines (or arrows) pointing to the four neurons in hidden layer 1. Those lines represent weights for their respective neurons in hidden layer 1, from top to bottom: w1, w2, w3, w4..
See the arrows pointing from each input to each neuron. Follow the arrows in the diagram and you'll be okay.
I'm going to re-use the already drawn up diagram that was intended for another use in a later illustration. Here it is:
If you look at the diagram above, you'll see that each input (labelled as X1 or X2) has a weight (labelled as W1 or W2, respectively.) This is how they usually label each neuron and its weight and you should follow the same technique as shown here.
I've seen some people put each weight right inside the hidden layer, which is easier to visualize. If you look at the previous diagram that has three inputs and four neurons in hidden layer 1 and 2, you'll see that it makes a lot of sense to put the weight inside the hidden layer neurons.
But technically, inside a hidden layer is where you calculate activation function and may not be a good place to put the weight there. Not only that, inside a hidden layer is where you put the result from the multiplication of the input with its weight. And that result serves as an input for that hidden layer as well. So definitely it's not a good place to put the weight there.
If it is easier to visualize it, then it's okay to put your weight there. There is nothing wrong with that! But I recommend follow the traditional way of doing so that you don't stray too far away from the usual way of doing.
For the previous diagram that has three inputs and four neurons in hidden layer 1 and 2, you can just put the weight right on each line that leads to the arrow pointing to the neuron in the hidden layer 1 or 2.
Notice that in the previous diagram that has three inputs and four neurons in hidden layer 1 and 2, each input has four lines connecting from each input and leading to each neuron in hidden layer 1 and 2. Those four lines are where you put the weights on [right on each line]: just label it, top to bottom, like so: w1, w2, w3, w4.
If you look at the previous diagram that has three inputs and four neurons in hidden layer 1 and 2, I just told you to just put each weight on each line for all four neurons [using proper subscripts], which means that for hidden layer 1 and 2, those weights: w1, w2, w3, w4 stay the same for both hidden layer 1 and 2, and that is not correct.
Factually, each hidden layer has its own weights, so by me telling you to label your weights containing the same subscripts is factually incorrect. In other words, telling you to label weights for hidden layer 1 as w1, w2, w3, w4 and [also] hidden layer 2 as w1, w2, w3, w4 is incorrect. All hidden layers have different sets of weight.
But my intention is to help you understand the concept visually [this early in the stage] even thought technically it is incorrect. Later on, you'll learn how to label your neurons (including their weights) properly using subscripts. For now, just label it as shown above so that you can visualize it clearly.
Getting back to the weighted sum: After the multiplications, add them all up.
Now plug the values into the equation and we get 1700: 2 * 100 + 5 * 100 + 10 * 100 = 1700.
A weighted sum for the second neuron from the top in hidden layer 1 like this: x1 * w2 + x2 * w2 + x3 * w2.
Notice that each input, in this case, each x1 or each x2 or each x3 has to be multiplied by a weight, in this case, w2. Follow the arrows in the diagram for all the inputs and continue this same process for all other neurons in the hidden layers as well.
Pluging the values into the equation and we get 340: 2 * 20 + 5 * 20 + 10 * 20 = 340.
A weighted sum for the third neuron from the top in hidden layer 1 like this: x1 * w3 + x2 * w3 + x3 * w3.
Pluging the values into the equation and we get 136: 2 * 8 + 5 * 8 + 10 * 8 = 136.
A weighted sum for the fourth neuron from the top (or the bottom neuron) in hidden layer 1 like this: x1 * w4 + x2 * w4 + x3 * w4.
Pluging the values into the equation and we get 510: 2 * 30 + 5 * 30 + 10 * 30 = 510.
Now we have the results for each of the four neurons in hidden layer 1. These four results serve as input neurons for each of the neurons in hidden layer 2. This is called feed forward or forward propagation -- a process of passing the result from one layer to the next. More on feed forward or forward propagation later.
Let's use these four results as input neurons for hidden layer 2, x1 = 1700, x2 = 340, x3 = 136, x4 = 510, and also we have the four new assinged weights, w1 = 3, w2 = 1, w3 = 4, w4 = 6 for each of the four neurons in hidden layer 2.
We can now do a weighted sum for the top neuron in hidden layer 2 like this: x1 * w1 + x2 * w1 + x3 * w1 + x4 * w1.
Notice that now we have four inputs in this hidden layer, hidden layer 2, since the four results we've got from hidden layer 1 serve (or feed) as input neurons for hidden layer 2.
Pluging the values into the equation and we get 8,058: 1700 * 3 + 340 * 3 + 136 * 3 + 510 * 3 = 8,058.
A weighted sum for the second neuron from the top in hidden layer 2 like this: x1 * w2 + x2 * w2 + x3 * w2 + x4 * w2.
Pluging the values into the equation and we get 2,686: 1700 * 1 + 340 * 1 + 136 * 1 + 510 * 1 = 2,686.
A weighted sum for the third neuron from the top in hidden layer 2 like this: x1 * w3 + x2 * w3 + x3 * w3 + x4 * w3.
Pluging the values into the equation and we get 10,744: 1700 * 4 + 340 * 4 + 136 * 4 + 510 * 4 = 10,744.
A weighted sum for the fourth neuron from the top (or the bottom neuron) in hidden layer 2 like this: x1 * w4 + x2 * w4 + x3 * w4 + x4 * w4.
Pluging the values into the equation and we get 16,116: 1700 * 6 + 340 * 6 + 136 * 6 + 510 * 6 = 16,116.
This time, we get four results for each of the four neurons in hidden layer 2. We can continue this same process for all other hidden layers if we have more hidden layers to be processed, but in this case, we only have two hidden layers and we come to an end of the hidden layers processing, so we need to normalize the four results by adding them all up and pass the result on to the output layer as the final output result. I won't do the actual math result for the output layer since it is self-explanatory.
Code Illustration
Now that you know how neurons work, let's see how to handle inputs and outputs so that we can do a weighted sum. How do we handle inputs and outputs?
Answer: use arrays to store inputs, outputs, and as well as weights [and biases]. For example, if we have three inputs as the diagram shown earlier, and now shown again below, which looks like this: x1, x2, x3, we put a '3' in the array like this: [3].
That '3' represents three input neurons: x1, x2, x3.
Here is the diagram that was shown earlier, and now shown here again below:
What about the hidden layers?
Well, we have two hidden layers with four neurons each, so we'll just put those numbers of neurons in the array like this: [3, 4, 4].
Now if we have more hidden layers, we can just put the numbers in the array seperating each hidden layer inputs with a comma "," as we did with the above example. Self-explanatory!!!
What about the output layers?
Well, it depends on what output layers we're talking about. If we're talking about the outputs from the hidden layers, we use the same array as shown above; and if we're talking about the final output layer, then we need another array to store the output for the final output layer.
The complete array example for the diagram shown above should look like this: [3, 4, 4, 1].
Remember that output neurons from one layer act as input neurons for the next layer.
As you can see the array contains three input neurons, four input/output neurons for the first hidden layer, four input/output neurons for the second hidden layer; and finally, one output neuron for the final output layer.
Let's see code example:
Handle NeuralNetwork Inputs and Outputs
<?php
/**
 *  The array is passed in a constructor of the neural network class, for example:
 *
 *  $net = new NeuralNetwork([3, 4, 4, 1]);
 *
 *  More on classes NeuralNetwork and Layer later
 */

// Inside the constructor of class NeuralNetwork, we can do this:

// with $constructor_array_param containing [3, 4, 4, 1]

$this->input[0] = $constructor_array_param[0]; // 3
$this->input[1] = $constructor_array_param[1]; // 4
$this->input[2] = $constructor_array_param[2]; // 4
$this->input[3] = $constructor_array_param[3]; // 1

// this is how we can create hidden layers inside class NeuralNetwork's constructor:

// remember that output neurons from one layer act as input neurons for the next layer

// this is the input layer with three input neurons and four output neurons
$hidden_layer[0] = new Layer($this->input[0], $this->input[1]); // Layer(3, 4)

// this is the first hidden layer with four input/output neurons
$hidden_layer[1] = new Layer($this->input[1], $this->input[2]); // Layer(4, 4)

// if we have more hidden layers we can just create more instances of class Layer
// and passing the appropriate input/output neurons to the constructor of class Layer

// this is the second hidden layer with four input neurons, and one final output neuron
$hidden_layer[2] = new Layer($this->input[2], $this->input[3]); // Layer(4, 1)
?>
More code examples later.
PerceptronPerceptron, invented in 1957 by Frank Rosenblatt at the Cornell Aeronautical Laboratory, is the simplest neural network possible: a computational model of a single neuron output. A perceptron consists of one or more inputs, a some sort of computational processor, and a single output.
What we've learned thus far is called a perceptron neural network -- a neural network that has one or more inputs, one or more hidden layers, and only one output. If you hear people mentioning a perceptron neural network, that's what they mean: a neural network that has only one output.
So a key point to remember is that if a neural network has only one ouptut it is called a perceptron neural network. Perceptrons are incredibly limited in their abilities. A perceptron can only solve linearly separable problems.
What's a linearly separable problem?
To avoid getting in too deep into the theory and techical aspect of a perceptron neural network and the use of the term "linearly separable problem," I will defer it to be discussed later. Note that the use of the concept of "perceptron" in a neural network is not that significant beside the concept of a "linearly separable problem," and you don't need to worry about emphasizing the term when dealing or talking about neural network in general. For the rest of the tutorial, you probably won't hear me mentioning it that much--only when it is necessary to do so when we discuss the concept of a "linearly separable problem."
In Summary
The leftmost layer in this network is called the input layer, and the neurons within the layer are called input neurons. The rightmost or output layer contains the output neurons, or, as in this case, a single output neuron. The middle layers are called hidden layers, since the neurons in these layers are neither inputs nor outputs. The term "hidden" perhaps sounds a little mysterious -- the first time I heard the term I thought it must have some deep philosophical or mathematical significance -- but it really means nothing more than "not an input or an output."
Another term that you might have heard of is Deep Learning. A Deep Learning refers to the depth of the hidden layers, usually more than five hidden layers and can be hundreds of hidden layers. Hundreds? Now that's very deep! I don't think anyone has implemented a program that deep thus far. Three to five hidden layers are hard enough for most of us, anything larger than five is considered deep learning.
Thus far, we've only seen one output neuron, but like input and hidden layers neurons, output neurons can be limitless as well. An example of this is that, where you program a handwritten digits recorgnition program to recorgnize a human handwritten digits 0(zero) to 9 and alphabet letters a-z or A-Z. So obviously the output should be 62 neurons: 10 digits + 26 lowercase letters + 26 uppercase letters. If for digits only, the output should be only 10 neurons. You get the idea!
Let's see code example for the above diagram:
Handle NeuralNetwork Inputs and Outputs
<?php
/**
 *  The array is passed in a constructor of the neural network class, for example:
 *
 *  $net = new NeuralNetwork([6, 4, 3, 1]);
 *
 *  More on classes NeuralNetwork and Layer later
 */

// Inside the constructor of class NeuralNetwork, we can do this:

// with $constructor_array_param containing [6, 4, 3, 1]

$this->input[0] = $constructor_array_param[0]; // 6
$this->input[1] = $constructor_array_param[1]; // 4
$this->input[2] = $constructor_array_param[2]; // 3
$this->input[3] = $constructor_array_param[3]; // 1

// this is how we can create hidden layers inside class NeuralNetwork's constructor:

// remember that output neurons from one layer act as input neurons for the next layer

// this is the input layer with six input neurons and four output neurons
$hidden_layer[0] = new Layer($this->input[0], $this->input[1]); // Layer(6, 4)

// this is the first hidden layer with four input and three output neurons
$hidden_layer[1] = new Layer($this->input[1], $this->input[2]); // Layer(4, 3)

// if we have more hidden layers we can just create more instances of class Layer
// and passing the appropriate input/output neurons to the constructor of class Layer

// this is the second hidden layer with three input neurons, and one final output neuron
$hidden_layer[2] = new Layer($this->input[2], $this->input[3]); // Layer(3, 1)
?>
More code examples later.
Introduction to Biases
In a typical artificial neural network each neuron in one "layer" is connected -- via a weight -- to each neuron in the next neuron in the next layer. Each of these neurons stores some sort of computation, normally a weighted sum in previous layers [as you'd already seen how it was done].A bias unit is an "extra" neuron added to each pre-output layer to influence the outcome of a particular neuron. Bias units aren't connected to any previous layer and in this sense don't represent a true "connected" neuron. Biases are units that are added to the result of the weighted sum to influence the outcome of the output of a particular neuron in a particular layer.
Think of a bias as an ingredient of a cooked food to make the food tastes much better. For example, you put some salt, pepper, chredded cheddar cheese, etc, to your cooked food (e.g., fish, spaghetti, sirloin, rips, etc) to make it more delicious.
Biases are optional inputs and not required to be added to any neuron in any layer if the neural network doesn't need it. You will run into some neural network programs that don't use biases and also you will run into some that will require the use of biases.
Let's start with a very simple diagram of a neuron with a bias:
As you can see, the neural network contains one input, one weight, one bias, and one output neuron. From the diagram, you know the drill: you do a weighted sum and once you got the sum, you add a bias value to it and pass it on to the output.
Simple enough?
Here is a two-input neuron:
Again, you know the drill: you do a weighted sum for both the input neurons and once you got the sum, you add a bias value to it and pass it on to the output.
Here is the same two-input neuron with the labels of the attributes:
As you can see within the huge circle the equation is given: f(w1 * x1 + w2 * x2 + b1).
The 'f' before the equation is a symbol to represent a function. In this case, the function is to perform the weighted sum and add the bias to it.
Thus far we've only showed only one neuron in the first hidden layer. No big deal, we can use the examples shown thus far to implement as many hidden layers with as many neurons in each hidden layer as we need by doing the usual weighted sum and tack on a bias for each hidden layer that contain any number of neurons. See the diagram below:
As you can see, we have 4 input neurons and a bias input at the top as a red circle with the value of 1. The bias values are arbitrarily set by the programmer and depending on the neural network program logic, the bias value can be whatever the logic dictates. Think of an analogous example of food tastes earlier: you put too much or too little salt, the food doesn't taste good, so you have to put just the right amount of salt in order to get the food to taste good. The bias is the same thing.
We also have 4 neurons in the first hidden layer. If we have more hidden layers, we can just use this diagram as an example and implement them as we did here. I think you know the drill.
The Output:
Again, biases are optional and if your output needs a bias, you'll have to implement one, too:
Notice that in the diagram the biases are shown at the bottom with the values of +1. The biases can be positive or negative, depending on your application's logic. In this diagram, the biases are positive or increase the result further. Remember the salt and pepper? In this example, we're adding two biases: salt and peppper, respectively.
Let's see code example for the above diagram to include biases:
Handle NeuralNetwork Inputs, Outputs, and Biases
<?php
/**
 *  The array is passed in a constructor of the neural network class, for example:
 *
 *  $net = new NeuralNetwork([3, 3, 1]);
 *
 *  More on classes NeuralNetwork and Layer later
 */

// Inside the constructor of class NeuralNetwork, we can do this:

// with $constructor_array_param containing [3, 3, 1]

$this->input[0] = $constructor_array_param[0]; // 3
$this->input[1] = $constructor_array_param[1]; // 3
$this->input[2] = $constructor_array_param[2]; // 1

$this->bias[0] = $constructor_array_bias[0]; // 1

// this is how we can create hidden layers inside class NeuralNetwork's constructor:

// remember that output neurons from one layer act as input neurons for the next layer

// also, we can create the constructor of class Layer with three arguments to accomodate the biases
// for example, public function __construct($numberOfInput, $numberOfOuput, $bias[] = null)

// then we can create instances of class Layer with three parameters: $numberOfInput, $numberOfOuput, $bias[]

// this is the input layer with three input and three output neurons
// Layer(3, 3, 1) <--- notice the last argument '1' is the bias
$hidden_layer[0] = new Layer($this->input[0], $this->input[1], $this->bias[0]);

// this is the first and only hidden layer with 3 input neurons, and one final output neuron
// Layer(3, 1, 1) <--- notice the last argument '1' is the bias
$hidden_layer[1] = new Layer($this->input[1], $this->input[2], $this->bias[0]);
?>
More code examples later.
Introduction to Weight
In machine learning, a weight is a criterio that you set to influence the outcome of the input. For example, if the input is 5 and you set the weight criterio at 2 then the outcome of the input (5) is twice as large (5 x 2 = 10). It weights the input to produce a different outcome.The most difficult thing to do in setting the weight is to come up with what weight you should set for your particular criterio for your particular application. It amounts to a trial-and-error type of guesswork on your part to come up with a reasonable set of weights. To illustrate this, let's see an example.
Suppose that your boss asks you to write a machine learning program for a client of the company to perform an insurance policy to determine how much it should charge a particular prospective policy holder. You begin by assemblying all the criterios and assign each criterio a weight. This should looks like the following:
There are two input neurons for the prospective policy holder:
- Male. Males are typically more aggressive drivers than females so the weight should be higher than females. So we'll give males a 2 as the input neuron.
- Female. Females are typically less aggressive drivers than males so the weight should be lower than males. And we'll give females a 1 as the input neuron.
The next input neurons are hidden layers for the prospective policy holder. And we'll start with the first hidden layer. This is for the age group neurons. Again, younger drivers tend to be more reckless drivers than older drivers according to statistics. So we'll have to assign a weight scale for each driver using a scale of 0 to 10, with 10 being the most reckless drivers and 0 being the very least or non-reckless drivers.
Make note that in real machine learning applications, you'll probably would assign the weight scales of somewhere between 0.0 and 1.0. Here are the criterios:
- Age: 18 and under. So we'll have to assign a weight scale of 10 for this age group of drivers. In real machine learning applications: 1.0
- Age: 19 - 25. So we'll have to assign a weight scale of 8 for this age group of drivers. In real machine learning applications: 0.8.
- Age: 26 - 35. So we'll have to assign a weight scale of 5 for this age group of drivers. In real machine learning applications: 0.5
- Age: 36 - 45. So we'll have to assign a weight scale of 2 for this age group of drivers. In real machine learning applications: 0.2
- Age: 46 and older. So we'll have to assign a weight scale of 0 for this age group of drivers. In real machine learning applications: 0.0.
The next hidden layer is the second hidden layer. This is for annual income level neurons.
Generally, low income drivers tend to be more reckless drivers than higher income drivers according to statistics. So we'll have to assign a weight scale for each driver using a scale of 0 to 10, with 10 being the most reckless drivers and 0 being the very least or non-reckless drivers:
- $0 - $9,999. So we'll have to assign a weight scale of 10 for this income group of drivers.
- $10,000 - $29,999. So we'll have to assign a weight scale of 8 for this income group of drivers.
- $30,000 - $49,999. So we'll have to assign a weight scale of 5 for this income group of drivers.
- $50,000 - $99,999. So we'll have to assign a weight scale of 2 for this income group of drivers.
- $100,000 - up. So we'll have to assign a weight scale of 0 for this income group of drivers.
Now that we have all the criterios and its weights, we can plug the values in the equations as we did in the previous sections.
Notice that I'm recycling the old diagram to illustrate the example. I'm too lazy to draw another one.
The three input neurons on the left side, from top to bottom, are male (2), female (1), bias (1).
If you look at the diagram above, it has three input neurons [including a bias input] and two hidden layers, each having four neurons. But the bias can be passed in via the constructor of class Layer. The bias in not part of the input. So in actuality for the insurance policy example, it has only two inputs (male, female) and not bias (as shown in the diagram).
Notice that I intentionally created five neurons each for both of the hidden layers because I wanted to illustrate that hidden layers can have any number of neurons based on your application's criterio. I could have made the two hidden layers four neurons each or I could have made them any number of neurons based on the application's criterio.
That's what happens when you're too lazy to draw a new diagram: you have to deviate from the reality.
If I were to teach a live class, I would cut the lesson off right now and instruct my students to do a homework by computing the output of this insurance policy program. Everything is all setup and ready to be computed to get the final result.
Hint: Each result should produces a unique result for the majority of the time because each driver's profile is unique, such as age group, income, and gender [the Oxford comma stylistic grammar writing.]
To Do:
As an exercise further, you can implement additional hidden layers by including more criterios, such as a credit score of the prospective drivers and driving history, e.g., if any past accidents, traffic violations, etc. For example, to implement the credit scores as the third hidden layer, you can set up the criterios like the following.
The lower the FICO score for the prospective drivers the more reckless drivers can be according to statistics:
- FICO Score: lower than 500. So we'll have to assign a weight scale of 10 for this FICO score group of drivers.
- FICO Score: 500 - 549. So we'll have to assign a weight scale of 8 for this FICO score group of drivers.
- FICO Score: 600 - 649. So we'll have to assign a weight scale of 5 for this FICO score group of drivers.
- FICO Score: 650 - 699. So we'll have to assign a weight scale of 2 for this FICO score group of drivers.
- FICO Score: 700 - 749. So we'll have to assign a weight scale of 1 for this FICO score group of drivers.
- FICO Score: 750 and higher. So we'll have to assign a weight scale of 0 for this FICO score group of drivers.
To implement the past driving history as the fourth hidden layer, you can set up the criterios like the following.
Again, the more traffic incidents for the prospective drivers the more reckless drivers can be according to statistics:
- Traffic Violations: 1 or more in past 12-month or 3 or more in past 5 years. Notice the use of 'OR'. So we'll have to assign a weight scale of 10 for this traffic violations group of drivers.
- Traffic Violations: none in past 12-month and 3 or more in past 5 years. So we'll have to assign a weight scale of 8 for this traffic violations group of drivers.
- Traffic Violations: 1 in past 12-month and no more than 1 in past 5 years. Notice the use of 'AND'. So we'll have to assign a weight scale of 5 for this traffic violations group of drivers.
- Traffic Violations: none in past 12-month and none in past 5 years. Notice the use of 'AND'. So we'll have to assign a weight scale of 0 for this traffic violations group of drivers.
Let's see code example for the above insurance policy:
Handle NeuralNetwork Inputs and Outputs and Possibly Including Biases
<?php
/**
 *  The array is passed in a constructor of the neural network class, for example:
 *
 * two inputs: male, female
 * 5 neurons in first hidden layer: age group
 * 5 neurons in second hidden layer: income group
 * 6 neurons in third hidden layer: FICO score group
 * 4 neurons in fourth hidden layer: driving record group
 * 1 neurons in the final output layer
 *
 *  $net = new NeuralNetwork([2, 5, 5, 6, 4, 1]);
 *
 *  More on classes NeuralNetwork and Layer later
 */

// Inside the constructor of class NeuralNetwork, we can do this:

// with $constructor_array_param containing [2, 5, 5, 6, 4, 1]

$this->input[0] = $constructor_array_param[0]; // 2
$this->input[1] = $constructor_array_param[1]; // 5
$this->input[2] = $constructor_array_param[2]; // 5
$this->input[3] = $constructor_array_param[3]; // 6
$this->input[4] = $constructor_array_param[4]; // 4
$this->input[5] = $constructor_array_param[5]; // 1

// this is how we can create hidden layers inside class NeuralNetwork's constructor:

// remember that output neurons from one layer act as input neurons for the next layer

// also, we can create the constructor of class Layer with three arguments to accomodate the biases
// for example, public function __construct($numberOfInput, $numberOfOuput, $bias[] = null)

// then we can create instances of class Layer with three parameters: $numberOfInput, $numberOfOuput, $bias[]

// this is the input layer with two input and five output neurons
// Layer(2, 5, 1) <--- notice the last argument '1' is the bias
// $hidden_layer[0] = new Layer($this->input[0], $this->input[1], $this->bias[0]);

// this is the input layer with two input and five output neurons
$hidden_layer[0] = new Layer($this->input[0], $this->input[1]); // Layer(2, 5)

// this is the first hidden layer with five input/output neurons
$hidden_layer[1] = new Layer($this->input[1], $this->input[2]); // Layer(5, 5)

// this is the second hidden layer with five input and six output neurons
$hidden_layer[2] = new Layer($this->input[2], $this->input[3]); // Layer(5, 6)

// this is the third hidden layer with six input and four output neurons
$hidden_layer[3] = new Layer($this->input[3], $this->input[4]); // Layer(6, 4)

// if we have more hidden layers we can just create more instances of class Layer
// and passing the appropriate input/output neurons to the constructor of class Layer

// this is the fourth hidden layer with four input neurons, and one final output neuron
$hidden_layer[4] = new Layer($this->input[4], $this->input[5]); // Layer(4, 1)
?>
More code examples later.
There you have it! Have a go at it!To Do:
As another exercise that will help you learn better is to come up with your own application problems to solve using the knowledge you'd learned thus far, particularly, the insurance policy example. And one of them is a problem of predicting annual income based on the number of years of higher education someone has completed.
You could come up with some rules about degree type, years of work experience, school tiers, etc. Even school choices do play a role in computing a person's income potential.
For example, for the input neurons, you could use gender: male or female, with male as a higher input number than female, because males tend to earn higher salaries, even at the entry point, according to statistics.
To implement hidden layers, you can set up rules or criterios like degree type, years of work experience, school tiers [Ivy league, graduate, undergraduate, community college, specialized schools], etc.
So I'm going to leave it idle for awhile for now. When I have spare time I will come back and give you the final output of this insurance policy program, including a complete source code writen in PHP so that you see how it is implemented.
Introduction to Forward Propagation
Forward propagation is a process of using the result from the previous layer and pass it on to the next layer. The layers processing that we learned thus far is called forward propagation. For example, if we have several layers as we did in the insurance policy example, the result from calculating the input layer -- which takes place in the first layer -- is passed on or propagated as input to the second layer to be calculated and the result from the second layer is propagated as input to the third layer, and the process of layer calculation and propagation continues to every layer until there isn't any more layers to be calculated and propagated.So forward propagation is a process of accumulating all results and passing the result from one layer to the next until it reaches the final output -- it propagates or passes along the result from one layer to the next. Forward propagation is also known as Feed Forward propagation, and likewise, Backward propagation is also known as Feed Backward propagation.
Forward Propagation Processing Code
Now that we know how forward propagation works, let's see some code example of how it is done. I'm going to use PHP to demonstrate this, but you can translate this PHP code to any programming language of your choice.For more information on PHP neural network library, pleace check the following out, particularly the matrix and transpose functions and the MNIST dataset for handwritten digits recorgnition: PHP Machine Learning Library
First, we need to write a very simple class called NeuralNetwork which is the main neural network class that basically handles everything for us. Note that some of the code shown below include topics we haven't discussed yet, such as backward propagation, activation functions, etc. Here is the class:
Main NeuralNetwork Class
<?php
/**
 *  file: neuralnetwork.php
 *
 *  Simple MLP (Multi-layers Perceptron) Neural Network
 */
class NeuralNetwork
    {
     private $input = array(); // input information which contains the # of input items
     private $hidden_layer = array(); // holds the # of layers in the network

     /**
      * Constructor setting up layers
      * A calling program needs to create an instance of this class and passing
      * input layer, hidden layers, and output layer.
      *
      *  Usage:
      *
      *  $net = new NeuralNetwork([3, 25, 25, 1 ]);
      *
      *  After that, we need to call FeedForward() and BackPropagation().
      *  in this example, we pass the known value of XOR function as an array:
      *
      *  $net.FeedForward([ 0, 0, 0 ]);
      *  $net.BackPropagation([ 0 ]);
      *
      *  we can train some more:
      *
      *  $net.FeedForward([ 0, 0, 1 ]);
      *  $net.BackPropagation([ 1 ]);
      *
      *  $net.FeedForward([ 0, 1, 0 ]);
      *  $net.BackPropagation([ 1 ]);
      *
      *  $net.FeedForward([ 0, 1, 1 ]);
      *  $net.BackPropagation([ 0 ]);
      *
      *  $net.FeedForward([ 1, 0, 0 ]);
      *  $net.BackPropagation([ 1 ]);
      *
      *  $net.FeedForward([ 1, 0, 1 ]);
      *  $net.BackPropagation([ 0 ]);
      *
      *  $net.FeedForward([ 1, 1, 0 ]);
      *  $net.BackPropagation([ 0 ]);
      *
      *  $net.FeedForward([ 1, 1, 1 ]);
      *  $net.BackPropagation([ 1 ]);
      *
      * @param $input Layers of this network
      */

     // notice the type-hint which indicates $input is an array variable
     // example usage: $net = new NeuralNetwork([3, 25, 25, 1 ]);
     // or: $net = new NeuralNetwork([784, 25, 25, 1 ]); // 784 inputs? (28 pixels * 28 pixels)

     public __construct(array $input)
          {
           // initialize input layers that were passed in by the calling program
           for ($i = 0; $i < sizeof($input); $i++)
               {
                // $input argument contains: 3 inputs, 25 neurons in hidden layer 1,
                // 25 neurons in hidden layer 2, 1 output
                // store each argument in this class' array variable $input
                $this->input[$i] = $input[$i];
               }
               /*
                the for() loop above result in the following initialization:
                $this->input[0] = 3;
                $this->input[1] = 25;
                $this->input[2] = 25;
                $this->input[3] = 1;
               */

           // creates a bunch of neural network hidden layers,
           for ($i = 0; $i < count($input) - 1; $i++)
               {
                // for each argument in [count($input)], create a Layer object passing
                // this class' array variable $input
                // in other words, create one Layer object for the input layer (index 0),
                // one for the first hidden layer (index 1),
                // one for the 2nd hidden layer (index 2),
                // leaving the output (index 3) uneffected.
                // follow the for() loop iteration to make sense of all this statement:

                $this->hidden_layer[$i] = new Layer($this->input[$i], $this->input[$i + 1]);
               }
           /*
            the for() loop above result in the following initialization:
            // input = 3, hidden layer = 25 => (3, 25)
            $this->hidden_layer[0] = new Layer($this->input[0], $this->input[0 + 1]);
            // hiddenl = 25, hiddenl = 25 => (25, 25)
            $this->hidden_layer[1] = new Layer($this->input[1], $this->input[1 + 1]);
            // hiddenl = 25, hidden layer = 25 => (25, 1)
            $this->hidden_layer[2] = new Layer($this->input[2], $this->input[2 + 1]);
            // so this last index is not iterated because of count($input) - 1, which is
            // when $i = 3. 3 < 3 is false,
            // so this last line is not executed at last iteration
            // hidden l = 25, hidden layer 2 = 25 => (1, null)
            // again, follow the for() loop iteration to make sense of all this statement:

            $this->hidden_layer[3] = new Layer($this->input[3], $this->input[3 + 1]);
           */
          }

     /**
      *  A feedforward for this network
      *  this function is called by the training application to kickstart the process:
      *
      *  // notice the argument is passed in as an array and the array
      *  can contain limitless size. here, we pass in five layers.
      *  notice that we have two hidden layers 25 neurons each.
      *  if we have more hidden layers we can pass in more arguments seperate each
      *  argument with a comma, e.g.:  784 (inputs),
      *  (five hidden layers:) 25, 25, 8, 4, 17, (and one output:) 1
      *
      *  for example:
      *  new NeuralNetwork([784, 25, 25, 8, 4, 17, 1 ])
      *
      *  Now back to our original example:
      *
      *  Usage:
      *
      *  $net = new NeuralNetwork([3, 25, 25, 1 ]);
      *
      *  calling FeedForward() passing the known answer. in this example, we're
      *  calling FeedForward() and passing the known value as an array.
      *  you can pass in your actual number sets to train, but in this case, we just
      *  pass in an XOR function values (analogous to an "Hellow World" example): 0, 0, 0
      *
      *  $net.FeedForward([ 0, 0, 0 ]);
      *
      *  so all applications need to call this so called "train" function to start the process.
      *  some programmers like to name this function as "train()" but I like "FeedForward()"
      *
      *  @param $input # of inputs to be feed forward
      */
     // this function acts as a train() function to train or jumpstart the process
     public FeedForward($input)
          {
           // feed forward. notice the call to FeedForward -- it's not a recursive call, but
           // rather, it is actually calling Layer's FeedForward($input) because
           // $this->hidden_layer[0] refers to Layer's object

           $this->hidden_layer[0]->FeedForward($input);

           // so after the above call to FeedForward($input),
           // Layer's $output should contains a weighted sum of the input

           for ($i = 1; $i < count($this->hidden_layer); $i++)
               {
                // start with the 2nd Layer object instance (index 1) and call
                // Layer's FeedForward() passing the output of layer 0

                $this->hidden_layer[$i]->FeedForward($this->hidden_layer[$i - 1]->output);
               }

           // return the output of the last layer
           return $this->hidden_layer[$i - 1]->output; // $i = 3
          }

     /**
      *  High level back propagation
      *  Note: It is expected the one feed forward was done before this back prop.
      *  @param $expected The expected output form the last feedforward
      */
     // notice that $expected is the known answer passed in by calling code
     public BackPropagation($expected)
          {
           // run over all layers backwards. notice that the for() loop starts from
           // the total number of hidden layers and iterated downward to 0
           for ($i = sizeof($this->hidden_layer) - 1; $i >= 0; $i--)
               {
                if ($i == sizeof($this->hidden_layer) - 1)
                   {
                    // doing a backward propagation output
                    $this->hidden_layer[$i]->BackPropagationOutput($expected);
                   }
                else
                   {
                    //back prop hidden
                    $this->hidden_layer[$i]->BackPropagationHidden($this->hidden_layer[$i +
                                                                               1]->gamma,

                    $this->hidden_layer[$i + 1]->weight);
                   }
               }

           //Update weights
           for ($i = 0; $i < sizeof($this->hidden_layer); $i++)
               {
                $this->hidden_layer[$i]->UpdateWeight();
               }
          } // end BackProp($expected)
    } // end class NeuralNetwork

/**
 *  Each individual layer in a ML (Multi-Layer) perceptron
 */
class Layer
    {
     public $numberOfInput; // # of neurons in the previous layer
     public $numberOfOuput; // # of neurons in the current layer

     public $output = array(); // outputs of this layer
     public $input_layer = array(); // inputs in into this layer
     public $weight[][]; // weights of this layer, a two-dimensional array
     public $weightDelta[][]; // deltas of this layer, a two-dimensional array
     public $gamma = array(); // gamma of this layer
     public $error = array(); // error of the output layer

     public static $random = new rand(); // Static random class variable

     /**
      *  Constructor initilizes various data structures
      *
      *  @param $numberOfInput Number of neurons in the previous layer
      *  @param $numberOfOuput Number of neurons in the current layer
      *
      *  note that $this->input refers to NeuralNetwork's member array variable $input
      *  // input = 3, hidden layer = 25 => (3, 25)
      *  $this->hidden_layer[0] = new Layer($this->input[0], $this->input[0 + 1]);
      *  // hiddenl = 25, hiddenl = 25 => (25, 25)
      *  $this->hidden_layer[1] = new Layer($this->input[1], $this->input[1 + 1]);
      *  // hidden l = 25, hidden layer 2 = 25 => (25, 1)
      *  $this->hidden_layer[2] = new Layer($this->input[2], $this->input[2 + 1]);
      *  // so this last index is not iterated because of count($input) - 1, which is
      *  // when $i = 3. 3 < 3 is false
      *  // hiddenl = 25, hidden layer = 25 => (1, null)
      *  $this->hidden_layer[3] = new Layer($this->input[3], $this->input[3 + 1]);
      *
      *  we're not implementing biases as of right now, but we can further down the road!
      */
     public __construct($numberOfInput, $numberOfOuput, $bias[] = null)
          {
           $this.numberOfInput = $numberOfInput; // 3 neurons from the previous layer
           $this.numberOfOuput = $numberOfOuput; // 25 neurons in the current layer

           //initialize data structures
           // these need to be refined and probably involve matrix manipulation
           // or we can use for loops to initialize the matrix:

           for ($i = 0; $i < $this->numberOfOuput; $i++)
               {
                for ($j = 0; $j < $this->numberOfInput; $j++)
                    {
                     // need to refine these
                     $this->weight[$i][$j] = 0;
                     $this->weightDelta[$i][$j] = 0;
                    }
               }

           // all it does above is initializing the array elements to their default values.
           // all the array elements are initialized to zero.

           $this->InitilizeWeight(); //initilize weights
          }

     /**
      *  Initilize weights randomly between -0.5 and 0.5
      */
     public InitilizeWeight()
          {
           for ($i = 0; $i < $this->numberOfOuput; $i++)
               {
                for ($j = 0; $j < $this->numberOfInput; $j++)
                    {
                     // you need to refine the following statment to suite your purpose!

                     // basically it needs to initialize the weight for each input so that
                     // it can be used to do a weighted sum for all inputs
                     // remember that each input is multiplied with its weight to make it a
                     // weighted input, and then sum all of the weighted inputs.

                     // the following line attempts to assign a weight to each input so that
                     // it can be used to do a weighted input and then they can be used to
                     // sum for all inputs: hence, weighted sum!

                     // you can probably do a better job by querying from a database that stores
                     // all the weights for each input, and then assign each weight to this statement!

                     // here, I just used a random weight from -0.5 to 0.5 for demonstration purpose only!

                     $this->weight[$i][$j] = rand(-0.5, 0.5);
                    }
               }
          }

     /**
      *  Feedforward this layer with a given input
      *
      *  @param $input The output values of the previous layer
      */
     public FeedForward($input)
          {
           // initialize the layers which can be used for backward propagation
           $this->input_layer = $input;

           // feed forward
           for ($i = 0; $i < $this->numberOfOuput; $i++)
               {
                $this->output[$i] = 0;
                for ($j = 0; $j < $this->numberOfInput; $j++)
                    {
                     // this is the output sum of the activation function: sigmoid, tanH,...
                     // this is where we can add a bias to the output sum
                     // $this->input_layer[$j] * $this->weight[$i][$j] + $this->bias[$j]

                     $this->output[$i] += $this->input_layer[$j] * $this->weight[$i][$j];
                    }

                // I need to refine and maybe use sigmoid() instead
                // $this->output[$i] = (float)Math.Tanh($this->output[$i]);

                $this->output[$i] = call_user_func_array(array('sigmoid', $this->output[$i]);
               }

           // in the calling code, it only returns output of the last layer even though (below)
           // we return the full array of output result. see FeedForward($input) earlier,
           // which returns $this->hidden_layer[$i - 1]->output; // $i = 3

           return $this->output;
          }

     /**
      *  Activation functions.
      *
      *  You can use other activation functions as well: sigmoid(), ReLU(), softmax, etc.
      *  Here are a few examples:
      *
      *	 public function sigmoid($x)
      *       {
      *        return 1 / (1 + pow(M_E, -$x));
      *       }
      *
      *  here is a derivative of sigmoid() above:
      *
      *  public function dsigmoid($y)
      *       {
      *        // return sigmoid($x) * (1 - sigmoid($x));
      *        return $y * (1 - $y);
      *       }
      *
      *  ReLU
      *
      *  public function relu($x)
      *       {
      *        //$x = $x > 0 ? 1 : 0;
      *        return $x > 0 ? 1 : 0;
      *       }
      *
      *  TanH:
      *
      *  public function getTanH($x)
      *       {
      *        // return the computed tanH()
      *        return tanh($x);
      *       }
      *
      * Or use it directly:
      *
      *      echo tanh(M_PI_4);    // output:  0.65579420263267
      *      echo tanh(0.50);      // output:  0.46211715726001
      *      echo tanh(-0.50);     // output: -0.46211715726001
      *      echo tanh(5);         // output:  0.9999092042626
      *      echo tanh(-5);        // output: -0.9999092042626
      *      echo tanh(10);        // output:  0.99999999587769
      *      echo tanh(-10);       // output: -0.99999999587769
      */

     /**
      *  TanH derivative - a derivative function for TanH
      *
      *  @param $value An already computed TanH value, for example: 0.65579420263267
      *
      *  Notice that to use this TanHDer() you first have to get the value of tanh() and
      *  then call this function passing the computed value to it. See example above.
      */
     public TanHDer($value)
          {
           return 1 - ($value * $value);
          }

     /**
      *  Back propagation for the output layer
      *
      *  @param $expected The expected output
      */
     public BackPropagationOutput($expected)
          {
           // Error derivative of the cost function
           for ($i = 0; $i < $this->numberOfOuput; $i++)
               {
                $this->error[$i] = $this->output[$i] - $expected[$i];
               }

           // Gamma calculation
           for ($i = 0; $i < $this->numberOfOuput; $i++)
               {
                $this->gamma[$i] = $this->error[$i] * $this->TanHDer($this->output[$i]);
               }

           // Caluclating delta weights
           for ($i = 0; $i < $this->numberOfOuput; $i++)
               {
                for ($j = 0; $j < $this->numberOfInput; $j++)
                    {
                     $this->weightDelta[$i, $j] = $this->gamma[$i] * $this->input_layer[$j];
                    }
               }
          }

     /**
      *  Back propagation for the hidden layers
      *
      *  @param $gammaForward the gamma value of the forward layer
      *  @param $weightFoward the weights of the forward layer
      */
     public BackPropagationHidden($gammaForward, $weightFoward[][])
          {
           // Caluclate new gamma using gamma sums of the forward layer
           for ($i = 0; $i < $this->numberOfOuput; $i++)
               {
                $this->gamma[$i] = 0;

                for ($j = 0; $j < count($gammaForward); $j++)
                    {
                     $this->gamma[$i] += $gammaForward[$j] * $weightFoward[$j, $i];
                    }

                $this->gamma[$i] *= $this->TanHDer($this->output[$i]);
               }

           // Caluclating detla weights
           for ($i = 0; $i < $this->numberOfOuput; $i++)
               {
                for ($j = 0; $j < $this->numberOfInput; $j++)
                    {
                     $this->weightDelta[$i, $j] = $this->gamma[$i] * $this->input_layer[$j];
                    }
               }
          }

     /**
      *  Updating weights
      */
     public UpdateWeight()
          {
           for ($i = 0; $i < $this->numberOfOuput; $i++)
               {
                for ($j = 0; $j < $this->numberOfInput; $j++)
                    {
                     // learning rate is hardcoded to 0.033
                     $this->weight[$i, $j] -= $this->weightDelta[$i, $j] * 0.033f;
                    }
               }
          }
    } // end class Layer
?>
Introduction to Backward Propagation
Backward propagation, as the name implies, propagates backward from the output layer and traversing backward to the input layer. To propagate backward we need to know the output result, which means that backward propagation is done after the forward propagation; because we need to know the result of the output so that we can use the result to calculate how many steps to go backward. In other words, to walk backward, we need to know how many steps we walk forward. Make sense?How do we determine how many steps that we walk forward or backward?
In machine learning, there is a classification concept called supervised and unsupervised learning. In a brief description, a supervised learning is where you classify the data for the machine to use that data to learn from.
In other words, you have a set of data and you fetch that data into the computer for it to use that data to learn and come up with the calculation that is as close to the data set (or model) as possible. Quite the opposite, in an unsupervised learning, you don't provide a set of data or model for the computer to learn from but instead the computer will guess on its own using algorithm you write. More on these later.
I don't want to dig too deep into supervised and unsupervised learning concept right now and will defer the topics to be discussed later in its entirety. In a supervised learning, we supply a known answer called a model to the problem and have the program calculates the layers and come up with the final result as close to the known answer as possible.
In other words, you tell the program: here is the final model that I want you to caculate your layers and make them fit my model. You show the computer your model and have the computer sees that model and learn to adjust its calculations to fit the model that you shown to it. Backward propagation is the heart and soul of machine learning using both supervised and unsupervised learning concepts.
So, to answer the question posed above, we use the output result as the starting point to calculate the total steps to count backward. To calculate how many steps to go backward, we subtract the output result from the known answer. The known answer is the model that you give it to your program to learn, and the output result is the layers processing that we'd learned in the previous sections.
For example, if your known answer or model is 100 and the result of the output layer is 80, then the steps backward is 20 (100 - 80). This 20 difference is called the error. Had the difference is zero, the propagation backward is not necessary because the layers processing did its job by getting the result to fit the model; and therefore, the program does not need to learn and adjust the error to a minimum.
So, the goal of the calculated layers is to have the error of 0 (zero) or close to it. By the way, the function that calculates the error is called the error function, and also known as the loss function, or the cost function. The three functions take the model (or known answer) and subtract the output from it to get the error, loss, or cost.
When they say the error, loss, or cost function, they really mean the same thing and they are being used interchangibly. With loss function calculates the loss of the model or how close to the model. And with the cost function calculates the cost of being accurate of the model or the accuracy (cost) of the model.
The known model is an arbitrarily value you set based on your program logic. For example, in the insurance program we can come up with a value of 500 or 1000 (or any number that seems reasonable) and subtract the result of the output from it. Once we get the result from the subtraction we can do some calculations to finalize or normalize the result.
From there, whatever criterio you come up with for your insurance policy calculations logic is up to you to get the final result of your program. In other words, your insurance policy criterio dictates how you go about in finalizing your final result or output.
At this point, the insurance policy discussion has reached its end and I won't use it in the discussion going forward from now on; because it won't work in the real world machine learning scheme of thing because the output number is too large to fit in the activation function scheme of thing. In order for the insurance program (as it stands right now) to work it needs to normalize the output number to be between 0 and 1 -- hence, the upcoming discussion of probability is relevant.
It was used to help you understand the concept of hidden layers and forward propagation. Backward propagation is a different story and it gets much more complex. Nonetheless, what we've learned thus far stays relevant for the ensuing topics.
Once we have the error, we can propagate backward using partial derivative calculus. In other words, we take a partial derivative of the error to find the steps backward. That sounds very scary: partial derivative? But don't be frightened by the look or sound of it, because once you've seen how it is done it becomes trivial; however, if you intend to program robust and powerful machine learning programs, you should take a brief tutorial on the web on the topic of partial derivative calculus.
A derivative (or partial derivative for that matter) is merely a rate of change from one point of propagation to the next. In other words, the partial derivative of the error is the rate of change in steps to propagate backward.
As far as backward propagation is concern, there is more to come. The description just described is just a brief overview to help you understand the concept. You will encounter the use of backward propagation on virtually every program you write because it is the cornerstone of machine learning.
Introduction to Probability
I'm being a little lazy for this tutorial; and therefore, I'll encourage you to watch the following excellent tutorials on YouTube. Machine learning makes use of probability a lot, so you need to be familiar with the concept: Machine Learning: Probability. Machine Learning: A Probability is a Number Between 0 and 1. Machine Learning: A Probability Line is a Number Between 0 and 1. Machine Learning: Why probability is always betwwen 0 and 1?Introduction to Activation Functions
Introduction to Supervised Learning
Introduction to Unsupervised Learning
Introduction to Linearly Separable Problem
Introduction to Gradient descent
To be continued ..... more to come!Please stay tuned!
What is a blockchain?
Before I answer that I want to dig deeper into how blockchain got its idea and foundation that led to the now famous lexicon bitcoin. Blockchain owes its origin to the Chinese Freedom struggle of the June 4, 1989, in Beijing's Tiananmen Square, in which, Chinese tanks rolled into the square to crush a student-led protest movement calling for greater political freedom; and as a result, the incident caused thousands to be imprisoned or killed.The western world saw that horror incident on TV and began to find a way for those Chinese students to communicate with each other without allowing their government censorship on them or eavedropping on them. The solution they came up with was the peer-to-peer networking. Peer-to-peer networking was not new then but it was still in its infancy and it needed more works to be done to make it more secure and robust. The Tiananmen Square incident really accelerated the development of the peer-to-peer communication network tremendously.
By 1990, secure and robust communication networks popped up all over the places, and one type of communications in particular was the abilities to enable files sharing among the peer-to-peer networking individuals. Since then, peer-to-peer file sharing networking became the dominant force for people to share communications over the internet freely without government censorship. Peer-to-peer file sharing networking like BitTorrent, uTorrent, Gnutella, VoIP, Pirate Bay, etc, are bourne out of the result of the Tiananmen Square incident.
Also among them was a peer-to-peer networking called Free Net which is an anonymous peer-to-peer data-sharing network like BitTorrent, but it is used mainly as a private internet server or as a "Your Own Private Internet," if you look at it that way. You can use it to store/retrieve data securely without government censorship. It assigns all uploaded data a unique key, slices the data into small, encrypted chunks, and scatters them across different computers on the network. This is the basic idea for the blockchain technology.
So to answer the question posed earlier: the description of the peer-to-peer networking described in the Free Net is what a blockchain really is.
To help you understand the concept of blockchain better, here are brief videos that explain it very well. The basic concept of the blockchain technology The basic concept of the blockchain technology.
About the Free Net
To store pieces of data (also called blocks), you attach a unique key to each unique piece of data and attach it to the already existed chain in the world wide network of computers that scattered all over the world. Each unique key is encrypted and decrypted by the owner of the data so that no one is able to access that data without knowing the actual key.
When someone wants to access a piece of data, say, a document or a photograph, they "fetch" or retrieve it from the network using a unique key assigned to that piece of data.
Remember that each piece of data (also called block) has a unique key attached to it and that unique key is attached or chained to another individual block to form a chain, hence a blockchain. The blocks are sort of a linked list of long chain of blocks containing millions and billions of blocks from a variety of sources or owners that scattered all over the world.
This so-called linked list is actually a Distributed Hash Table that stores data using a global id system.
So this is how the Free Net works: it stores blocks of data and chains them together in a linked list.
That fetch/retrieval request is routed through intermediary network computers that don't store records of the request, ensuring that no single computer knows the contents of any one file.
This fetching system is very similar to how your Web browser fetches websites from the internet. In fact, once you have the Freenet client running on your PC, you can use most commercial Web browser -- like IE, Firefox or Chrome -- to browse files and websites on Freenet.
Next, head over to the Freenet Project website by Google it or via this url link: https://freenetproject.org/index.html and download the Freenet client for your operating system. The installer will walk you through the setup process, with excellent explanations of your options.
You'll have to decide whether to use Freenet in friends-only (or darknet) mode for maximum privacy. This mode lets you connect to Freenet only through trusted friends with whom you exchange encryption keys, which makes it very difficult for anyone to track what you're doing. It also creates a traffic bottleneck that throttles your download speeds.
The Friends-Only mode was designed specifically with the Tiananmen Square incident in mind so that to enable those Chinese students to communicate with each other without their government eavedropping on them.
Once the Freenet client is setup and running, you right-click the client icon in the Windows taskbar and select Open Freenet to access the welcome page. The rest is self-explanatory. Give it a try.
Hope you understand what a blockchain is; it's a different way of explaining it. My way of explaining it!!!
Next up is the technical aspect of the blockchain, including code examples in PHP.
To warm you up for my upcoming tutorial on the code implementation of the blockchain, here are series of very good videos (5 of them) that show it very well using Javascript. The basic implementation of the blockchain technology using Javascript.
Implementation of Blockchain using PHP
I hope you watched the videos series given above because it helps you understand the PHP code I'm about to show you next.
So let's start with the block class which contains the individual blocks in the chain. Remember that a blockchain is made up of blocks (or building blocks) and the below class Block is that individual building block that can be used to create individual blocks to link or chain them together to form a blockchain.
This PHP implementation of the blockchain is devoid of a P2P network implementation; and therefore, is not a full functional blockchain application. A complete blockchain application implementation will need a P2P network to work with so that this (or any) PHP blockchain implementation can interact with a P2P network.
So we need to implement a P2P networking application to make this PHP implementation of the blockchain functions properly and fully. The implementation of P2P networking is beyond the scope of this brief introductory tutorial. You might want to Google the term "P2P networking tutorials" to learn about it.
The block class has a normal constructor, which contains four arguments: the block variable $index, current time $timestamp, current transaction $transaction, and lastly the previous block $previousHash.
These four arguments are very important to a blockchain because these four items get linked or chained or referenced throughout the course of the blockchain flow lifecycle.
In other words, each transaction you make, you create a block of the chain, or more specifically, you create an instance of this class Block, which contains all the necessary information to allow you to complete the transaction. So this class is the main building block of the blockchain.
This class also contains two methods, calculateHash() and mineBlock(), which are self-explanatory, if you follow the code flow.
<?php
/*
 * file: block.php
 *
 * a complete blockchain implementation will still need a P2P network
 * so we need to implement a P2P network.
 */

class Block
    {
     public __constructor($index, $timestamp, $transaction, $previousHash = '')
          {
           $this->index = $index;
           $this->previousHash = $previousHash;
           $this->timestamp = $timestamp;
           //$this->data = $data;
           $this->transaction = $transaction;
           $this->hash = $this->calculateHash();
           $this->nonce = 0;
          }

     public function calculateHash()
          {
           // return hash('SHA256', strval($this->previousHash .
           // $this->timestamp . json_encode($this->transaction) . $this->nonce));
           return hash('SHA256', $this->previousHash .
                        $this->timestamp . ((string)$this->transaction) . $this->nonce);
          }

     // Implementing Proof-of-Work
     public function mineBlock($difficulty)
          {
           // takes the array elements, converts to string and concatenates 0 to it
           while (substr($this->hash, 0, $difficulty) !== str_repeat("0", $difficulty))
               {
                $this->nonce++;
                $this->hash = $this->calculateHash();
               }

           //echo("BLOCK MINED: " + $this->hash);
          }
    } // end class Block
The main class Blockchain
Here is the heart and soul of the class for the blockchain.
<?php
/*
 * file: blockchain.php
 *
 * a complete blockchain implementation will still need a P2P network
 * so we need to implement a P2P network.
 */

/**
 *  usage:
 *
 *  $coin = new Blockchain();
 *  $coin->createTransaction(new Transaction('address1', 'address2', 100));
 *  $coin->createTransaction(new Transaction('address2', 'address1', 50));
 *
 *  echo('\n Start mining...');
 *  $coin->minePendingTransaction('john-doe-address');
 *
 *  echo('\nBalance of John Doe is') . $coin->getBalanceOfAddress('john-doe-address');
 *
 *  echo('\n Start mining again...');
 *  $coin->minePendingTransaction('john-doe-address');
 *
 *  echo('\nBalance of John Doe is') . $coin->getBalanceOfAddress('john-doe-address');
 */
class Blockchain
    {
     public $chain = array();

     public __constructor()
          {
           // this chain should hold an array of object of genesis block
           // should be without the "[]"
           // need to refine.

           // $chain holds an array of Block objects ... lots of it.
           // this is where we hold blocks of transaction.
           $this->chain = [$this->createGenesisBlock()];  // need to refine this
           $this->difficulty = 2;
           // this array propery is assigned transactions by minePendingTransaction() below
           $this->pendingTransaction = array();
           $this->miningReward = 100;
          }

     public function createGenesisBlock()
          {
           // the return statement just returns an instance of Block.
           // so the constructor that calls this function assigns an instance of Block and
           // that is it!

           // need to refine this call: notice that only three arguments are passed in!
           // this is because the fourth argument is optional: $previousHash = ''

           // need to refine these calls!
           //return new Block(0, strtotime("2017-01-01"), "Genesis Block");
           return new Block(new DateTime('2000-01-01'), [], "0"); // [] short cut array
          }

     public function getLatestBlock()
          {
           // count the # of array elements in the chain by subtracting 1 to get the
           // last element in the array and therefore getting the last block.
           // array element starts at 0, 2nd element is 1, 3rd element is 2, etc.
           return $this->chain[count($this->chain) - 1];
          }

     public function minePendingTransaction($miningRewardAddress)
          {
           // $this->getLatestBlock()->hash refers to the chain's property hash which
           // holds the block's hash strings
           $block = new Block(new DateTime(), $this->pendingTransaction,
           $this->getLatestBlock()->hash;
           $block->mineBlock($this->difficulty);

           echo ('Block successfully mined!');
           // push the chain onto the block to be stored in the blockchain serial
           array_push($this->chain, $block);

           // storing the transactions in this class's
           // array property $this->pendingTransaction
           $this->pendingTransaction = [
                                        new Transaction(null, $miningRewardAddress,
                                                        $this->miningReward)
                                       ];
          }

     // create a transaction passing an instance of the Transaction object containing
     // $fromAddress, $toAddress, $amount
     // and then push this transaction object onto the array list: pendingTransaction
     // createTransaction() receives a 'new Transaction("address1", "address2", 100)'
     // instance object as its argument
     public function createTransaction($transaction)
          {
           // storing the transactions in this class's
           // array property $this->pendingTransaction
           array_push($this->pendingTransaction, $transaction);
          }

     public function getBalanceOfAddress($address)
          {
           $balance = 0;

           foreach ($this->chain as $block)
                 {
                  foreach ($block->transaction as $trans)
                        {
                         if ($trans->fromAddress === $address)
                            {
                             $balance -= $trans->amount;
                            }

                         if ($trans->toAddress === $address)
                            {
                             $balance += $trans->amount;
                            }
                        }
                 }

           return $balance;
          }

     public function isChainValid()
          {
           for ($i = 1; $i < count($this->chain) + 1; $i++)
               {
                $currentBlock = $this->chain[$i];
                $previousBlock = $this->chain[$i - 1];

                if ($currentBlock->hash !== $currentBlock->calculateHash())
                   {
                    return false;
                   }

                if ($currentBlock->previousHash !== $previousBlock->hash)
                   {
                    return false;
                   }
               }

           return true;
          }
    } // end class Blockchain
Transaction
<?php
/*
 * file: transaction.php
 *
 * a complete blockchain implementation will still need a P2P network
 * so we need to implement a P2P network.
 */

class Transaction
    {
     public __constructor($fromAddress, $toAddress, $amount)
          {
           $this->fromAddress = $fromAddress;
           $this->toAddress = $toAddress;
           $this->amount = $amount;
          }
    } // end class Transaction
Peer-to-peer network tutorials
Here are some of the video tutorials that you can get started learning peer-to-peer network:
Peer to Peer Network: P2P Network - Fundamental Concepts Peer to Peer Network: What is a peer to peer system? Peer-to-peer (P2P) Networks - Basic Algorithms Peer-to-peer (P2P) Networks: Routing in Distributed Hash Tables Peer-to-peer (P2P) Networks: Hash Tables Introduction to Decentralized P2P Apps Peer to Peer: MIT 6.824 Distributed Systems (Spring 2020) Peer to Peer: What is a distributed system?
Peer-to-peer network libraries
Very surprisingly, to say the least, there aren't many open-source PHP peer-to-peer network libraries out there on the Internet. So now the choices are to write your peer-to-peer network applications in other languages, say, Javascript, Node.JS, or even in a language called Go! (a not very well-known language but it is very suitable for writing peer-to-peer network applications.) This language (Go!) is built specifically for programming peer-to-peer network applications.
Anyhow, here are some libraries:
Peer to Peer Network Libraries in PHP
Peer to Peer Network Libraries in Go!
Peer to Peer Network Examples in Go!
Peer to Peer Network Tutorials 'README' File in Go!
Javascript Blockchain Libraries
As you might have already knew that PHP is not a language that is suitable for programming blockchain applications. However, Javascript is very much suitable for programming blockchain applications since it does have multithread capabilities, whereas PHP does not.
So if you are familiar with the language of Javascript, particularly Node.JS, you can use Javascript to program your blockchain applications. Here is a library for building blockchain applications using Javascript, particularly using Node.JS, which uses a native Javascript language.
Lisk: the blockchain application platform
There you have it! A blockchain application platform for building blockchain applications.
Introduction to PDO Database
Article Date: October 20, 2013
By Paul S. Tuon
When it comes to the subject of databases the immediate thought-in-mind that pops up in your mind quickly is mysql database. Not a single programmer or computer technology enthusiast on the planet that doesn't know what mysql is; unless, he/she is in a cave somewhere. MySQL is so popular throughout the world because of its agility, easy to learn and program, and most importantly, it's free. Because of its popularity, it sucks the air out of other databases, making them just a bunch of copycats and not worth the time to even explore and investigate. This is especially true for PDO where not many programmers -- even hardcore, die-hard everyday computer technology enthusiasts and programmers who are making their living writing computer programs daily -- know how to program database using PDO; and the majority of them don't even know what PDO is and never even heard of it -- well, until today, perhaps!
In this article, I'm going to shed light on PDO and show you how to use PDO on your daily database programming chores. If you don't know what PDO is and never heard of PDO before, this article should enlights you and gets you on the right path to database programming.
PDO stands for PHP Data Objects, a PHP's database API for working with a variety of databases -- not just MySQL. In term of working with MySQL, it's one of PHP's three available APIs for connecting to a MySQL database. Yes, you heard it right; there are three different APIs for connecting to MySQL:
- mysql - the very popular and easy to use, original API.
- mysqli - MySQL Improved (the much improved API)
- pdo - PHP Data Objects (the uniform connection API - the new kid on the block, if you will)
The traditional and very popular original mysql API certainly gets the job done, and has become so popular largely due to the fact that it makes the process of storing/retrieving some records to/from a database as easy as possible. But it has three weaknesses:
- Escaping: The process of escaping user input is left to the developer -- many of which don't understand or know how to sanitize the data.
- Flexibility: The API isn't flexible; the code that people normally used to write for MySQL is tailor-made for working with a MySQL database and not portable to other databases. What if you want to switch your code to work with a different database, say, PostgreSQL, SQLite, ADO ( ActiveX Database Objects), Interbase, or any other databases out there?
The good old and very popular MySQL API isn't going to allow you to port your code to other databases; while, Java API, and comes the new kid on the block, PDO, or PHP Data Objects, provide a more powerful API that doesn't care about the driver you use; it's database agnostic (neutral). Furthermore, it offers the ability to use prepared statements, virtually eliminating any worry of SQL injection.
- Deprecated: Though it hasn't been officially deprecated as of this writing October 20, 2013 -- due to widespread use. In terms of best practice and education, it might as well should be deprecated so that to encourage developers to migrate to PDO.
Update: As of October 1, 2020, the old PHP's MySQL api has been deprecated. Thank god!!!.
So use PDO instead.
Now that you know enough background on PDO, let's get started in learning PDO by initiating a connection to the MySQL database engine. In this article, we are only dealing with MySQL, although the discussion can be applied to other databases as well. Remember that PDO is database-neutral; meaning that it's portable to other databases as well, and this article is applicabable to other databases as well.
Connecting to MySQL Database
Before you can work on a database, you need a database and got it all set up and ready to go. In this article, I won't show you how to set up a database; only leave it to you to either do it on your own or find somebody who can do it for you; or for a better idea, and probably the most obvious option people choose, is to rent a web hosting space that offers database server. Lots of web hosting companies offer database servers when you buy their hosting package. So check with your web hosting vendor.An even much better idea is to sign up for a free web hosting space and use it as your database testing facility. There are plenty of free web hosting service providers out there on the Internet.
Getting Started
Once you set up the database and have accessed to its parameters (e.g., database name, the database provider [usually called local host], username and a password), you're ready to program your first PDO program. If you're renting a webspace from a web hosting company, you can get all these information from your web hosting company. Once you got all these parameters, you basically configure or program any way you want. You can create a seperate PHP script to store all those information or you can include it in your database script that you're working on. For example, to create a seperate script and store the connection parameters, do the following, and save it to a file and include that file name on every database script that makes use of these parameters:Connection Parameters
File name incuding directory: Home/Database/connection.php

<?php
// arbitrarily name you give it when
// you create during phpMyAdmin setup
$databaseName = "db1.abc.10077";
//given to you by your hosting co.
$hostingserver = "db1.abc10077.example.com";
// either given to you or you create it yourself
$username  = "yourUsername";
// either given to you or you create it yourself
$password  = "yourPassword";
?>
Once you have connection parameters setup (and preferrably in a seperate file as shown above for security issues), it's time to connect to MySQL using PDO:
Connecting to MySQL
<?php
include('Home/Database/connection.php');
$conn = new PDO("mysql:host=$hostingserver;dbname=$databaseName",
                                        $username, $password,
     array(PDO::MYSQL_ATTR_INIT_COMMAND => 'SET NAMES utf8'));
?>
As you can see, to connect to MySQL, you need to create an instance of the PDO object and passing all the necessary parameters (up to maximum of four parameters) to it and assign that instance object to a variable name $conn.
The class PDO is already in the PHP standard library; and therefore, it is available for use in your PHP script just like any built-in PHP class. So you don't need to include it or import it from somewhere -- it is available everywhere in your PHP script.
The fourth parameter is the driver options that you can set as an array: such as charset as in the example above or ATTR_ERRMODE, ERRMODE_EXCEPTION, ATTR_EMULATE_PREPARES and a whole host of options which is too many to list here.If you like, you can choose to opt out and omit the fourth parameter if you use the default charset (utf-8) as in the above example. The fourth parameter in the code above is not necessary. However, if you use other charset, by all means include the fourth parameter, especially if you have other driver options to set.
Note that you can set the charset directly in the Data Source Name (DSN) in the first parameter like so:
Connecting to MySQL
<?php
include('Home/Database/connection.php');
$conn = new PDO("mysql:host=$hostingserver;dbname=$databaseName;
port=your_database_port_number;charset=utf8",
$username, $password);
?>
The first parameter contains the database provider information called Data Source Name (DSN, for a minimum of three parameters: driver, hosting server and database name; plus optional parameters, such as port number (port=your_database_port_number) and the charset -- if the charset and port are included here), for example:
- mysql - driver. Note that the colon (:) is not part of a driver. It's a PDO operator or command to signify that all parameters that follow it belonged to the driver; in this case, mysql driver. The semicolon is a PDO operator to seperate each name/value pairs.
- host - hosting server (e.g., host='www.dbserver.com/db100770')- host=name_of_hosting_company, also commonly known as localhost or local host if you're working offline (not live online) on a local environment or platform such as MAMP, WAMP, XAMPP, VAGRANT or DOCKER.io. It refers to the database hosting company in the form of a server address that contains the database engine you're trying to connect to. For example, http://db1005.server.example.com.
- dbname - database name (dbname=your_database_name).
- Optional: charset - utf8 or other charset relevant to your language.
The second and third parameters contain database access privilege (username and password, respectively).
That's all the code you need for the connection to not just MySQL but to all other databases as well. To connect to other databases, all you have to do is replace the driver of the database of your choice and you're good to go. The driver for MySQL database is simply called mysql as you can see from the example above (in the first parameter). Now, for all other drivers for other databases, you can just replace those drivers in place of the mysql driver. Check with the manual of the database specific to your case to get the driver.
What's nice about this approach is that you hardly have to rewrite your code in order to run on other databases; whereas the good old and still very popular MySQL, you'll have to rewrite your code to port it to other databases.
Any time you're working on a database, there always something going to be amiss and you need to take care of the situation gracefully by handling the error properly; and for the connection, we can set two error modes (PDO::ATTR_ERRMODE and PDO::ERRMODE_EXCEPTION) and also wrap a try ... catch block around it as well, for example:
Error Handling
<?php
include('Home/Database/connection.php');
try
    {
     $conn = new PDO("mysql:host=$hostingserver;dbname=$databaseName",
                                             $username, $password);
     $conn->setAttribute(PDO::ATTR_ERRMODE,
                         PDO::ERRMODE_EXCEPTION);
    }
catch (PDOException $e)
    {
     echo 'Cannot connect to the database. ' . $e->getMessage();
    }
?>
The Scope Resolution Operator "::" (the double colon) is a token that allows access to static, constant, and overridden properties or methods of a class. In other words, it is a static class operator used to refer to static constant, (static) properties, and (static) methods of a class.
In this case, it refers to a constants called ATTR_ERRMODE and ERRMODE_EXCEPTION. For on the Scope Resolution Operator "::", please see my other tutorial called $this verses Self verses Parent.
The 'catch' block takes a PDO exception class (PDOException) that returns an error in a variable that follows it -- and in this case -- $e. You can name this variable any name you wish. PDOException class also has a method called getMessage() that returns the error message it generates when it encounters any error in your query.PDO has a function called setAttribute() to allow you to set some attribute modes. setAttribute() contains just one parameter but you can include multiple attributes by seperating each attribute with a comm (,). The example above, we set two attributes: ATTR_ERRMODE and ERRMODE_EXCEPTION. There are several attributes that you can use (e.g, ATTR_ERRMODE, ATTR_CASE, ATTR_TIMEOUT, ATTR_AUTOCOMMIT, ATTR_ORACLE_NULLS, ATTR_STRINGIFY_FETCHES, ATTR_STATEMENT_CLASS, etc.). Refer to PDO documentation for more.
PDO provides three error modes and they are:
- PDO::ERRMODE_SILENT
- PDO::ERRMODE_WARNING
- PDO::ERRMODE_EXCEPTION
The latter one is the most relevant of the three and gets used the most by programmers and you should too.
Note: Error Handling
Please note that, by default, the default error mode for PDO is PDO::ERRMODE_SILENT. If you didn't do the attribute setting like above, you'll need to manually fetch errors, after performing a query, like so: echo $conn->errorCode();echo $conn->errorInfo();
If you use the code above, you don't need these two lines. A good programming practice, during development, is to update this attribute setting to PDO::ERRMODE_EXCEPTION, which will fire exceptions as they occur. This way, any uncaught exceptions will halt the script.
Persistence Database Connection
Many web applications will benefit from making persistent connections to database servers. Persistent connections remain open and active during the lifetime of your active application and are not closed at the end of the script; but are cached and re-used when another script requests a connection using the same credentials. The persistent connection cache allows you to avoid the overhead of establishing a new connection every time a script needs to talk to a database, resulting in a faster web application. For example:Persistence Connection
<?php
include('Home/Database/connection.php');
try
    {
     $conn = new PDO("mysql:host=$hostingserver;dbname=$databaseName",
                     $username, $password,
                     array(PDO::ATTR_PERSISTENT => true,
                     PDO::ATTR_ERRMODE => true,
                     PDO::ERRMODE_EXCEPTION => true));
    }
catch (PDOException $Exception)
    {
     echo 'Connection error: ' . $Exception->getMessage();
    }
?>
If you wish to use persistent connections, you must set PDO::ATTR_PERSISTENT in the array of driver options passed to the PDO constructor (as shown above). Note that if setting this attribute with PDO::setAttribute() function (e.g., $conn->setAttribute(PDO::ATTR_PERSISTENT);) after instantiation of the object, the driver will not use persistent connections.
So the following connection object is not a persistent connection object. For example:
Not a Persistence Connection
<?php
include('Home/Database/connection.php');
try
    {
     //initiate an instantiation
     $conn = new PDO("mysql:host=$hostingserver;dbname=$databaseName",
                     $username, $password);
     //after instantiation
     $conn->setAttribute(PDO::ATTR_PERSISTENT, PDO::ATTR_ERRMODE,
                     PDO::ERRMODE_EXCEPTION));
    }
catch (PDOException $ex)
    {
     echo 'Connection error: ' . $ex->getMessage();
    }
?>
Closing the Database
Upon successful connection to the database without errors, an instance of the PDO object is returned to your script. The connection remains open and active for the lifetime of that instance PDO object. From there on, you can do whatever you want with your database connection, such as querying the data. To close the connection, you need to destroy the object by ensuring that all remaining references to it are deleted -- you do this by assigning NULL to the variable (e.g., $conn) that holds the object. If you don't do this explicitly, PHP will automatically close the connection when your script ends.Closing the Connection
<?php
include('Home/Database/connection.php');
try
    {
     $conn = new PDO("mysql:host=$hostingserver;dbname=$databaseName",
     $username, $password);
     // use the connection here
     // ....
    }
catch (PDOException $exception)
    {
     echo 'Cannot connect to the database. '.$exception->getMessage();
    }

// and now we're done; close it
$conn = null;
?>
For more tutorials on PDO database connection, please go to: https://www.php.net/manual/en/ref.pdo-mysql.connection.php
For more tutorials on PDO in general, please go to: PDO Manual
Insert Data Into Database
I intentionally left out the detail of creating a database and table when we discussed the database connection and leave it for this discussion. Although creating a table is uniform for all databases, however, creating a database is not uniformed -- meaning different databses and admins have different methods of dealing with databases creation.
For example, you can use PhpMyAdmin tool to create databases and tables and pretty much you can do a lot of other things as well to make your life much easier. I recommend you make use of the PhpMyAdmin to do your database job on your everyday database programming chores.
If you have a localhost server installed on your computer PhpMyAdmin comes with the localhost program as well, and you can use it to do your database chores as well. For more tutorial on localhost, please see my other tutorial called "Get Started Programming for Beginners" and you'll find a section on that tutorial that deals with localhost.
Here is a look at the screenshots of the PhpMyAdmin that are partially shown due to space constraint:
Whenever you open your PhpMyAdmin tool a generic screen should look like the one shown above. Of course, the above screen is only partially shown due to space constraint.
On the left side it lists some database names that already been created. Here, I created some database names called dashboard, noon2noon, and noonshop. The rest are just database schemas created by PhpMyAdmin and no one should touch them at all.
As you can see, there is a menu called "New" as well for creating a new database. When you need to create a new table, you first need to create a database, and after that, you can then create a table. To create a database just click on the "New" menu button and a screen that looks like the following will open up for you to fill in the database name.
Pay speciall attention to the right side pane where there are several items that you can do -- like export/import your database tables to this PhpMyAdmin.
In the above screenshot, you can create a database by filling in your database name in the input box in place of "Database name" and once you're finished click the "Create" button to create the database. And it will create a database for you [similar to my databases dashboard, noon2noon, and noonshop and as well as 3149662_org below].
In the following screenshot, here is one of my database that I created called 3149662_org. In this database I created ten tables (see the left side pane).
Similarly as the previous screenshot, the above screenshots allows you to enter the table name along with the table fields. All of these are self-explanatory. So please make use of the PhpMyAdmin to do your database chores. It's a lot easier than the one shown in the following tutorial.
Creating Database Tables Manually by Hands
In the screenshots shown previously, you can create databases and tables easily using PhpMyAdmin tool. However, in the following tutorial, you can create databases manually by hands as well.
So here, we will discuss how to create a database and a table manually by hand programically using PHP script. So to insert data into the database, we need to have a database and a table ready. But first, let's create a database and a table called my_database and membership_table, respectively.
Creating a database manually and programically using PHP script
<?php
$db_name = 'my_database';
$host = 'htttp://www.myhostingserver.com';
$username = 'my_user123';
$password = 'my_pass123';

try
    {
     // now just connect to the PDO
     $conn = new PDO("mysql:host = $host", $username, $password);

     // now create the actual database called 'my_database'
     $conn->exec("CREATE DATABASE `$db_name`;");
    }
catch (PDOException $e)
	{
     die("DB ERROR: ". $e->getMessage());
    }


// that's is it!!!
// you now have a database name called 'my_database' in your database server.


// Or you can get the same result as above without using a try ... catch block:

$db_name = 'my_database';
$host = 'htttp://www.myhostingserver.com';
$username = 'my_user123';
$password = 'my_pass123';

// now just connect to the PDO
$conn = new PDO("mysql:host = $host", $username, $password);

// now create the actual database called 'my_database'
$conn->exec("CREATE DATABASE `$db_name`;") or die(print_r($conn->errorInfo(), true));


// that's is it!!!
// you now have a database name called 'my_database' in your database server.
// go to your database hosting server or your PhpMyAdmin tool and check to see
// if a database called 'my_database' have been created! it should!!!

// once you have a database name in your database server, you can use it to
// create database tables and do everything else that you need to do!!!
?>
Now that a database already have been created, we can go ahead and create a table called membership_table.
Creating a table
<?php
//create a table named membership_table if it doesn't exist in the database name
try
    {
     $conn->query("CREATE TABLE IF NOT EXISTS `membership_table`
           (
            `id` int(10) NOT NULL auto_increment, // id is increment automatically
            `name` varchar(25) NOT NULL,
            `address` varchar(64),
            `email` varchar(64) NOT NULL,
            // just to have a variety for demonstrative purpose
            `price` float(10,2), // can be null,10 digits with 2 decimal
            `description` text(64), // also can be null
            `date_time` timestamp NOT NULL DEFAULT CURRENT_TIMESTAMP,
            // the following definitions are advanced uses for key manipulations
            PRIMARY KEY (`id`), // used for referring to certain id
            UNIQUE KEY `id` (`id`), // for referring to a unique id
            // full text searching similar to Google search
            FULLTEXT (`name`, `address`, `email`, `description`)
           )

     // MySQL 5.7 or higher: InnoDB is the default storage engine but
     // consumes more bytes.
     // So MyISAM is the preferred choice here/consuming less bytes and
     // runs faster.

     // Optional: DEFAULT CHARSET=utf8 COLLATE=utf8_unicode_ci
     // Just put only: ENGINE=MyISAM");
     // without the optional: DEFAULT CHARSET=utf8 COLLATE=utf8_unicode_ci

     ENGINE=MyISAM  DEFAULT CHARSET=utf8 COLLATE=utf8_unicode_ci");
    }
catch (PDOException $e)
    {
     echo "Error: Fail to create a table. " . $e->getMessage();
    }
?>

/**
 * Notice that the use of the DEFAULT clause to give the table columns an
 * initial value so that the query operations can proceed without having
 * to supply new values.
 *
 * For example, the table field column `date_time` looks like this:
 *
 *            `date_time` timestamp NOT NULL DEFAULT CURRENT_TIMESTAMP
 *
 * See an explanation later on the function CURRENT_TIMESTAMP
 *
 * The two most frequently used data types are VARCHAR and INT.
 * But occasionally, you'll use TEXT instead of VARCHAR for description
 * and CHAR for character a-z or A-Z and special characters!
 *
 * Other data types are:
 *
 *  Numeric:
 *
 *         TINYINT
 *         SMALLINT
 *         MEDIUMINT
 *         BIGINT
 *         INT
 *
 *         DECIMAL
 *         DOUBLE
 *         FLOAT
 *         REAL
 *
 *        these three are rarely used:
 *
 *         BIT
 *         BOOLEAN
 *         SERIAL
 *
 * Date and time:
 *
 *         DATE
 *         DATETIME  <-- will output date and time: 2020-08-07 15:47:01
 *         TIMESTAMP <-- output date/time in timestamp: 509173028064019
 *         TIME
 *         YEAR
 *
 * String:
 *
 *         CHAR
 *         VARCHAR
 *
 *         TEXT
 *         TINYTEXT
 *         MEDIUMTEXT
 *         LONGTEXT
 *
 *         BINARY
 *         VARBINARY
 *
 *         BLOB
 *         TINYBLOB
 *         MEDIUMBLOB
 *         LONGBLOB
 *
 *        these two are rarely used:
 *
 *         ENUM
 *         SET
 */
The code above starts off by trying to create a table named membership_table if it doesn't already exist in the database name. In other words, it checks your database name to see if a table name membership_table already exists. If it doesn't it creates one using the definition outlined in the code (assuming there is no errors in the definition). If it exists it skips the table definition and goes past the catch() block and on to execute what else code you put after the catch() block.
The table definition is basically self-explanatory except the part where it includes a primary key for key manipulation and unique key for referring to a particular unique key in certain database operations. The full text definition is for advanced feature that allows you to do some search queries. For example, if you have to search for a client's name, address, email, etc., you can use full text search operations [as in this case] instead of a normal [search] query.
Full text search can search phrases or sentences, for example, if you store your phrase in your 'description' column in your table above with this phrase: "Joe spends his days at the beaches." And if you type in a search box "joe spends his time" it will return "Joe spends his days at the beaches" because it matches some words contain in both the query and the record stored in your database. For more on full text Google the term "mysql fulltext" or see MySQL full text. Also, Google "engine = myisam" to learn more about it. I won't spend time explaining it.
Inserting data into a table
<?php
// Let's prepare to insert Joe's data into membership database
$name     = 'Joe Public1';
$email    = 'abc@example.com';
$address  = '123 Main St';
// hours in 24-hour military time
// displays: 04-26-2016 20:01:04
$current_date_time = date("m-d-Y H:i:s");
// displays: 26-04-2016 20:01:04
$current_date_time = date("d-m-Y H:i:s");
// displays: 2016-04-26 20:01:04
$current_date_time = date("Y-m-d H:i:s");
try
    {
     # Prepare to insert Joe's data into club's membership database
     # using ??????
     $stmt = $conn->prepare('INSERT INTO membership_table
        (name, address, email, price, description, created_time)
                          VALUES(?, ?, ?, ?, ?, ?)');

     // you should make a habbit to use array shortcut: [] instead!
     // for example: $stmt->execute(['name' => $name,
     //                              'address' => $address,
     //                              'email' => $email,
     //                              'price' => $price,
     //                              'description' => $description,
     //                              ....
     //                            ]);

     $result = $stmt->execute(array(
                          // you can omit the single quote on the
                          // right side as well. for example:
                          // 'name' => $name,
                          // $name will be converted into an array
                          // string, so single quote is not needed!
                          // 'name' => $name,

                          // 'name' => ' . $name . ', // not needed!
                          'name' => $name, // better!

                          'address' => $address,
                          // 'address' => ' . $address . ',

                          'email' => $email,
                          // 'email' => ' . $email . ',

                          'price' => $price,
                          // 'price' => ' . $price . ',

                          'description' => $description,
                          // 'description' => ' . $description . ',

                          'created_time' => $current_date_time
                          // 'created_time' => ' . $current_date_time . '
                         )
                   );

     # For debugging purpose? Affected rows?
     # output 1 row.
     # rowCount() is similar to mysql_num_rows() for the old PHP API

     echo "Data has been entered successfully: " . $result->rowCount();
    }
catch (PDOException $e)
    {
     echo "Can't insert data into database. " . $e->getMessage();
    }
?>
If you observe the two codes above: the create table code and the insert table code, you'll notice that there are 10 table definitions or fields in the create table code while only six fields (or arguments) are performed in the insert table code. Actually, there can be only five fields if you want to use the DEFAULT feature of the CURRENT_TIMESTAMP. See an explanation below.
If you look closely in the definition you'll notice that the 'id' definition contains the "auto_increment" clause that MySQL uses to increment this 'id' automatically starting with number 1 and increments it by 1 each time you insert a row of record. Therefore, the 'id' field is not directly handled by programmers -- it is handled by MySQL automatically.
The other three: private key, unique key and full text are also not directly handled by programmers -- private key and unique key are handled seperataly during key retrieval operations using the select or update statement; whereas full text is also handled seperataly during record retrieval operations using the select or update statement.
Function CURRENT_TIMESTAMP
If you look in the create table definition, you'll notice that a table field called `date_time` uses a function called CURRENT_TIMESTAMP to automatically generate date and time every time an INSERT or an UPDATE operation is taking place.
So optionally, you don't need to insert (or update) the current date and time manually as shown in the examples throughout this tutorial. So instead of having to do an INSERT or an UPDATE operation using all six fields, you can just do an operation using only five fields. For example:
Inserting data into a table
<?php
// Preparing data to insert into the database

$name     = 'Joe Public1';
$email    = 'abc@example.com';
$address  = '123 Main St';
$price = '24.95';
$description = 'testing';

try
    {
     // notice the use of only five fields

     $stmt = $conn->prepare('INSERT INTO membership_table
               (name, address, email, price, description)
                             VALUES(?, ?, ?, ?, ?)');

     // notice that you can use placeholder as well, example:

     // VALUES(:name, :address, :email, :price, :description)');

     // placeholder for execute():

     // $result = $stmt->execute([':name' => $name,
     //                           ':address' => $address,
     //                           ':email' => $email,
     //                           ':price' => $price,
     //                           ':description' => $description
     //                          ]
     //                         );

     // notice the use of only five fields: no `date_time`

     // using array shortcut: []

     $result = $stmt->execute(['name' => $name,
                               'address' => $address,
                               'email' => $email,
                               'price' => $price,
                               'description' => $description
                              ]
                             );

     echo "Data has been entered successfully: " . $$result->rowCount();
    }
catch (PDOException $e)
    {
     echo "Can't insert data into database. " . $e->getMessage();
    }
?>

/**
 * As you can see above, there are only five fields and yet the
 * create table definition contains 10 fields. But five of them
 * are handled by MySQL automatically including the function
 * CURRENT_TIMESTAMP.
 *
 * Now for the field that has a function CURRENT_TIMESTAMP,
 * MySQL automatically generates a date and time for you and
 * inserts it in the database every time you do an INSERT or
 * an UPDATE operation.
 *
 * This saves us the need to manually insert the date and time.
 *
 * In the tutorial throughout, I opted to do it manually for
 * educational purpose only.
 *
 * In your case, please let MySQL do it for you automatically!
 */
The example shown in the previous illustration performs an INSERT query by substituting a name and a value for the named placeholders. Notice that you list the table fields and you specify the placeholders in the exact numbers as the fields. You arrange the array fields in the exact order as the table fields in the execute() statement. This statement inserts the data into the database:
$stmt->execute(array('name' => $name, ..., ..., ... ));
Or using a shortcut array notation: []
$stmt->execute(['name' => $name, ..., ..., ... ]);
In the execute() statement, you don't have to use an array but using an array is more efficient. Let's say you don't want to use an array, you can do the following:
$stmt->execute('name' => $name);
$stmt->execute('address' => $address);
$stmt->execute('email' => $email);
$stmt->execute('price' => $price);
$stmt->execute('description' => $description);
$stmt->execute('date_time' => $date_time);
Binding Data Using bindParan() and bindValue()
An alternate, but perfectly acceptable, approach would be to use the bindParam method and bindValue method. The following example inserts data into the database using bindParam(). Notice also that bindParam() and bindValue() can be used to bind values (using INSERT INTO statement), selected values (using SELECT statement) and udate values (using UPDATE statement):Inserting data
<?php
include('Home/Database/connection.php');
try
    {
     $conn = new PDO("mysql:host=$hostingserver;dbname=$dbname",
     $username, $password);
     // set the PDO error mode to exception
     $conn->setAttribute(PDO::ATTR_ERRMODE, PDO::ERRMODE_EXCEPTION);
    }
catch (PDOException $e)
    {
     echo 'ERROR: Can't connect to the database. ' . $e->getMessage();
    }
try
    {
     // prepare sql and bind parameters

     $stmt = $conn->prepare("INSERT INTO membership_table (name,
     address, email, price, description, created_time)
     VALUES (:name, :address, :email, :price, :description, :created_time)");

     $stmt->bindParam(':name', $name);
     $stmt->bindParam(':address', $address);
     $stmt->bindParam(':email', $email);
     $stmt->bindParam(':price', $price);
     $stmt->bindParam(':description', $description);
     $stmt->bindParam(':created_time', $created_time);

     // insert a row of values
     $name = "Joe Public";
     $address = "123 main st";
     $email = "joe@example.com";
     $price = 10.00;
     $description = "this is a description";
     $created_time = date("Y-m-d H:i:s");

     // now execute it to take effect
     $result = $stmt->execute();

     // insert another row of values
     $name = "Joe Public";
     $address = "123 main st";
     $email = "joe@example.com";
     $price = 10.00;
     $description = "this is a description";
     $created_time = date("Y-m-d H:i:s");

     // now execute it to take effect
     $result = $stmt->execute();

     // insert another row of values
     $name = "John Doe";
     $address = "999 main st";
     $email = "john@example.com";
     $price = 30.00;
     $description = "this is another description";
     $created_time = date("Y-m-d H:i:s");

     // now execute it to take effect
     $result = $stmt->execute();

     echo "New data have been inserted successfully";
    }
catch (PDOException $e)
    {
     echo "Cannot insert data into the database. " . $e->getMessage();
    }
?>
In the above example, the process takes three steps: prepare, bind, execute. Notice that you can substitue placeholders (?,?,?,?) in place of named parameters (:, :, :, :) as well.
Here is another code example that I wrote for my in-house shopping cart that makes use of the PDO database. No explanation is given; because it's self-explanatory:
Inserting data
<?php
//include all database credential, e.g., $host, $database, $username,
//$password
include("Home/Database/Credential.php");
try
    {
     $conn = new PDO("mysql:host=$host;dbname=$database", $username,
     $password);
     $conn->setAttribute(PDO::ATTR_ERRMODE, PDO::ERRMODE_EXCEPTION);
    }
catch (PDOException $e)
    {
     echo 'ERROR: Cannot connect to the database. ' . $e->getMessage();
    }
//try to create a table if one doesn't exist
try
    {
     $conn->query("CREATE TABLE IF NOT EXISTS `Products`
               (
                ID int(6) NOT NULL auto_increment,
                ProductNum VARCHAR(8) NOT NULL,
                ProductName VARCHAR(35) NOT NULL,
                Price DOUBLE(8, 2) NOT NULL,
                Image VARCHAR(45),
                URL VARCHAR(45) NOT NULL,
                Description VARCHAR(64),
                PRIMARY KEY (ID),
                UNIQUE ID (ID),
                // full text searching similar to Google search
                FULLTEXT (ProductNum, ProductName, Description)
               )

     //MySQL 5.7 or higher: InnoDB is the default storage engine but
     //consumes more bytes.

     //So MyISAM is the preferred choice here/consuming less bytes and
     //runs faster.

     ENGINE=MyISAM  DEFAULT CHARSET=utf8 COLLATE=utf8_unicode_ci AUTO_INCREMENT=2 ");
    }
catch (PDOException $e)
    {
     echo 'ERROR: Cannot create a table! ' . $e->getMessage();
    }
try
    {
     $sql = $conn->prepare("INSERT INTO `Products`
             (
              `ProductNum`, `ProductName`, `Price`, `Image`, `URL`,
              `Description`
             )
       VALUES
             (
              :ProductNum, :ProductName, :Price, :Image, :URL,
              :Description
             ) ");

     $sql->bindParam(':ProductNum', $ProductNum, PDO::PARAM_STR);
     $sql->bindParam(':ProductName', $ProductName, PDO::PARAM_STR);

     //No PDO::PARAM_DOUBLE OR PDO::PARAM_FLOAT,
     //so use PDO::PARAM_STR instead
     //all float or decimal # treat as string, eg '12.30'

     $sql->bindParam(':Price', $Price, PDO::PARAM_STR);
     $sql->bindParam(':Image', $Image, PDO::PARAM_STR);
     $sql->bindParam(':URL', $URL, PDO::PARAM_STR);
     $sql->bindParam(':Description', $Description, PDO::PARAM_STR);

     // now execute it to take effect
     $result = $sql->execute();
    }
catch (PDOException $e)
    {
     echo 'Can't insert data into database. ' . $e->getMessage();
    }

// Notice that you can place these values after the
// execute() statement as well and as well as
// outside the try ... catch block and it still works.

// logic dictates that you suppose to put these values obtained
// from the POST form before the execute() statement has been called,
// however, in PDO it dispise the logic and allows you to put these
// values after the execute() statement has been called and it
// still work!

if (isset($_POST['num']) && ($_POST['num'] != '') )
   {
    $ProductNum  = $_POST['num'];
   }
else
   {
    $Error       = 'You forgot to type in the product number.';
    $Flag        = true;
   }
if (isset($_POST['name']) && ($_POST['name'] != '') )
   {
    $ProductName = $_POST['name'];
   }
else
   {
    $Error       = 'You forgot to type in the product name.';
    $Flag        = true;
   }
if (isset($_POST['price']) && ($_POST['price'] != '') )
   {
    $Price       = $_POST['price'];
   }
else
   {
    $Error       = 'You forgot to type the product price.';
    $Flag        = true;
   }
if (isset($_POST['image']) && ($_POST['image'] != '') )
   {
    $Image       = $_POST['image'];
   }
else
   {
    $Error       = 'You forgot to type the product image.';
    $Flag        = true;
   }
if (isset($_POST['url']) && ($_POST['url'] != '') )
   {
    $URL         = $_POST['url'];
   }
else
   {
    $Error       = 'You forgot to type in the product url.';
    $Flag        = true;
   }
if (isset($_POST['description']) && ($_POST['description'] != ''))
   {
    $Description = $_POST['description'];
   }
else
   {
    $Error       = 'You forgot to type in the product description.';
    $Flag        = true;
   }
?>
Insert Data Using bindValue()
This example uses PDOStatement::bindValue to bind a value to a parameter. It binds a value to a corresponding named or question mark placeholder in the SQL statement that was used to prepare the statement.For bindValue(), you can substitue placeholders (?,?,?,?) in place of named parameters (:, :, :, :) as well. However, you have to be careful with the positional order of the parameter when using placeholders (?). For a prepared statement using named parameters, this will be a parameter name of the form :name, and the exact positional order is not important.
For a prepared statement using question mark placeholders, this will be the 1-indexed position exact order of the parameter. Remember that exact positional order is very important.
Inserting data
<?php
include('Home/Database/connection.php');
try
    {
     $conn = new PDO("mysql:host=$hostingserver;dbname=$dbname",
     $username, $password);
     // set the PDO error mode to exception
     $conn->setAttribute(PDO::ATTR_ERRMODE, PDO::ERRMODE_EXCEPTION);
    }
catch (PDOException $e)
    {
     echo 'ERROR: Cannot connect to the database. ' . $e->getMessage();
    }
try
    {
     // prepare sql and bind parameters
     $stmt = $conn->prepare("INSERT INTO customer_table (firstname,
     lastname, email, address)
     VALUES (:firstname, :lastname, :email, :address)");

     //for placeholders, do like this:
     //VALUES (?, ?, ?, ?)");

     $stmt->bindValue(':firstname', $firstname, PDO::PARAM_STR);
     $stmt->bindValue(':lastname', $lastname, PDO::PARAM_STR);
     $stmt->bindValue(':email', $email, PDO::PARAM_STR);
     $stmt->bindValue(':address', $address, PDO::PARAM_STR);

     //for placeholders, do like this:
     //$stmt->bindValue(1, 'firstname', $firstname, PDO::PARAM_STR);
     //$stmt->bindValue(2, 'lastname', $lastname, PDO::PARAM_STR);
     //$stmt->bindValue(3, 'email', $email, PDO::PARAM_STR);
     //$stmt->bindValue(4, 'address', $address, PDO::PARAM_STR);

     // insert a row of data

     $firstname = "Joe";
     $lastname = "Public";
     $email = "joe@example.com";
     $address = "123 Main St";
     $stmt->execute();

     // perhaps later, you can insert a new row of data as well

     $firstname = "Jane";
     $lastname = "Doe";
     $email = "jane@example.com";
     $address = "666 Main St";

     // now execute it to take effect
     $stmt->execute();

     // perhaps later, you can insert a new row of data as well

     $firstname = "Julie";
     $lastname = "Johnson";
     $email = "julie@example.com";
     $address = "777 Main St";

     // now execute it to take effect
     $result = $stmt->execute();

     echo "New records created successfully";
    }
catch (PDOException $e)
    {
     echo "Error: Cannot insert data into the database. " .
     $e->getMessage();
    }
?>
The above example performs an INSERT query using bindValue() to bind the parameter values to the named parameters. Notice also that you can use this technique with placeholders as well. Just substitute placeholders in place of named parameters as shown. For placeholders, the first argument contains the exact positional order, starting from the index 1 and increment by 1. The last argument contains the data type constant. For more about data type constant, please check out type constants. Notice that in PDO/MySQL, there isn't anything for floating or double data type due to differnet country uses different symbol to denote decimal point, for example, France uses comma (,) to denote a decimal point. So decimals points are treated as strings. No PDO::PARAM_DOUBLE OR PDO::PARAM_FLOAT exist, so use PDO::PARAM_STR instead. For example, 22.80 will be treated as '22.80' as strings, and you can convert it into double or float data type when you format your data calculation outside of the database.
Query the Database
With all the connection, error handling, a table created and data have been inserted into the table and ready to go, let's fetch (retrieve) some information from it. There's two core ways to accomplish this task: query and execute. Let's illustrate both, starting with query() function. The query() is the "all-purpose" PDO function for query and update the data. This function is similar to the old API's mysql_query() function. So you can use query() just like you use mysql_query(). It's a very versatile and easy to use function for PDO. See the example below:Fetching data
<?php
include('Home/Database/connection.php');

$customer_name = 'Bill'; # user-supplied data

try
    {
     $conn = new PDO("mysql:host=$hostingserver;dbname=$databaseName",
                                             $username, $password);
     $conn->setAttribute(PDO::ATTR_ERRMODE,
                         PDO::ERRMODE_EXCEPTION);
    }
catch (PDOException $e)
    {
     echo 'Cannot connect to the database. ' . $e->getMessage();
    }
try
    {
     $data = $conn->query('SELECT * FROM customer_table
             WHERE customer_name = ' . $conn->quote($customer_name));

     foreach($data as $row)
           {
            print_r($row);
           }
    }
catch (PDOException $ex)
    {
     echo 'ERROR: Cannot select the data. ' . $ex->getMessage();
    }
?>
Notice that we're still manually escaping the customer's data with the PDO::quote method. This method is more or less the PDO equivalent to using mysql_real_escape_string (for the good old MySQL API); it will both escape and quote the string that you pass to it. It will work just fine but not as elegant and powerful as prepared statements. In situations, when you're binding user-supplied data to a SQL query, (e.g., data from form entries entered by users), it's strongly advised that you instead use prepared statements. See examples to come for user-supplied data in the next examples.
If your SQL queries are not dependent upon form data [user-supplied data], the query method above is a helpful choice and there is nothing wrong for using it; and furthermore, it makes the process of looping through the results as easy as a foreach statement (as the code above shows). It returns the result as an array of key/value pair. So using the foreach() as above, $row['customer_name'] returns a customer name, e.g., Jane Doe, as the value using 'customer_name' as the key.
Prepared Statements
The second and more elegant way (than query()) to program in PDO is to use prepared statements because one of the reasons that PDO came to existence is to be able to prepare data and fetch those data conveniently as some of the more robust database engines have. Prepared statements basically work like this:- Prepared statements work in two steps: prepare and execute.
- Prepare: Prepare an SQL statement by creating a blank SQL template similar to a blank form where fields contain no values and send that blank template to the database. Certain values of the template, called placeholders (labeled "?") and named values or parameters (labeled ":"), are left unspecified for security reason. For example: INSERT INTO Membership_Table(name, id, email) VALUES(?, ?, ?) or in colon notation, called named parameters (labeled ":"). As you can see, no values are sent to the script -- just a blank template.
- The database parses, compiles, and performs query optimization on the SQL statement template, and stores the result without executing it.
- Execute: At a later time, the application references the blank SQL template containing the compiled result and binds the values (that were sent later in a seperate query) to the parameters (that were sent earlier in the template), and the database executes the final query to get the final result. The application may execute the statement as many times as it wants with different values and binding those values to the fields in the blank template. This is the beauty of the prepare statement.
Prepared statements offer two major benefits:
- The query only needs to be parsed (or prepared) once, but can be executed multiple times with the same or different parameters. When the query is prepared, the database will analyze, compile and optimize its plan for executing the query. For complex queries this process can take up enough time that it will noticeably slow down an application if there is a need to repeat the same query many times with different parameters. By using a prepared statement the application avoids repeating the analyze/compile/optimize cycle. This means that prepared statements use fewer resources and thus run faster.
- The parameters to prepared statements don't need to be quoted (unlike the one example above); the driver automatically handles this kind of escaping on its own without programmers need to mannually do it themselves. If you write your application exclusively using prepared statements, you can be sure that no SQL injection will occur (however, if other portions of your query are being built up with unescaped input, SQL injection is still possible).
So, you still have to be carefull with your code even though prepared statements take care most of security issues for you.
Prepared statements are so useful that they are the only feature that PDO will emulate for drivers that don't support them. This ensures that an application will be able to use the same data access paradigm regardless of the capabilities of the database.
Earlier, the table was being created using the "all-purpse" function query(). As often the case, using prepare() function statement is more robust than using the "all-purpse" function query(). It is strongly recommended that you use prepare() function statement for all of your database programming, including in liu of the "all-purpse" function query() that was illustrated earlier.
In other words, the "all-purpse" function query() illustrated earlier merely for illustration purpose only and not recommended for production. For your every day programming chores, use prepare() function instead.
Let's use prepare() function statement instead of the "all-purpse" function query() to create tables. Here it is:
Creating a table
<?php
//create a table named user_table if it doesn't exist in the database name
try
    {
     // assuming variable $conn has been initialized with a PDO instance
     $sql = $conn->prepare("CREATE TABLE IF NOT EXISTS `user_table`
            (
             `id` int(10) NOT NULL auto_increment, //id is increment automatically
             `name` varchar(25) NOT NULL,
             `address` varchar(64),
             `email` varchar(64) NOT NULL,
             //just to have a variety for demonstrative purpose
             `price` float(10, 2), //can be null,10 digits with 2 decimal
             `description` text(64), //also can be null
             `date_time` timestamp DEFAULT CURRENT_TIMESTAMP NOT NULL,
             // the following definitions are advanced uses for key manipulations
             PRIMARY KEY (`id`), //used for referring to certain id
             UNIQUE KEY `id` (`id`), //for referring to a unique id
             // full text searching similar to Google search
             FULLTEXT (`name`, `address`, `email`, `description`)
            )

     //MySQL 5.7 or higher: InnoDB is the default storage engine but
     //consumes more bytes.
     //So MyISAM is the preferred choice here/consuming less bytes and
     // runs faster.

     // Optional: DEFAULT CHARSET=utf8 COLLATE=utf8_unicode_ci
     // Just put only: ENGINE=MyISAM");
     // without the optional: DEFAULT CHARSET=utf8 COLLATE=utf8_unicode_ci

     ENGINE=MyISAM  DEFAULT CHARSET=utf8 COLLATE=utf8_unicode_ci");

     // execute the query to create the table
     $result = $sql->execute();
    }
catch (PDOException $e)
    {
     echo "Error: Fail to create a table. " . $e->getMessage();
    }
?>
There you have it! It is very simple to create a table using prepare() function statement.
To insert data into the table using prepare() function statement, do the following:
Inserting data into a table
<?php
// assuming $conn is an instance of a PDO
// we insert a website's visitors tracking:
// page hits!

// you can replace named parameters (:) below
// with placeholders (?, ?, ?) as well and
// it will work just fine!

// now we prepare the sql statement using named parameters

$stmt = $conn->prepare('INSERT INTO pagecounter(
                                                page_name,
                                                referer,
                                                page_hit
                                               )

                                          VALUE(
                                                :page_name,
                                                :referer,
                                                :page_hit
                                               )
                      ');

// now that the sql statement has been prepared,
// we can go ahead and execute it using actual
// values!

$result = $stmt->execute
           (
            [':page_name' => $page, ':referer' => $referer, ':page_hit' => '1']
           );
?>
Here is a complete site tracking code above that illustrates prepare() function statement using SELECT(), INSERT INTO() and UPDATE() function statements:
Site tracking script
<?php
// for a better and secure practice, you should
// put these connection parameters outside of
// this script!

$host         = '';
$databaseName = '';
$username     = '';
$password     = '';

$page = $_SERVER['SERVER_NAME'] . $_SERVER['PHP_SELF'] . '?' .
        $_SERVER['QUERY_STRING'];

$referer = $_SERVER['HTTP_REFERER'];

$param = [
          ':page' => $page,
          ':referer' => $referer,
          ':page_hit' => $page_hit
         ];

try
    {
     $conn = new PDO("mysql:host=$host;dbname=$databaseName",
                                              $username, $password);

     $conn->setAttribute(PDO::ATTR_ERRMODE, PDO::ERRMODE_EXCEPTION);
    }
catch (PDOException $e)
    {
     echo 'Cannot connect to the PDO database. ' . $e->getMessage();
    }

$sql = $conn->prepare("SELECT * FROM pagecounter
                                WHERE page_name = :page")

$result = $sql->bindParam(':page', $page);

if ($result)
   {
    foreach ($result as $row)
          {
           $counter = $row['page_hit'] + 1;
          }

    $update = $conn->prepare('UPDATE pagecounter
                              SET page_name = :page,
                                  referer   = :referer,
                                  page_hit  = :page_hit
                            ');

    // $update->execute([$page, $referer, $counter]);

    // or we can make it a cleaner illustration using $param
    $update->execute($param);
   }
else
   {
    $stmt = $conn->prepare('INSERT INTO pagecounter(
                                                    page_name,
                                                    referer,
                                                    page_hit
                                                   )

                                              VALUE(
                                                    :page,
                                                    :referer,
                                                    :page_hit
                                                   )
                          ');

    // or you could put the three array items in a variable
    // and just put that variable as the argument as well!

    $result = $stmt->execute(
                             [':page' => $page,
                              ':referer' => $referer,
                              ':page_hit' => '1'
                             ]
                            );
   }

// and now we're done, close the database
$conn = null;
?>
Let's continue on the topic of situations where data are obtained via form entries by users (user-supplied data). The example below fetches data based on a key value supplied by a form. An unsecure form is shown to users to enter username and password. The user input is automatically quoted, so there is no risk of a SQL injection attack.
Fetching data
<?php
include('Home/Database/connection.php');

//get username and password from user input
$user = $_GET['username']; //e.g.: myuser123
$pass = $_GET['password']; //e.g.: mypass123
try
    {
     $conn = new PDO("mysql:host=$hostingserver;dbname=$databaseName",
                                             $username, $password);
     $conn->setAttribute(PDO::ATTR_ERRMODE,
                         PDO::ERRMODE_EXCEPTION);
     }
catch (PDOException $e)
    {
     echo 'Cannot connect to the database. ' . $e->getMessage();
    }
try
    {
     $stmt = $conn->prepare("SELECT * FROM membership_table
             WHERE username = :username AND password = :password");

     // you should make a habbit to use array shortcut: [] instead!
     // for example: $stmt->execute([$user, $pass]);

     $result = $stmt->execute(array($user, $pass));
     //here if you want to know how many rows selected
     $rowcount = $result->rowCount();

     if ($rowcount > 0)
        {
         echo($rowcount . ' rows'); // output # of rows selected
        }

     // set any fetch mode constants: OBJ, NUM, ASSOC, BOTH,
     // LAZY, CLASS, etc. Here I use OBJ
     $result->setFetchMode(PDO::FETCH_OBJ);

     while ($rows = $result->fetch())
         {
          $username = $rows->username;
          $password = $rows->password;
         }
    }
catch (PDOException $e)
    {
     echo 'ERROR: Cannot retrieve data. ' . $e->getMessage();
    }
?>
Note that PDO provides several fetch modes and the above example uses PDO::FETCH_OBJ objects fetch mode that returns the resultset as an object that you can refer to its fields as objects (e.g., $rows->password.)
Other fetch modes such as PDO::FETCH_ASSOC returns the rows as an associative array with the field names as keys (e.g., $rows['username']); PDO::FETCH_NUM returns the row as a numerical array (e.g., $rows[0], $rows[1], $rows[2], $rows[3]).
The default is to fetch with PDO::FETCH_BOTH which duplicates the data with both numerical and associative keys. It's recommended that you specify one or the other so you don't have arrays that are double the size. In other words, don't use PDO::FETCH_BOTH because it consumes twice the memory compared to, say, [if you use either], PDO::FETCH_ASSOC or PDO::FETCH_NUM.
And here is another form of the example of the code above:
Fetching data
<?php
include('Home/Database/connection.php');

//get username and password from user input
$user = $_GET['username']; //e.g.: myuser123
$pass = $_GET['password']; //e.g.: mypass123
try
    {
     $conn = new PDO("mysql:host=$hostingserver;dbname=$databaseName",
                                             $username, $password);
     $conn->setAttribute(PDO::ATTR_ERRMODE,
                         PDO::ERRMODE_EXCEPTION);
    }
catch (PDOException $e)
    {
     echo 'Cannot connect to the database. ' . $e->getMessage();
    }
try
    {
     //a fancy way of programming but not easy to understand!
     $format = sprintf("SELECT * FROM %s
                        WHERE username = :%s AND password = :%s",
                        membership_table, username, password);
     $stmt = $conn->prepare("$format");

     // you should make a habbit to use array shortcut: [] instead!
     // for example: $stmt->execute([$user, $pass]);

     $result = $stmt->execute(array($user, $pass));
     //here if you want to know how many rows selected
     $rowcount = $result->rowCount();

     if ($rowcount > 0)
        {
         echo($rowcount . ' rows'); // output # of rows selected
        }

     // set any fetch mode constants: OBJ, NUM, ASSOC, BOTH,
     // LAZY, CLASS, etc. Here I use ASSOC
     $result->setFetchMode(PDO::FETCH_ASSOC);

     while ($rows = $result->fetch())
         {
          $username = $rows['username'];
          $password = $rows['password'];
         }
    }
catch (PDOException $e)
    {
     echo 'ERROR: Cannot retrieve data. ' . $e->getMessage();
    }
?>
Do you see what's going on here? Sure, you do! The prepared statement line, literally, prepares the query to select or retrieve data from the database, before the user's data that we get from the login form has even been attached to the code yet. There are no values to compare at this stage -- just placeholders (or dummy variables) for future comparison. Can you picture that? Now, the one statement below the prepared statement is the one that actually doing the comparing or binding.
With this technique, SQL injection is virtually impossible, because the data doesn't ever get inserted into the SQL query, itself.
Here is another code example that I wrote for my in-house shopping cart using PDO database:
Fetching data
<?php
include("Home/Database/Credential.php");
try
    {
     $conn = new PDO("mysql:host=$hostingserver;dbname=$databaseName",
                         $username, $password);
     $conn->setAttribute(PDO::ATTR_ERRMODE,
                         PDO::ERRMODE_EXCEPTION);
     }
catch (PDOException $e)
    {
     echo 'Cannot connect to the database. ' . $e->getMessage();
    }
try
    {
     $sql = $conn->prepare("SELECT * FROM Products");
     $result = $sql->execute();

     // set any fetch mode constants: OBJ, NUM, ASSOC, BOTH,
     // LAZY, CLASS, etc. Here I use BOTH
     $result->setFetchMode(PDO::FETCH_BOTH);
     echo '<table>';

     while ($rows = $result->fetch())
         {
          echo '<tr>';
          echo '<td>' .  $rows->ProductNum . </td>;
          echo '<td>' .  $rows->ProductName . </td>;
          echo '<td>' .  $rows->ProductPrice . </td>;
          echo '<td>' .  $rows[3] . </td>; /* ProductImage */
          echo '<td>' .  $rows[4] . </td>; /* ProductURL */
          echo '<td>' .  $rows[5] . </td>; /* ProductDescr. */
          echo '</tr>';
         }
     echo '</table>';
    }
catch (PDOException $e)
    {
     echo 'ERROR: Cannot retrieve data. ' . $e->getMessage();
    }
?>
Named Parameters
Notice that in the example above, instead of actual variables, we use named parameters (:username and :password) to specify placeholders. The (:) colon in front of the variables is called named parameters and named paramters are dummy (temporary) variable names to stand in and get referenced internally by PDO.As oppose to placeholders (to be described next), we don't care about position/order of values of record in the query -- we only care about the names of the record. That's why it's called named parameters because we only need to know the names of the record and not the order or position of the record. You don't need to know the technical detail working of named parameters other than just dummy or temporary variables standing and ready to be reference by PDO.
Also, for the resultset object, you can refer to the column names (e.g., ProductNum, ProductName, ProductPrice, ProductImage, etc.,) to get the values stored under those names in the database table. It's very self-explanatory stuff.
Here is another example with the use of array to fetch the data:
Fetching data
<?php
include('Home/Database/connection.php');
/*
 * The Prepared Statements Method
 * Best Practice
 */
$cutomer_id = xyz999; //obtained from a user input insecure form
$order_number = 'abc123'; //user-supplied input from an insecure form

try
    {
     $conn = new PDO("mysql:host=$hostingserver;dbname=$databaseName",
                                             $username, $password);
     $conn->setAttribute(PDO::ATTR_ERRMODE, PDO::ERRMODE_EXCEPTION);
    }
catch (PDOException $e)
    {
     echo 'Cannot connect to the database. ' . $e->getMessage();
    }
try
    {
     //Initiate the database handshake with mysql by passing the
     //query to it
     $stmt = "SELECT * FROM customer_table
             WHERE order_number like ? AND customer_id like ? ";

     # Prepare to retrieve customer's data from database
     # using ??????
     $stmt = $conn->prepare($stmt);
     # Execute the retrieval and binds the palceholders using ?? to
     # customer's data (variables)

     $result = $stmt->execute(array(
                          'order_number' => ' . $order_number . ',
                          'customer_id' => ' . $cutomer_id . '
						  ));

     // Affected Rows?
     //Like if you want to know how many rows selected?
     // Use rowCount() and it is similar to mysql_num_rows()
     echo $stmt->rowCount(); //  1 row

     // setting mode
     $result->setFetchMode(PDO::FETCH_BOTH);

     //Or grab values in selected row in resultset using while loop

     while ($rows = $result->fetch())
         {
          $ProductNum = $rows->ProductNum;
          $ProductName = $rows->ProductName;
          $ProductPrice = $rows->ProductPrice;
          $ProductImage = $rows[3];
          $ProductURL = $rows[4];
          $Description = $rows[5];
         }
    }
catch (PDOException $e)
    {
     echo 'ERROR: Cannot retrieve the data. ' . $e->getMessage();
    }
?>
Positional Placeholders
The query above uses question marks (?) to designate the position of values in the prepared statement. This is similar to named parameters just described earlier, and these question marks are called positional placeholders.Placeholders operate in a system of sequential order; and thus, we must take care of proper order of the elements in the array that we are passing to the PDOStatement::execute() method.
In the named parameters you don't have to place your variable parameters in the exact order, but in positional placeholders you do.
[The double colon (::) is a PHP operator and is the same as --> in PHP and it is used to access or refer to an object's method or constant. In this case, PDOStatement object is referencing or accessing its method called execute()].
Above, the execute statement, executes the query, while passing an array, which contains the data that should be bound to those placeholders (4 of them: ?. ?, ?, ?).
Note that neither form is better than the other, however, the latter makes for a less-readable experience. So stick with the former named parameters, instead.
Updating Records
Another frequent operation we need to do in database management is to update records, and here is how you update the records:Updating data
<?php
include("Home/Database/Credential.php");
try
    {
     $conn = new PDO("mysql:host=$hostingserver;dbname=$databaseName",
                         $username, $password);
     $conn->setAttribute(PDO::ATTR_ERRMODE,
                         PDO::ERRMODE_EXCEPTION);
    }
catch (PDOException $e)
    {
     echo 'Cannot connect to the database. ' . $e->getMessage();
    }
try
    {
     $conn->query("UPDATE Customers_Table
               SET Price = 99.95
               AND Description = "Men's Suits On Sale"
               WHERE ID = ($_POST['id'])");
    }
catch (PDOException $e)
    {
     echo 'ERROR: Cannot update the records. ' . $e->getMessage();
    }
?>
Notice the use of the "all-purpose" query() function to query the update operation. For more information, check this out: PDO query() function
As always the case, instead of using query() function, it is strongly recommended that you use prepare() function instead for all of your database operations. It is more robust and efficient.
Another point to note is that if you have more fields to update just append the AND operator to the SET statement and you're fine. The above example uses query() to do the update operation but you can use execute() to achieve the same result as the above example, like so:
Updating data
<?php
include("Home/Database/Credential.php");
try
    {
     $conn = new PDO("mysql:host=$hostingserver;dbname=$databaseName",
                         $username, $password);

     $conn->setAttribute(PDO::ATTR_ERRMODE,
                         PDO::ERRMODE_EXCEPTION);
    }
catch (PDOException $e)
    {
     echo 'Cannot connect to the database. ' . $e->getMessage();
    }
try
    {
     $stmt = $conn->prepare("UPDATE Customers_Table
                   SET Price = ?,
                       Description = ?
                   WHERE ID = ?
                  ");

     //And here we're supplying the actual values
     $id = 'abc123';
     $price = 99.95;
     $description = "Men's Suits On Sale";

     // And here we're executing the actual binding of values
     result = $stmt->execute(array($price, $description, $id));
     $affected_rows = result->rowCount();
    }
catch (PDOException $e)
    {
     echo 'ERROR: Cannot update the records. ' . $e->getMessage();
    }
?>
You can use either form of the examples above; however, the later one is much more elegance and should be used instead of the former. Another point to note is that if you have more fields to update just list the SET statement name/value pairs by seperating them with a comma. In the execute() function's argument/parameter, you can comma-seperated the argument/parameter values in the execute() statement and follow the exact order and you're fined in the SET statement.
Remember that the order of the values in the SET clause is very important and it must follows the exact order in order for the update operation to work.
One Last Important Note
As always the case, instead of using query() function, it is strongly recommended that you use prepare() function instead for all of your database operations.A lot of code illustrations shown in this tutorial show you that you could accomplish a lot of database operations without using prepare() function; however, it is strongly recommended that you use prepare() function for all your database operations. It is more robust and efficient.
Handy SQL Commands
Table definitions you learned earlier using the CREATE TABLE syntax are not set in stone. In other words, you're free to alter them at a later date if you need to.
MySQL has SQL commands to let you do commands to alter the original table definitions using the ALTER TABLE command.
It lets you add or delete fields; alter field types; add, remove, or modify keys; alter the table type; and change the table name (among other things).
Typically, you would use phpMyAdmin program to execute these commands. If you rent a web hosting from a third party it usually has phpMyAdmin installed in your database that they provide you. So check with your web hosting vendor for more on the topic of phpMyAdmin.
You can also alter the table definitions in the SQL schema files as well. See an SQL schema file example later on.
Here is a brief screen shot of the phpMyAdmin that I captured it partially to illustrate the command:
As you can see from the example screen shot illustrated above, you can just enter the command in the 'Run SQL query' pane when you click on the 'SQL' menu option at the top and it opens the sql query pane for you to enter the command.
At the bottom of that screen shot there should be a 'Go' button for you to press to send the command to be executed. It got cut off from the illustration above due to a space constraint.
The following examples illustrate the various operations:
To rename a table name bill to a new name of invoice, do the following:
// notice that you would use phpMyAdmin app to execute
// these commands!

// just open up your phpMyAdmin program and type the following
// commands and press 'Go' button in your phpMyAdmin app!

// notice that you can omit the semicolon ";" at the end as well!
// for example: ALTER TABLE bill RENAME TO invoice

           ALTER TABLE bill RENAME TO invoice;
Notice that you can omit the the clause 'to' from the command above and it'll works just fine. You can also use RENAME command instead of ALTER command to achieve the same result as above. For example:
// notice that you can omit the semicolon ";" at the end as well!

           RENAME TABLE bill TO invoice
Notice that you can omit the the clause 'to' from the command above and it'll works just fine. You can alter (or change) a field name (such as changing your phone category from home phone to cell phone) by doing the following:
// with a semicolon ";" at the end!

           ALTER TABLE user CHANGE homephone cellphone VARCHAR (255);
That is correct: there is no TO clause between homephone and cellphone, but you can include it in there if you like.
Notice also that you must specify the column definition "i.e., VARCHAR (255)" when changing a field name in this manner, or else MySQL will generate an error and disallow the operation.
Note also that it is customarily to use VARCHAR type for phone numbers instead of INT type because it is more flexible and allows you and your users to enter special characters as strings, eg., 612-888-1000 or (612)-888-1000.
Altering Field Properties
You can also alter the field property, that is, change the field name tel defined as VARCHAR(30) to a new field named age with a new definition of TINYINT(2). For example:
// change the field name tel defined as VARCHAR(30) to
// a new field named age with a new definition of TINYINT(2)

           ALTER TABLE user CHANGE tel age TINYINT(2);
When you CHANGE a field name from one type to another, MySQL will automatically attempt to convert the data in that field to the new type. If the data in the old field is inconsistent with the new field definition--for example, a field defined as NOT NULL contains NULL values, or a field marked as UNIQUE contains duplicate values--MySQL will generate an error.
You can alter this default behavior by adding an IGNORE clause to the ALTER TABLE command that tells MySQL to ignore such inconsistencies.
You can also modify the field size, say changing a 'Username' field, from 10 to 20. For example:
// changing a 'Username' field size from 10 to 20

           ALTER TABLE user CHANGE Username Username VARCHAR(20);
Notice also that you don't have to include the first field size value but you have to include the field size value for the second field.
Adding and Removing Fields and Keys
The following demonstrates how to add a new field named salary to the Employee table:
// add a new field named salary to the Employees table

           ALTER TABLE Employee ADD salary INT(7) NOT NULL;
You can also delete a field from a table:
// delete a field called 'salary' from a table called 'Employee'

           ALTER TABLE Employee DROP salary;
You can also delete a table's primary key:
// delete a table's primary key

           ALTER TABLE Employee DROP PRIMARY KEY;
You can also add a primary key to the table. Note that the table must not contain any primary key prior to performing this operation; hence, what's the point in adding a new primary key if one already exists?:
// add a primary key to the table

           ALTER TABLE Employee ADD PRIMARY KEY (id);
Note that a table's primary key must always be defined as NOT NULL -- and cannot be defined as NULL.
Altering Table Types
You can alter the table type by using a TYPE clause in the ALTER TABLE statement. Fore example, the following alters (or changes) the table type from whatever it was defined to a new table type of INNODB.
// alter the table type by using a 'TYPE' clause
// options: INNODB, MYISAM

           ALTER TABLE Employee TYPE = INNODB;
Creating Tables Using SQL Schema
You can create tables in a variety of ways based on your own preference. One of the popular ways of doing that is to use SQL file schema. Let's see how to use SQL file schema to create tables.
Basically, you write SQL syntax to create tables like you learned earlier by specifying the table definitions and put those table definition in an SQL file and then import it to your phpMyAdmin application and phpMyAdmin generates the tables for you automatically.
Let's see what it looks like:
// pay attention to the comment syntax which is denoted as: --

// SQL schema uses '--' to specify comments and it won't execute it!

-- you can put any comments on your SQL schema definitions to help
-- you and your readers to identify what you're trying to do!

-- you can customize these SQL schema definitions to suite your objective
-- and then import it to your phpMyAdmin to execute it!

-- just copy these SQL schema definitions into a file and import that file
-- to your phpMyAdmin to execute it!

-- you have to name your file with the .sql extension.

-- try it!

-- Test it by importing the following file: dump.sql to your phpMyAdmin space
-- and see the effect of the schema!

-- Login to your phpMyAdmin account space either live or via a localhost and
-- navigate to your current database!

-- If you have some tables already in your database it should list them in your
-- database! If not, your database contains nothing! An empty space waiting for
-- you to create some tables!

-- At the top of your phpMyAdmin space there should be a bunch of menu items that
-- you can choose to work with your database and among them are 'import' and 'export'
-- buttons for you to click to import/export your schema files!

-- Just follow the on-screen instructions and you'll be fine!
-- There are plenty of tutorials on YouTube on how to import/export schema files!
-- Check it out!
--
-- Here is the start of the schema file!
--
-- SQL schema file: dump.sql
--

-- As you can see these are just comments spits out by phpMyAdmin engine!
--

-- phpMyAdmin SQL Dump
-- version 4.2.10
-- http://www.phpmyadmin.net
--

-- Host: localhost:8889
-- Generation Time: Jan 02, 2015 at 01:44 PM
-- Server version: 5.5.38
-- PHP Version: 5.6.2

SET SQL_MODE = "NO_AUTO_VALUE_ON_ZERO";
SET time_zone = "+00:00";

--
-- Database: `mydb12345`  <---- it spits out a database name as well!
--

--
-- From here and on is the actual table definitions!
--
-- You need to create these definitions that suite your objective!
--

-- --------------------------------------------------------

--
-- Table structure for table `comment`
--
-- You can customize this table definition to fit your objective
--
-- Notice that when creating a new table you need to check if an old table
-- already exists!
--
-- If it already exists it will delete it (or drop it from the current database)
--
-- You don't want your outdated old table hiding in your database and messing up
-- your projects and creating bugs!
--
-- If you don't test it and for some reason you happen to have an old table
-- stuck somewhere in your database and this 'CREATE TABLE' command won't create
-- a new table for you as well, making you having to hunt for that old table
-- and trying to delete it while wasting time and having a lot of headach!
--
-- By putting DROP TABLE IF EXISTS `xxx` command, it will delete it for you
-- automatically, saving you time and headach!
--
-- That's why it is a very good habit to always test it before creating a new table!
--

DROP TABLE IF EXISTS `comment`;

CREATE TABLE `comment`
              (
               `id` int(11) NOT NULL,
               `uid` int(11) DEFAULT NULL,
               `feed_id` int(11) DEFAULT NULL,
               `comment` mediumtext,
               `time_stamp` datetime DEFAULT NULL
              )
ENGINE=InnoDB AUTO INCREMENT=4 DEFAULT CHARSET=latin1;

--
-- Dumping data for table `comment`
--
-- After creating a table you can insert any initial data as well!
--
-- If there are no initial values to be inserted during the table creation time,
-- there is no need to include an 'INSERT INTO' statement because data is
-- inserted at runtime! Self-explanatory!

-- Notice that the definition for the table `comment` above contains
-- an auto increment command that set to equal to 4 telling phpMyAdmin
-- to auto increment the next id to number 4 because the first 3 rows
-- have been used in the INSERT INTO code below already! See below:
--
-- If you want phpMyAdmin to start the auto increment at a different
-- or higher than number 4, you can change the above AUTO_INCREMENT=4 to
-- whatever number you wish. For example: AUTO_INCREMENT=10.
--

INSERT INTO `comment`
               (`id`, `uid`, `feed_id`, `comment`, `time_stamp`)
            VALUES
                 (1, 1, 2, 'sample comment', '2014-11-14 15:05:44'),
                 (2, 1, 2, 'another sample comment', '2014-11-14 15:05:50'),
                 (3, 1, 3, 'wow', '2014-11-14 15:40:27');

-- --------------------------------------------------------

--
-- Table structure for table `feed`
--
-- It is a very good habit to always test if a table already exists before creating
-- a new table!
--

DROP TABLE IF EXISTS `feed`;
CREATE TABLE `feed`
                  (
                   `id` int(11) NOT NULL,
                   `uid` int(11) DEFAULT NULL,
                   `feed_original` longtext,
                   `feed` longtext,
                   `feed_url` varchar(500) DEFAULT NULL,
                   `feed_container` longtext,
                   `feed_type` varchar(10) DEFAULT NULL,
                   `time_stamp` datetime DEFAULT NULL,
                   `view` int(11) DEFAULT NULL
                  )
ENGINE=InnoDB AUTO INCREMENT=1 DEFAULT CHARSET=latin1;

-- As you can see from the above 'feed' table,
-- if there are no initial values to be inserted during the table creation time,
-- there is no need to include an 'INSERT INTO' statement because data is
-- inserted at runtime! Self-explanatory!

-- Notice that the definition for the table `feed` above contains
-- an auto increment command that set to equal to 1 telling phpMyAdmin
-- to auto increment the next id to number 1 because there isn't any
-- row has been used in the INSERT INTO code! No INSERT INTO clause!
--
-- In this case, we set it to 1 to make phpMyAdmin to start the auto
-- increment with 1.
--
-- If you want phpMyAdmin to start the auto increment at a different
-- or higher than number 1, you can change the above AUTO_INCREMENT=1 to
-- whatever number you wish. For example: AUTO_INCREMENT=5.
--

-- --------------------------------------------------------

--
-- Table structure for table `follower`
--
-- It is a very good habit to always test if a table already exists before creating
-- a new table!
--

DROP TABLE IF EXISTS `follower`;
CREATE TABLE `follower`
                      (
                       `id` int(11) NOT NULL,
                       `uid` int(11) DEFAULT NULL,
                       `follow_id` int(11) DEFAULT NULL,
                       `time_stamp` datetime DEFAULT NULL
                      )
ENGINE=InnoDB AUTO INCREMENT=2 DEFAULT CHARSET=latin1;


--
-- Dumping data for table `follower`
--
-- Notice that the definition for the table `follower` above contains
-- an auto increment command that set to equal to 2 telling phpMyAdmin
-- to auto increment the next id to number 2 because the first row has
-- been used in the INSERT INTO code below already! See below:
--
-- If you want phpMyAdmin to start the auto increment at a different
-- or higher than number 2, you can change the above AUTO_INCREMENT=2 to
-- whatever number you wish. For example: AUTO_INCREMENT=10.
--

INSERT INTO `follower`
                     (
                      `id`, `uid`, `follow_id`, `time_stamp`
                     )
               VALUES
                     (
                      1, 1, 1, '2014-11-14 15:00:07'
                     );


-- --------------------------------------------------------

--
-- Table structure for table `likes`
--
-- Notice that as a rule of thumb: DO NOT use plural!
--
-- However, this one is an exception!
--
-- It is a very good habit to always test if a table already exists before creating
-- a new table!
--

DROP TABLE IF EXISTS `likes`;
CREATE TABLE `likes`
                   (
                    `id` int(11) NOT NULL,
                    `uid` int(11) DEFAULT NULL,
                    `feed_id` int(11) DEFAULT NULL,
                    `time_stamp` datetime DEFAULT NULL
                   )
ENGINE=InnoDB AUTO INCREMENT=2 DEFAULT CHARSET=latin1;


--
-- Dumping data for table `likes`
--

INSERT INTO `likes`
                  (
                   `id`, `uid`, `feed_id`, `time_stamp`
                  )

            VALUES
                  (
                   1, 1, 2, '2014-11-14 15:05:39'
                  );


-- --------------------------------------------------------

--
-- Table structure for table `notification`
--
-- It is a very good habit to always test if a table already exists before creating
-- a new table!
--

DROP TABLE IF EXISTS `notification`;
CREATE TABLE `notification`
                   (
                    `id` int(11) NOT NULL,
                    `uid` int(11) DEFAULT NULL,
                    `agent` int(11) DEFAULT NULL,
                    `target` int(11) DEFAULT NULL,
                    `action` varchar(20) DEFAULT NULL,
                    `time_stamp` datetime DEFAULT NULL,
                    `status` int(11) DEFAULT NULL
                   )
ENGINE=InnoDB DEFAULT CHARSET=latin1;

-- As you can see from the above 'notification' table,
-- if there are no initial values to be inserted during the table creation time,
-- there is no need to include an 'INSERT INTO' statement because data is
-- inserted at runtime! Self-explanatory!
--

-- --------------------------------------------------------

--
-- Table structure for table `user`
--
-- It is a very good habit to always test if a table already exists before creating
-- a new table!
--

DROP TABLE IF EXISTS `user`;
CREATE TABLE `user`
                  (
                   `id` int(11) NOT NULL,
                   `name` varchar(30) DEFAULT NULL,
                   `address1` varchar(255) DEFAULT NULL,
                   `address2` varchar(255) DEFAULT NULL,
                   `city` varchar(255) DEFAULT NULL,
                   `state` varchar(30) DEFAULT NULL,
                   `zip` varchar(15) DEFAULT NULL,
                   `username` varchar(20) DEFAULT NULL,
                   `password` varchar(255) DEFAULT NULL,
                   `email` varchar(255) DEFAULT NULL,
                   `phone` varchar(20) DEFAULT NULL,
                   `description` varchar(1000) DEFAULT NULL,
                   `image_type` varchar(10) DEFAULT NULL,
                   `block` int(10) DEFAULT NULL,
                   `activation` varchar(10) DEFAULT NULL,
                   `type` int(10) DEFAULT NULL,
                   `access` int(10) DEFAULT NULL,
                   `feed_per_page` int(10) DEFAULT NULL,
                   `creation_timestamp` datetime DEFAULT NULL,
                   `lastlogin_timestamp` datetime DEFAULT NULL
                  )
ENGINE=InnoDB AUTO INCREMENT=4 DEFAULT CHARSET=latin1;

--
-- Dumping data for table `user`
--

INSERT INTO `user`
                 (`id`, `name`, `address1`, `address2`, `city`,
                  `state`, `zip`, `username`, `password`, `email`,
                  `phone`, `description`, `image_type`, `block`,
                  `activation`, `type`, `access`, `feed_per_page`,
                  `creation_timestamp`, `lastlogin_timestamp`
                 )

            VALUES
                 (1, 'Noon2noon', '555 main st', 'apt 10',
                     'minneapolis', 'mn', '55401', 'user',
                     '1a1dc91c907325c69271ddf0c944bc72',
                     'abc@noon2noon.com', '612-404-0778',
                     'Hey people im a new entry to this website...',
                     'server', 0, '1', 2, 1, 10, '2017-09-05 23:27:11',
                     '2017-09-05 23:37:45'
                 ),

                 (2, 'John Doe', '555 main st', 'apt 10',
                     'minneapolis', 'mn', '55401', 'john',
                     '527bd5b5d689e2c32ae974c6229ff785',
                     'john@doe.com', '612-404-0778',
                     'Hey people im a new entry to this website...',
                     'server', 0, '1', 1, 1, 10, '2017-09-05 23:28:04',
                     '2017-09-07 01:03:42'
                 ),

                 (3, 'Jane Doe', '555 main st', 'apt 10',
                     'minneapolis', 'mn', '55401', 'jane',
                     '5844a15e76563fedd11840fd6f40ea7b',
                     'jane@doe.com', '612-404-0778',
                     'Hey people im a new entry to this website...',
                     'server', 0, '1', 1, 1, 10, '2017-09-05 23:31:11',
                     '2017-09-07 01:04:01'
                 );


--
-- Notice that after the table definitions have been created you can
-- alter the definitions if you forgot to include/delete any of the fields.
--
-- For example, the following we can add a primary key to the `comment` table
-- definition earlier because we forgot to create that table to have a primary key.
--
-- Likewise, we add a primary key to the rest of the tables that we forgot to
-- include it in the first place: `feed`, `follower`, `likes`, `notification`, etc.
--

-- Indexes for dumped tables
--


--
-- Indexes for table `comment`
--


ALTER TABLE `comment`
 ADD PRIMARY KEY (`id`);

--
-- Indexes for table `feed`
--


ALTER TABLE `feed`
 ADD PRIMARY KEY (`id`);


--
-- Indexes for table `follower`
--


ALTER TABLE `follower`
 ADD PRIMARY KEY (`id`);

--
-- Indexes for table `likes`
--

ALTER TABLE `likes`
 ADD PRIMARY KEY (`id`);

--
-- Indexes for table `notification`
--


ALTER TABLE `notification`
 ADD PRIMARY KEY (`id`);

--
-- Indexes for table `user`
--

ALTER TABLE `user`
 ADD PRIMARY KEY (`id`);

--
-- AUTO_INCREMENT for dumped tables
--

--
-- AUTO_INCREMENT for table `comment`
--

--
-- For MODIFY and many other SQL commands please checkout the
-- MySQL documentation:
-- https://dev.mysql.com/doc/refman/8.0/en/alter-table.html
--

ALTER TABLE `comment`
MODIFY `id` int(11) NOT NULL AUTO_INCREMENT, AUTO INCREMENT=4;

--
-- AUTO_INCREMENT for table `feed`
--

ALTER TABLE `feed`
MODIFY `id` int(11) NOT NULL AUTO_INCREMENT, AUTO INCREMENT=4;

--
-- AUTO_INCREMENT for table `follower`
--

ALTER TABLE `follower`
MODIFY `id` int(11) NOT NULL AUTO_INCREMENT, AUTO INCREMENT=2;

--
-- AUTO_INCREMENT for table `likes`
--

ALTER TABLE `likes`
MODIFY `id` int(11) NOT NULL AUTO_INCREMENT, AUTO INCREMENT=2;

--
-- AUTO_INCREMENT for table `notification`
--

ALTER TABLE `notification`
MODIFY `id` int(11) NOT NULL AUTO_INCREMENT;

--
-- AUTO_INCREMENT for table `user`
--

ALTER TABLE `user`
MODIFY `id` int(11) NOT NULL AUTO_INCREMENT, AUTO INCREMENT=2;


--   ==============================================================


--
-- Advanced Table Definition Design --
--
--
-- An important note about arranging table definitions in the schema file
--
-- Here is a note for advanced table definition design/creation:
--
-- When you use foreign key to refer to other tables (as the following example shows),
-- you need to put those tables at the top of the tables that is making the reference.
--
-- If you don't, it will give you an error saying:
-- "foreign key cannot reference x table"
--
-- This is because the schema generates the tables sequentially from top to bottom.
-- And when it generates the foreign key and that foreign key references a table that
-- hasn't been generated yet, it can't find that table that the foreign key is
-- referencing. So it will give an error and none of the tables will be created!
--
-- As you can see from the four schema tables below:
--
-- The 'permission' table references the 'rule' table and therefore the 'rule'
-- table has to be on the top of the 'permission' table. Otherwise, it will give
-- an error!
--
-- Likewise, 'parent_child' table and 'assignment' table (both) are referencing
-- the 'permission' table and therefore the 'permission' table has to come before
-- the 'parent_child' and 'assignment' tables.
--
--  Otherwise, it will give an error!
--

--
-- Clear all databases if exist so that we can have fresh databases--a good practice.
--


drop table if exists `rule`;
drop table if exists `permission`;
drop table if exists `parent_child`;
drop table if exists `assignment`;

-- --------------------------------------------------------

--
-- Table structure for table `rule`
--

create table `rule`
     (
      `name` varchar(64) not null,
      `data` text,
      `created_at` integer,
      `updated_at` integer,
      primary key (`name`)
     ) engine InnoDB;

--
-- Table structure for table `permission`
-- This table references `rule`(`name`) table on delete set null on update cascade
--

create table `permission`
     (
      `name` varchar(64) not null,
      `type` integer not null,
      `description` text,
      `rule_name` varchar(64),
      `data` text,
      `created_at` integer,
      `updated_at` integer,
      primary key (`name`),
      foreign key (`rule_name`) references `rule` (`name`)
                                           on delete set null
                                           on update cascade,
      key `type` (`type`)
     ) engine InnoDB;

--
-- Table structure for table `parent_child`
-- This table references `permission` (`name`) table on delete cascade
-- on update cascade
--

create table `parent_child`
     (
      `parent` varchar(64) not null,
      `child` varchar(64) not null,
      primary key (`parent`, `child`),
      foreign key (`parent`) references `permission` (`name`)
                                        on delete cascade
                                        on update cascade,

      foreign key (`child`) references `permission` (`name`)
                                        on delete cascade
                                        on update cascade
     ) engine InnoDB;

--
-- Table structure for table `assignment`
-- This table also references `permission` (`name`) table on delete cascade
-- on update cascade
--

create table `assignment`
     (
      `item_name` varchar(64) not null,
      `user_id` varchar(64) not null,
      `created_at` integer,
      primary key (`item_name`, `user_id`),
      foreign key (`item_name`) references `permission` (`name`)
                                           on delete cascade
                                           on update cascade,

      key `auth_assignment_user_id_idx` (`user_id`)
     ) engine InnoDB;
For many more (other) SQL commands please checkout the MySQL documentation:
MySQL documentation This concludes a brief but effective PDO database introduction. For more, please check out MySQL PHP API: PDO Database. Thanks! (Paul S. Tuon).In this tutorial, there are two parts:
- A programmers' handy quick PHP regex cheat sheet.
- The extended detail explanations and examples of the regular expression.
Part I: A Programmers' Handy PHP Regex Cheat Sheet
Here is a very simple regex quick reference cheat sheet. For an extended detail description of these regex expression pattern, please see the next section.
| Regex | Description |
| [abc] | Matches a single character: a, b or c |
| [^abc] | Matches any single character but a, b, or c |
| [a-z] | Matches any single character in the range a-z |
| [a-zA-Z] | Matches any single character in the range a-z or A-Z |
| ^ | Matches at the start of the word, string, or line. Example: ^p will match pop, people, propane, etc. |
| $ | Matches at the end of the word, string, or line. Example: p$ will match pop, gossip, setup, etc. |
| \A | Start of string |
| \z | End of string |
. |
A period '.' matches any single character no matter what that character is. |
| \s | Matches any whitespace character |
| \S | Matches any non-whitespace character |
| \d | Matches any digit |
| \D | Matches any non-digit |
| \w | Matches any word character (letter, number, underscore) |
| \W | Matches any non-word character |
| \b | Matches any word boundary character |
| (...) | (...) captures everything enclosed inside (). Note: (...) is typically being used to group the regex pattern and seperate one group of regex pattern from another. For example, matching a date string "10-15-2020":
"/(\d{2})-(\d{2})-(\d{4})/", $902.05: (^$\d)+(\.)\d{,2}, full name: My name is John Doe:
"/My name is ((\w+)\s(\w+))/". The \s matches any space as in between My and name, name and is, is and John, etc. |
| (a|b) | Alternative branches or choices a or b |
| a? | Matches zero or one occurence of a |
| a* | Matches zero or more occurence of a |
| a+ | Matches one or more occurence of a |
| a{3} | Matches exactly 3 occurences of a |
| a{3,} | Matches 3 or more occurences of a |
| a{3,6} | Matches between 3 and 6 occurences of a |
| i | Matches a case insensitive pattern |
| m | Makes dot match newlines |
| x | Ignores whitespace in regex |
| o | Performs #{...} substitutions only once |
Part II: Extended Detail Explanation of PHP Regex Cheat Sheet
The subject of regular expression (or mostly well-known as regex) is very long and extensive and not to mention very complex as well. For example, PHP 5.2.2 introduced two alternative syntaxes (?<name>pattern) and (?'name'pattern). For example:
<?php
/** First, the basic syntax! **/
// To extract the number from a date string: $result[0] = '10-20-2020'
preg_match("/(\d{2})-(\d{2})-(\d{4})/", "10-20-2020", $result)
/**
* To extract the number from a date string with keys: "year", "month", and "day".
*
* Now the array $result will additionally contain matched position 1, 2,
* and 3 as keys "year", "month", and "day", respectively.
*
* $result[0] = '10-20-2020'
* $result['year'] = '2020', $result['month'] = '10', $result['day'] = '20'.
*/
preg_match("/(?P<year>\d{4})-(?P<month>\d{2})-(?P<day>\d{2})/", "2020-10-20", $result)
preg_match('/(?P.+)/ ', $string, $match); // basic syntax
/** Now the alternative syntax! **/
preg_match('/(?.+)/ ', $string, $match); // alternative
preg_match("/(?'test'.+)/", $string, $match); // alternative
?>
As you can see, the subject of regex can fill an entire (tutorial) textbook. Don't be surprised if you see other code that contain syntax or syntaxes or expressions that are completely foreigned to you and not illustrated in this guide as well; because, the following tutorial on the subject of regex is just the tip of the iceberg. Nonetheless, please check out the following (second part of this regex) tutorial guide to learn more details on the subject of regex.
Defining a Regular Expression in PHP
To define a regular expression in PHP, you would enclose your regular expression definition inside the two forward slashes. For example:
<?php
/**
 * here, inside /....../ is where you put your regular expression pattern.
 * this is for a case-sensitive regular expression pattern to be matched
 */
$regex = '/......./';

// here, the 'i' is for a case-insensitive regular expression pattern to be matched
$regex = '/......./i';
?>
The two forward slashes /..../ are called delimiters or placeholders holding the actual regular expression pattern. They do absolutely nothing except acting as placeholders for the regular expression, and as such, you can actually use other non-regular-expression rare character tokens in place of the two forward slashes /..../.
For example, you could use these non-regular-expression rare character tokens as well: "~", "#", "%", or "@", and even "+" and "`" (back quote) are valid rare character tokens as well. For example:
<?php
/**
 * you can replace /....../ with the following rare characters as well:
 */
$regex = '~.......~';

$regex = '#.......#';

$regex = '%.......%';

$regex = '@.......@';

$regex = '+.......+';

$regex = '`.......`';
?>
As if the non-regular-expression rare character tokens listed above are not enough, you can actually use bracket style delimiters as well, where the opening and closing brackets are the starting and ending delimiter, respectively. For example: (), {}, [], and <> are all valid bracket style delimiter pairs. For example:
<?php
$string = 'Any of this individual example is of a correct pattern delimiter';

/**
 * you can replace /....../ with the following rare characters as well:
 */

$regex = '(this [is] a (pattern))';    // will match: this is a pattern

$regex = '{this [is] a (pattern)}';    // will match: this is a pattern

$regex = '[this [is] a (pattern)]';    // will match: this is a pattern

$regex = '<this [is] a (pattern)>';    // will match: this is a pattern
?>
As you can see, delimiter characters are not limited to just forward slashes /..../. As a matter of fact, it can be just any character, including Unicode characters as well. However, use them carefully to avoid problems. My suggestion is that to just use two or three of them consistently on your every day programming chores and stick with the same character or characters for the long haul.
Using just one probably my personal preference: forward slashes /..../.
The three most popular among programmers are, of course the forward slashes /..../, the rarily use character tilde ~....~, and the number sign #....# (in that order).
Bracket style delimiters illustrated above, just like any other characters, do not need to be escaped when they are used as meta characters within the pattern, but as with other delimiters they must be escaped when they are used as literal characters. If the delimiter needs to be matched inside the pattern it must be escaped using a backslash.
If the expression pattern contains forward slashes, such as http:// which can be hard to read using /..../, it is a good idea to choose another delimiter (i.e., #....#) in order to increase readability. For example:
<?php
// as you can see, this is very hard to read!
$regex = '/http:\/\//';

// whereas this, it is much easier to read!
$regex = '#http://#';
?>
PHP regular expression is typically being used with PHP's family of preg functions. In other words, to use regular expressions in PHP, you need to use one of PHP's family of preg functions listed below. These functions require you to enclose your expression pattern using the popular two forward slashes /..../ or any of the rare characters listed above.
preg_match() which performs a regular expression match; preg_match_all() which performs a global regular expression match; preg_replace() which performs a regular expression search and replace; preg_grep() which returns the elements of the input array that matched the pattern; preg_split() which plits up a string into substrings using a regular expression; and preg_quote() takes string and puts a backslash in front of every character that is part of the regular expression syntax. preg_quote() escapes regex patterns before they are applied. preg_quote's second parameter may be used to specify the delimiter to be escaped. See examples below.
This is useful if you have a run-time string that you need to match in some text and the string may contain special regex characters (like $ or the literal forward slash /). Here is a preview of a couple of examples to get you warmed up. For example.
<?php
$expression = '$40 for a g3/400';

/**
 * preg_quote() function may be used to escape a string for injection into a pattern
 * and its optional second parameter can be used to specify the delimiter to be escaped.
 * in this case, '/' is the delimiter for the regular expression: /..../
 *
 * as you can see above, before the expression can be used in the regex, it needs to be
 * escaped first by passing in '/' character to preg_quote() to be use as the delimiter
 * for the regular expression: /..../
 */

$result = preg_quote($expression, '/');

echo $result;

/**
 * This will produce the following result:
 *
 * $result = '\$40 for a g3\/400'
 */
?>
Here is another example to clarify this further:
<?php
/**
 * In this example, preg_quote($expression) is used to keep the asterisks from
 * having special meaning to the regular expression. It backslahes them!
 */

$expression = "*very*";

$result = preg_quote($expression, '/');

/**
 * as you can see above, before the $expression can be used in the regex, it needs to be
 * escaped first by passing in '/' character to preg_quote() to be use as the delimiter
 * for the regular expression: /..../
 *
 * notice that passing in '/' only tells PHP's family of 'preg' functions that you
 * intend to use '/' as a delimiter for your actual expression code.
 * it doesn't put '/' around the expression itself for you, however!
 */

/**
 * This will produce the following result:
 *
 * $result = "\*very\*";
 */

/**
 * Now that the strings have been escaped properly, we can use the
 * regex to search and match the strings. For example:
 */

$string = "This book is *very* difficult to find.";

/**
 * notice that passing in '/' above only tells PHP's family of 'preg' functions
 * (preg_replace() in this case) that you intend to use '/' as a delimiter for your
 * actual expression code as the following example shows.
 *
 * it doesn't put '/' around the expression itself for you, however!
 * as you can see below, "/" are put around the actual escaped expression $result
 *
 * $text contains the whole original string with an italic around the whole string.
 */

$text = preg_replace("/" . $result . "/", "<i>" . $string . "</i>");
?>
preg_quote() is useful if you have a run-time string that you need to match in some text and the string may contain special regex characters (i.e., $ and / in the above example).
Let's see preg_quote() being used with preg_match() to find occurrences of a given URL surrounded by whitespace:
<?php
$url = 'http://example.com/param?test=answer';

/**
 * preg_quote escapes the dot, question mark and equals sign in the URL (by default)
 * as well as all the forward slashes (because we pass '/' as the $delimiter argument).
 */

$escapeUrl = preg_quote($url, '/');

/**
 * as you can see above, before the url can be used in the regex, it needs to be escaped
 * by passing in '/' character to preg_quote()
 *
 * as you can see below, '/' are put around the actual escaped expression $escapeUrl
 */

$regex = '/\s' . $escapeUrl . '\s/';

// $regex is now:  '/\shttp\:\/\/example\.com\/param\?test\=answer\s/'

$string = "Bla bla some spaces http://example.com/param?test=answer bla bla some spaces";

preg_match($regex, $string, $match);

var_dump($match);

// array(1)
//    {
//     [0]=>
//     string(48) " http://example.com/param?test=answer " // note a space before/after url
//    }
?>
For more information on their usage of these PHP functions, please Google each function individually to learn more about them.
Now that the pre-emptive (preface) illustration and description and background of regex have been shown, let's start learning regex, starting with the basic syntax.
Basic Syntax
To use regular expressions (also known as regex), first you need to learn the syntax and its tokens. This syntax consists in a series of letters, numbers, dots, hyphens and special signs, which we can group together using different parentheses and place it inside the slashes shown above.
Regular expression syntax characters (also known as tokens) have special meaning within a regular expression, and these tokens are:
. * ? + [ ] ( ) { } ^ $ | \.
Notice that forward slash / is not among this group of tokens even though it is being used as a placeholder for every regular expression pattern. So the two forward slashes / absolutely do nothing except acting as placeholders for the regular expression.
When using these character tokens, you will need to backslash these character tokens whenever you want to use them literally. For example, if you want to match ".", you'd have to write \.; if you want to match "\", you'd have to write \\; if you want to match "^", you'd have to write \^; if you want to match "$", you'd have to write \$, and so on and so forth.
Let's take a look at these character tokens inidividually that make the basic building blocks of a regular expression. We start with meta characters:
<?php
/**
 * There are certain situations where you want to match at the beginning or end
 * of a line, word, or string. To do this you can use meta characters.
 * Two common meta characters are caret '^' which represent the start of the
 * string, and the dollar '$' sign which represent the end of the string.
 *
 * Here, the '^' is a meta character to signify as the starting point of
 * a line, word, or string that the regular expression needs to match.
 *
 * Likewise, the '$' is a meta character to signify as the end point of
 * a line, word, or string that the regular expression needs to match.
 *
 * And together they become:
 */

$regex = '/^....... $/';

/**
 * For example, to match all words or strings that start with an 'h' but don't care
 * with the rest of the characters are, do this:
 */

$regex = '/^h/';

/**
 * so here, if words or strings like house, hour, hearing, or harmony
 * come along it will match! but, if words or strings like
 * night, match, attach, or each come along it will not match
 * because the words or strings don't start with an 'h'.
 *
 * notice that this search and match is case-sensitive.
 * to search and match with case-insensitive use 'i' after the ending slash.
 */

/**
 * Likewise, to match all words or strings that end with an 'h' but don't care
 * with the rest of the leading characters are, do this:
 */

$regex = '/h$/';

/**
 * so here, if words or strings like match, each, or attach come along it will match!
 * but, if words or strings like house, hour, or harmony come along it will not match
 * because the words or strings don't end with an 'h'.
 */
?>
Character Class [....]
<?php
/**
 * next up is the square brackets [....].
 *
 * this is called character class.
 *
 * in mathetmatics gargon, it is called set or characters in a set.
 *
 * a character class always matches a single character out of a list of specified
 * characters (or set).
 *
 * for example, the expression [abc] matches only a, b or c character in the set
 * and nothing else.
 *
 * what does it mean:
 *
 * 'a character class always matches a single character out of a list of specified
 * characters' ?
 *
 * what does the above quote mean?
 *
 * 'matches a single character'? out of a list or set? seriously?
 *
 * yes, the sentence is a little misleading, and it is very confusing, too.
 *
 * so the best way to know what it means is to see some examples.
 * let's see some examples to help clarify this further.
 */
?>
Now let's see some examples using PHP's preg_match() function. This function is the most commonly used in the world of php regex. It returns a boolean to indicate whether it was able to match.
If you include a variable's name as a third parameter, such as $match in the example below, when there is a match, the variable $match will be filled with an array: element 0 for the entire match, element 1 for the first complete match string/word, element 2 for the second complete match string/word, element 3 for the third complete match string/word, and so on and so forth.
<?php
/**
 * notice the use of the character class [....] to look for only 'm' or 'l' in the
 * document ($string)
 */

$expression = "/ho[ml]e/";
$string = 'She bought a house near a nursing home which has a hole in the roof';

/**
 * Regular expression has two parts: the expression itself, which contains in
 * variable $expression, and the strings or text or document or file content that
 * you want to search and match. In this case, that document or string is contained
 * in variable $string.
 *
 * Knowing that, we can just go ahead and try to search and match the expression.
 *
 * As you can see, the expression starts out with the characters 'ho' and it tries
 * to match the strings in variable $string: 'She bought a house near a
 * nursing home which has a hole in the roof'.
 *
 * First, it looks in the first word 'She' and it couldn't find 'ho' in
 * the word 'She'.
 *
 * Next, it goes to the next word which is 'bought' and again it couldn't find 'ho'
 * there, either.
 *
 * Next it goes to the next character 'a' and it didn't match 'ho' there, either.
 *
 * Next it goes to the next character/word 'house' and it matches 'ho' in 'house'.
 *
 * Now that it found 'ho' in the word 'house', it is done with 'ho' for now.
 *
 * Now, it must go to the next expression which is inside the class definition [....... ].
 *
 * Inside the class definition is where it tries to match [m] and [l].
 *
 * So the next character in the strings to look for is 'm' after the characters 'ho' in
 * the word 'house'. But it couldn't find 'm' after 'ho' in the word 'house'.
 * It found a 'u'. But that is not what the expression wants.
 *
 * So it gives up on that partial matched and throws the word 'house' away and moves on.
 *
 * Now that it gave up the partial matched characters 'ho' in 'house',
 * it starts all over again to find 'ho' in other upcoming strings.
 *
 * Next it goes to the next character/word 'near' and it didn't match 'ho', either.
 * So it throws away 'near' and moves on!
 *
 * Next it goes to the next character 'a' and it didn't match 'ho', either.
 *
 * Next it goes to the next character/word 'nursing' and it didn't match 'ho', either.
 *
 * Next, it goes to the next word which is 'home', and lo and behold, it matches the
 * characters 'ho' in 'home'. Whoa! we have a match! Well, partially just like 'house'!
 * Well, it's a promising start, nonetheless!
 *
 * Now that it found 'ho' in the word 'home' it goes to the next expression which is
 * inside the class definition [....... ].
  *
 * Inside the class definition is where it tries to match [m] and [l].
 *
 * The next character in the strings to look for is 'm' after the characters 'ho' in
 * the word 'home'.
 * And it found 'm' in the word 'home' but couldn't find the character 'l' in the
 * word 'home'.
 *
 * Had $string contains a word like 'homlet' it would have matched both 'm' and 'l',
 * partially.
 *
 * Well, why stop there? We can design more sophisticated pattern to match as well.
 *
 * Let's assume that inside the [...] contains a pattern like [m | l]--an alternative
 * match choosing one or the other but not both of them.
 *
 * So what is the outcome of the expression?
 *
 * In other words, if $string contains 'homlet', will there be a matched?
 *
 * No, there will not be a matched because the pattern only goes inside the [] once
 * to choose either an 'm' or an 'l' and not both of them like the one used earlier.
 *
 * Here is what it does: after matching 'ho' it tries to choose only one character
 * from inside the []. It looks for both 'm' and 'l' but it decided to choose 'm' and
 * not 'l'. And it moves on to match outside of the [] and never come back to look
 * at 'l' again because it already looked at 'l' earlier and decided that it didn't
 * like 'l'.
 *
 * Do you see the difference between this pattern and the one used earlier?
 *
 * Okay, let's get back to the original pattern [ml] and try to finish the matching.
 *
 * Nevertheless, it is satisfied with the search at this point where 'hom' for word
 * 'home' have been matched partially! And it moves on!
 *
 * So now it is done matching inside the brackets [] where it has already matched 'hom'
 * and tries to go outside of the class definition [....... ].
 *
 * Now it tries to look for a character 'e' in the word 'home' after matching 'hom'.
 *
 * And this time, it found the character 'e' in the word 'home' after matching 'hom'
 * in the word 'home'. We found a complete matched!
 *
 * Now since it found a complete matching word in 'home', preg_match(), then, puts
 * 'home' in an array variable $match[1].
 *
 * Now that it is done with the word 'home', it starts all over again to find 'ho' in
 * other upcoming strings or document.
 *
 * Remember that all words/characters in the document must be searched and tried
 * to match.
 *
 * So next, it goes to the next word in sequence, which is the word 'which' and it
 * couldn't find the characters 'ho' (for 'hole') there, either.
 *
 * Remember that the expression wants any document that starts with 'ho', followed
 * by either an 'm' or an 'l' or both if there are both characters in the $string that
 * has an 'm' followed by an 'l', and then followed by an 'e'. That's what it wants!
 *
 * Is there any word in the document that fits such criterio? Yes, there is: 'hole'.
 *
 * We'll have to just continue looking for it until we find it.
 *
 * Next, it goes to the next word in sequence until it find the characters
 * 'ho' for 'hole'. I won't run down the steps to complete the next search and match.
 *
 * And it does the same sequence for 'hole' as it does when it tries to match
 * the word 'home'. Self-explanatory! I'll leave the rest for you to complete!
 *
 * After that, when it found a complete matching word 'hole', preg_match() puts
 * 'hole' in an array variable $match[2].
 *
 * preg_match() also puts all of the matching words in sequence ('home hole') in an array
 * variable $match[0].
 *
 * array: element 0 for the entire match (i.e., 'home hole'), element 1 for the first
 * complete match string/word (i.e., 'home'), element 2 for the second complete match
 * string/word (i.e., 'hole'), element 3 for the third complete match string/word,
 * and so on and so forth.
 */

if (preg_match($expression, $string, $match))
   {
    // $match[1] = 'home' and match[2] = 'hole'
    echo "Match found: " . $match; // $match[0] = 'home hole'
   }
else
   {
    echo "Match not found.";
   }
?>
As often the case, the more examples there are the better off we are in understanding things. For that reason, let's see some more examples using PHP's preg_match() function to get a better feeling. This time, we'll use bracket characters ().
<?php
$string = 'Any of this individual example is of a correct pattern delimiter';

/**
 * you can replace /....../ with the bracket characters () as well, for example:
 */

$regex = '(this [is] a (pattern))';    // it will try to match: this is a pattern

/**
 * As you can see, the expression starts out with a string/word character 'this'
 * and it tries to match any word/string in the variable $string:
 *
 *            'Any of this individual example is of a correct pattern delimiter'
 *
 * First, it looks in the first word 'Any' and it couldn't find the word 'this'.
 *
 * Next, it goes to the next word which is 'of' and again it couldn't find the word
 * 'this' there, either.
 *
 * Next, it goes to the next word/string which is 'this' and this time it found
 * the word/string 'this'.
 *
 * Now since it found a complete matching word/string 'this', preg_match(), then, puts
 * 'this' in an array variable $match[1].
 *
 * Now since it found a complete matching string in 'this' it is done with that expression.
 *
 * Next, it goes to the next expression in sequence which is inside the [].
 *
 * Inside the [] contains the string 'is' which the expression tries to look for in $string.
 * Since it is a new sequence, it must starts matching from the beginning of the $string.
 *
 * Knowing that, it goes to the first word in sequence which is 'Any' and again it couldn't
 * find the word 'is'.
 *
 * Next, it tries to find the word 'is' in the next word in $string which is 'of' and it
 * couldn't find the word 'is' there, either.
 *
 * Next, it goes to the word in sequence which is 'this' and again it couldn't
 * find the word 'is' there, either.
 * Notice that even though the word 'this' matched the word 'is' partially, but it has to
 * be the whole word by itself and not part of the word like th~is~. So it's not a matched!
 *
 * Next, it continues to find the word 'is' in sequence which is 'individual' and again it
 * couldn't find the word 'is' there, either.
 *
 * Next, it continues to find the word 'is' in sequence which is 'example' and again it
 * couldn't find the word 'is' there, either.
 *
 * Next, it continues to find the word 'is' in sequence which is 'is' and this time,
 * it found the word 'is' there, and preg_match(), then, puts 'is' in an array
 * variable $match[2].
 *
 * Now since it found a complete matching string in 'is' it is done with this expression.
 *
 * Next, it goes to the next expression in sequence which is outside the [].
 *
 * Outnside the [] contains the next string 'a' which the expression tries to look for in
 * $string.
 *
 * Now since it is a new sequence, it must starts matching from the beginning of the $string.
 *
 * Knowing that, it goes to the first word in sequence which is 'Any' and again it couldn't
 * find the string 'a' there, either.
 *
 * Next, it tries to find the string 'a' in the remaining upcoming word/string in $string
 * until it finds the string 'a' or the end of $string.
 *
 * Eventually, it will find the string 'a' and preg_match(), then, puts 'a' in an array
 * variable $match[3].
 *
 * Next, it continues to find the word/string in sequence until the expression is
 * completely exhausted and done!
 *
 * Eventually, it will find the string 'pattern' and preg_match(), then, puts 'pattern' in
 * an array variable $match[4].
 *
 * Now since the expression is completely exhausted and done, preg_match(), then, puts
 * all of the matched strings in sequence in array variable (element 0): $match[0].
 *
 * array: element 0 for the entire match (i.e., 'this is a pattern'), element 1 for the
 * first complete match string/word (i.e., 'this'), element 2 for the second complete
 * match string/word (i.e., 'is'), element 3 for the third complete match string/word
 * (i.e., 'a'), element 4 for the fourth complete match string/word (i.e., 'pattern'),
 * and so on and so forth.
 */

if (preg_match($regex, $string, $match))
   {
    // $match[1] = 'this', match[2] = 'is', match[3] = 'a', match[4] = 'pattern'
    echo "Match found: " . $match; // $match[0] = 'this is a pattern'
   }
else
   {
    echo "Match not found.";
   }
?>
Let's see some more examples using PHP's preg_match() function to get even a better feeling.
<?php
$expression = "/\b(\d+)\s*(\w+)$/";
$string = 'Give me 100 dollars';

/**
 * Regular expression has two parts: the expression itself, which contains in
 * variable $expression, and the strings or text or document or file content that
 * you want to search and match. In this case, that document or string is contained
 * in variable $string.
 *
 * Knowing that, we can just go ahead and try to search and match the expression.
 *
 * As you can see, the expression starts out with a word boundary character \b
 * to match any word in the variable $string: 'Give me 100 dollars'
 *
 * Now inside the () contains \d (which is any digit) and + (which is one or more).
 * Together, they mean match any digit with one or more of the digits.
 *
 * First, it looks in the first word 'Give' and it couldn't find one or more digits in
 * the word 'Give'.
 *
 * Next, it goes to the next word which is 'me' and again it couldn't find one or more
 * digits there, either.
 *
 * Next, it goes to the next word/string which is '100' and this time it found one or
 * more digits in the word/string '100'.
 *
 * Now since it found a complete matching word/string in '100', preg_match(), then, puts
 * '100' in an array variable $match[1].
 *
 * Now since it found a complete matching string in '100' it is done with the boundary
 * word matching and it needs to move on to the next expression in sequence which is \s*.
 * '\s' matches any whitespace character (space, tab, newline or carriage return character).
 * Same as [\t\n\r]. * signifies as zero or more (or in this case, zero or more spaces).
 *
 * So after '100' it found a space and it is a matched! It is satisfied and moves on!
 *
 * Next, it goes to the next expression in sequence which is inside the ().
 *
 * Inside the () contains \w (which is any word) and + (which is one or more).
 * Together, they mean match any word with one or more of the words.
 *
 * Knowing that, it goes to the next word in sequence which is 'dollars' and again it
 * found one word in 'dollars'. It is satisfied with the matched and moves on to $ which
 * signifies as the ending of any word, 'dollars' in this case. It is done matching!
 *
 * Now since it found a complete matching word in 'dollars', preg_match(), then, puts
 * 'dollars' in an array variable $match[2].
 *
 * preg_match() also puts all of the matching words in sequence ('100 dollars') in an array
 * variable $match[0].
 */

if (preg_match($expression, $string, $match))
   {
    echo "1st match found: " . $match[1] . "<br />"; // $match[1] = '100'
    echo "2nd match found: " . $match[2] . "<br />"; // $match[2] = 'dollars'

    echo "The whole match found: " . $match[0] . "<br />"; // $match[0] = '100 dollars'
   }
else
   {
    echo "Match not found.";
   }
?>
You can use these examples as the basic starting point for your own expression design to match sophisticated expression patterns for your own projects. Just play around with it using different character tokens and mixing them up with other character tokens to be discussed later like the predefined character classes, repetition quantifiers, pattern modifiers, position meta characters, and word boundaries.
Meta Characters inside Class Definition
<?php
/**
 * meta characters like '^' and hyphen '-' can be inside the brackets [.......] as well.
 *
 * the ^ inside the [.......] is used to negate the expression.
 * for example, to match any character in the expression except those contained
 * within the brackets [.......], you use the meta character ^ after the opening bracket [.
 * for example, the following matches any character except 'x', 'y', or 'z'.
 */

$regex = '/[^xyz]/';

/**
 * notice that when used outside of the brackets [....], '^' still signifies as the
 * start of the word or strings.
 */

 * inside the brackets [.......] meta character hyphen '-' is used to define
 * character range, like [0-9] or [a-z] or [A-Z].
 *
 * for examples:
 */

// it matches any digit between 0 and 9, inclusive

$regex = '/[0-9]/';

// it matches any letter between a and z, inclusive

$regex = '/[a-z]/';

// it matches any letter between k and s, inclusive

$regex = '/[k-s]/';

/**
 * it matches any digit between 0 and 9, inclusive, or also,
 * it matches any upper case letter or lower case letter between
 * a or A (both inclusive) and z or Z (both inclusive), respectively.
 */

$regex = '/[0-9a-zA-Z]/';

/**
 * next up is '|' to signify the alternate of the character definition.
 * it is a multiple choice route to go, e.g.:
 * Foo | Bar | Caz | Daz with four choices to match only one: Foo or Bar or Caz or Daz
 */

$regex = '/Foo | Bar/'  /** so if it finds Foo or Bar, it's a matched! **/

 // likewise,

$regex = '/a | b/'  /** so if it finds an 'a' or a 'b', it's a matched! **/

/**
 * note that meta characters like '^', '$', '|', or any other meta characters for that
 * matter, can be used inside or outside of the character class definition [....... ].
 */
?>
Meta Characters Summary
Note that forward slash / is not a special regular expression character.
<?php
/** A summary of meta characters class definition: **/

// to find and match any one of the characters a, b, or c.

$regex = '/[abc]/';

// to find and match any one character other than a, b, or c.

$regex = '/[^abc]/';

// to find and match any one character from lowercase a to lowercase z.

$regex = '/[a-z]/';

// to find and match any one character from uppercase A to uppercase Z.

$regex = '/[A-Z]/';

// to find and match any one character from lowercase a to uppercase Z.

$regex = '/[a-Z]/';

// to find and match a single digit between 0 and 9.

$regex = '/[0-9]/';

// to find and match a single character between a and z or between 0 and 9.

$regex = '/[a-z0-9]/';
?>
Predefined Character Classes
Some character classes such as digits, letters, and whitespaces are used so frequently that there are shortcut names for them. The following table lists those predefined character classes:
| Shortcut | Description |
. |
That is a period '.' It matches any single character except newline \n. The period '.' has a special meaning within a regular expression in that it represents any character -- it's a wildcard. To represent and match a literal '.' it needs to be escaped which is done via the backslash \, i.e., \.
The ' /p /^ /<b>( |
\d |
Matches any digit character. Same as For instance, you can search for large sum of money using the ' |
\D |
Matches any non-digit character. Same as [^0-9] |
\s |
Matches any whitespace character (space, tab, newline or carriage return character). Same as [ \t\n\r] |
\S |
Matches any non-whitespace character. Same as [^ \t\n\r] |
\w |
Matches any word character (definned as a to z, A to Z,0 to 9, and the underscore). Same as [a-zA-Z_0-9] |
\W |
Matches any non-word character. Same as [^a-zA-Z_0-9] |
The Dot '.' Matches (Almost) Any Character
In regular expressions, the dot '.' or period is one of the most commonly used meta characters. Unfortunately, it is also the most commonly misused and misunderstood meta character.
So what exactly is a dot '.' meta character or how do we suppose to use it correctly?
First of all, the dot '.' matches a single character, without caring what that character is. For example, the expression \d{1,} tells us to match any single character and it doesn't matter what that character is except line break characters. As long as the individual character being match is not some form of line break characters, it is fine.
So the expression above could be any digit (i.e., $12345.00) depending what the strings to be matched is. Notice the use of the dot '.' literal character. See examples later to get a better view of it.
Secondly, as noted above, the dot '.' does not match line breaks by default. This exception exists mostly because of historic reasons. The first tools (in the old days) that used regular expressions were line-based. They would read a file line by line, and apply the regular expression separately to each line.
The effect is that with these (old) tools, the string could never contain line breaks, so the dot '.' could never match them. It makes a lot of sense to not trying to match line breaks because it is very difficult to visualize exactly where the line breaks are, even with trained eyes, you couldn't possibly spot line breaks in today's text.
Repetition Quantifiers
In the previous section we've learnt how to match a single character in a variety of fashions. But what if you want to match on more than one character? For example, let's say you want to find out words containing one or more instances of the letter p, or words containing at least two p's, and so on.
This is where quantifiers come into play. With quantifiers you can specify how many times a character in a regular expression should match.
The following table lists the various ways to quantify a particular pattern:
| Symbol | Description |
+ |
Matches one or more. E.g., p+ matches one or more occurrences of the letter p. |
* |
Matches zero or more occurrences. E.g., p(hp) |
? |
Matches zero or one occurrence and not more. E.g., p? matches zero or one occurrences of the letter p. This is matching no more than one occurence--either matching one or none at all. |
{} |
Matches exactly the specified number of occurrences. E.g., p{3} matches exactly three occurrences of the letter p. |
{,} |
Matches at least the specified occurrences before the comma, but not more than the specified occurrences after the comma. E.g., p{3,2} matches at least three occurrences of the letter p (and it can be more), but not more than two occurrences of the letter p (specified after the comma). |
{2,} |
Matches two or more occurrences (or at least two) occurrences. The un-specified number after the comma tells it that it is open to as much as it can be. |
{,3} |
Matches at most the specified number of occurrences after the comma, but not more than the specified occurrences specified after the comma. E.g., p{,3} matches at most three occurrences of the letter p and not more than three occurrences of the letter p (specified after the comma). |
^ |
'^' is a meta character to signify as the starting point of a line, word, or string that the regular expression needs to match. For example, ^p matches any string with p at the beginning of it. All these words will result in a match: people, pop, preference, procedure. |
$ |
'$' is a meta character to signify as the ending point of a line, word, or string that the regular expression needs to match. For example, p$ matches any string with p at the end of it. All these words will result in a match: group, pop, up, gossip. |
[[:alpha:]] |
It matches any string containing alphabetic characters aA through zZ. |
[[:digit:]] |
It matches any string containing numerical digits 0 through 9. |
[[:alnum:]] |
It matches any string containing alphanumeric characters aA through zZ and 0 through 9. |
[[:space:]] |
It matches any string containing a space. |
Pattern Modifiers
A pattern modifier allows you to control the way a pattern match is handled. Pattern Modifiers can be used either inline or as flags. For example, to search and match case-insensitive expression, you can use the "i" modifier in two ways:
- As a
flagat the end of the pattern: /Color/i. This will match the string 'color'. Inlineat the start of the pattern: /(?i)Color/. Likewise, this will match the string 'color'.
Inline modifier syntax, you can turn off part of the string (for instance, (?-i) turns off the case-insensitive modifier).
The following table lists some of the most commonly used pattern modifiers.
| Symbol | Description |
| /regex/ | My convention: Note that 'regex' is my placeholder used for the actual regular expression. For example, /color/i is in 'regex'. | i |
Makes the match case-insensitive manner. For example, $expression = "/color/i" will match the word color or Color or cOlor or coLoR. |
m |
If you have a string (or document that you want to search and match) consisting of multiple lines, like You can use
The "start of line" metacharacter ( If there are no "\n" characters in a string document, or no occurrences of |
g |
Perform a global match, i.e., finds all occurrences. |
o |
Evaluates the expression only once. |
s |
\s matches a space, a tab, a carriage return, a line feed, or a form feed. It matches any whitespace character (space, tab, newline or carriage return character). Same as [ \t\n\r] |
x |
When using In other words, The
$expression = "/   # this is a comment inside the expression
                (?x)regex # this is the regular expression pattern
                   # make note of the 'x' modifier!
               /imx";
The pattern $expression = "/(?x)regex/" will make the remainder of the 'regex' free of whitespaces like spaces, tabs, and line breaks. In other words, any whitespace contains in 'regex' will be ignored and not trying to match. For example, x modifier nullify this behavior. |
Comments
You can embedd comments inside regular expression using an unescaped # character outside a character class. The comments can continue up to the next newline character in the pattern. In other words, comments are line-basis similar to php's comment directive '//' where a comment can stretch only in a line. To use multi-line comments similar to PHP's /** .... */ use '(?#' which marks the start of a comment which continues multiple lines up to the next closing parenthesis. Nested parentheses are not permitted. For example:
<?php
$string = 'test';

/**
 * this is a multi-line comment inside a regular expression pattern
 */

$expression = '/te(?# this is inside a multi-line comment)st/';

echo preg_match($expression, $string) . "\n";

// this is a single-line comment that stretches over to two lines!

$expression = '/te#~~~~
st/';

// this is illegal! cannot stretch more than one line!
echo preg_match($expression, $string) . "\n";

/** this is a single-line comment that stretches over to two lines!
 * however, there is an x modifier which allows us to put our regex on
 * several lines.
 */

$expression = '/te#~~~~
st/x';

// this is legal! make note of the 'x' modifier in the expression above!
echo preg_match($expression, $string) . "\n";

// result
// 1
// 0
// 1
Now let's see some more examples and this time using PHP's preg_match_all() function.
preg_match_all('document', 'expression') searches 'document' for all matches to the regular expression given in 'expression' and puts them in matches in order of the match. For example, $document = 'this is a string' and assuming the whole string in $document is matched, preg_match_all() puts match[0] = 'this is a string' with the first matched string being 'this', the second being 'is', the third being 'a', and the last being 'string'.
If there are more matching strings in the $document, it will continues to put them in the order until it is exausted with the matching.
In other words, after the first match is found in the $document, the subsequent searches are continued on from the end of the last match, while at the same time, putting them in the order until it is exausted with the matching.
The following example will show you how to perform a global case-insensitive search using the i modifier and the PHP preg_match_all() function.
<?php
/**
 * here, it disregards any uppercase letter and treats them as lowercase letter
 * so it found two matches: one with an uppercase letter 'Color' and another
 * with a lowercase letter 'color'.
 */

$expression = "/color/i";
$text = "Color red is more visible than color blue in daylight.";

$match = preg_match_all($expression, $text, $array);

echo $match . " matches were found."; // 2 matches were found.
?>
Now let's see some more examples using PHP's preg_match_all() function.
<?php
/**

$expression = "/\d+(,\d+)*/";
$list = "1,2,3,4";

$match = preg_match_all($expression, $list, $match);

print_r($match);

/**
Output:

Array
    (
     [0] => Array(
                  [0] => 1,2,3,4
                 )

     [1] => Array(
                  [0] => ,4
                 )

    )
Now let's see some more examples using PHP's preg_match_all() function. The the following example shows how to match at the beginning of every line in a multi-line string using meta character ^ and character modifier m with PHP preg_match_all() function.
<?php
/**
 * here, we know that '^' matches at the beginning of the line of the string,
 * for example, ^p matches: people, Peterson, pepper, pop, but not epsilon nor setup.
 * however, if 'i' was not included here, Peterson would not have been matched.
 * or in the case below, the uppercase 'Color' would not have been matched.
 *
 * as you can see, the new line command: \n cuts the line into two with a
 * new line starting with a lowercase letter 'c' in 'color'.
 * had that new line command is not there, there would be only one matched.
 */

$expression = "/^color/im";
$text = "Color red is more visible than \ncolor blue in daylight".;

$match = preg_match_all($expression, $text, $array);

echo $match . " matches were found."; // 2 matches were found.
?>
Now let's see some more examples using PHP's preg_match() function.
<?php
/**
 * here, we start with a dot '.' enclosed inside the parenthesese to match any single
 * character except line breaks. this can be any character and in conjunction with ()
 * to group the matched characters activated by the + we can match a lot of characters
 * in a long line. for example, 'Joe the six pack has gone home!'
 *
 * next, we have an expression: \. to tell us that we want the literal '.'.
 *
 * next, we have an expression: [php] to tell us that we want to match a 'p',
 * an 'h', or a 'p' to form it as 'php'.
 *
 * as you might have guessed, the expression could turn out to be like this:
 *
 *  'Joe the six pack has gone home!.php'
 *
 * which is a weird php file name. hey, this is not about trying to match a
 * php file name. it is about learning how to use dot '.' correctly.
 */

$expression = "/(.)+\.[php]/";


/**  alright, let's see some more examples using dot '.'  **/

/[0-9]\.[ab]/    <--- this will match a digit, a period, and "a", or "b", or "ab",
                      but not "ba"

/[0-9].[ab]/     <--- this will match a digit, any single character, and
                      "a", or "b", or "ab", but not "ba". I.e., '8Ka' or '8Kb' or '8Kab'

/[^\.])\.[^\.]/  <--- matches any single character and a '.' between them

/**
 * notice the '^' negation meta character to negate the '\.' which
 * means '\.' turns into '.' and as such, it matches any single character.
 * so it matches any single character, followed by a '.', followed by any
 * single character. Example: 'J.k'
 */

/**
 * backslash is typically being used to escape characters. for example,
 * to match the regular expression tokens: . * ? + [ ] ( ) { } ^ $ | \
 * you will need to backslash (or escape) them whenever you want to use them literally.
 *
 * For example, if you want to match ".", you'd have to write \.;
 * if you want to match "\", you'd have to write \\; if you want to match "^",
 * you'd have to write \^;
 * if you want to match "$", you'd have to write \$, and so on and so forth.
 *
 * We know that to use "\"  literally, we have to escape it like this \\.
 *
 * What about double slashes?
 *
 * Well, if we escape the single slash like this \\, then to escape the double slashes,
 * we can just repeat the single slash escaped mode with one more time to make it a
 * double slashed escape mode.
 *
 * Simple enough?
 *
 * In other words, if we want to match "\\", we have to write \\\\.
 *
 * Right here where it gets a little confusing using single and double quotes on
 * single and double slashes!
 *
 * Single and double quoted PHP strings have special meaning on single backslash
 * and double backslashes.
 *
 * PHP uses backslash as an escape character in double-quoted string, too.
 *
 * Thus if \ has to be matched with a regular expression \\, then "\\\\" or
 *  '\\\\' must be used in in your regex code.
 *
 * In other words, to match \\ inside either single or double quotes, '\\\\' must
 * be used in your regex code.
 *
 * In these cases you'll need to double the escape:
 */

$single = '\.';    // here, $single = '.'   <--- notice the same as double quotes!
$double = "\\.";   // here, $double = '.'   <--- notice the same as single quote!

So this:  "/\$\d{1,}./"   i.e., $9001234050  <--- notice that no dot '.' at the end!

how about this: '/\$\d{1,}\./'  i.e., $9001234050.  <--- notice the dot '.' at the end!

or it could be written as this as well: "/\\$\\d{1,}\\./"   i.e., $9001234050. <--- dot '.'


/**  let's see some explanations   **/


/**
 * now we know that '$' matches characters at the end of the string.
 * but in the expression below, we're escaping $ to output the actual $ and not
 * performing a meta search with $. so this is a literal $ to output $ as in $12345.00.
 * next, we have an expression: \d{1,}. with \d represents any digits and {1,} tells
 * us to match at least one or more digits. it can be a lot of digits but it has to be
 * at least one digit.
 * now the period '.' tells us to match any single character except newline \n.
 * so now the result could be something like this: $12345
 */

$expression = "/\$\d{1,}./";

// how about this:

$expression = '/\$\d{1,}\./';


/**
 * this is the same thing as first version except the escaping of the literal period '.':
 * escaping $ to output the actual $ and not performing a meta search with $
 * next, we have an expression: \d{1,}. with \d represents any digits and {1,} tells us
 * to match at least one or more digits.
 * now the escaped period '\.' tells us to match the actual literal character '.'.
 *
 * in other words, we want to display the literal '.' "as is", i.e, $12345.00.
 * now the result could be something like this: $12345. <-- notice the dot '.' at the end.
 */

$expression = "/\\$\\d{1,}\\./";
$string = '$12345.';

/**
 * so what exactly are we trying to do, here?
 *
 * here and above, we have a variable $expression that holds an expression and we also
 * have a variable $string to match the pattern contains in $expression.
 *
 * think of it this way:
 *
 * $expression is a rule or a specification and $string is a finished product.
 *
 * now we want to match the finished product with the specification to see
 * if it meets the rule or the specification.
 *
 * that's what we're trying to do--to replace the expression pattern with the given
 * strings: '$12345.' to see if it meets the specification using preg_replace().
 */

echo preg_replace($expression, $string, $match);

/**
 * now what if we have $string containing this: $string = '$12345' ?
 *
 * will it match? Answer: no, because the specification says you have to have
 * a dot '.' at the end of the strings.
 *
 * likewise, what if we have $string containing this: $string = '12345' ?
 *
 * will it match? Answer: no, because the specification says you have to have
 * a '$' at the beginning of the strings.
 */
?>
Now let's see some more examples using both PHP's preg_replace() and str_replace() functions.
<?php
$expression = "/\s/";
$replacement = "-";

/**
 * here, using preg_replace(), every time it sees a white space or spaces,
 * a new line or lines, a tab or tabs it will replace them with hyphen '-'.
 * consider this text to use with the regular expression replace preg_replace():
 */

$text = "The night is\nstill\tyoung!";

/**
 * Replace spaces, newlines and tabs
 * this will output: The-night-is-still-young!
 */

echo preg_replace($expression, $replacement, $text);
echo "<br>";

/**
 * Replace only spaces but not line break nor tabs
 * here, using str_replace(), every time it sees a white space or spaces,
 * it will replace them with hyphen '-'.
 * this will output: The-night-is still young!
 */
echo str_replace(" ", "-", $text);
?>
Now let's see some more examples and this time using PHP's preg_split() function.
<?php
/**
 * here, every time it sees a whitespace, comma, sequence of commas, or combination thereof,
 * it will split the string at those points using the PHP preg_split() function.
 * notice the use of the '+' to match one or more occurrences of a whitespace, comma,
 * sequence of commas, or combination thereof.
 */

$expression = "/[\s,]+/";
$text = "My favorite colors are red, green and blue";

$part = preg_split($expression, $text);

/**
 * now $part[0] = 'My', $part[1] = 'favorite', $part[2] = 'colors', $part[3] = 'are',
 *     $part[4] = 'red', $part[5] = 'green', $part[0] = 'blue'
 */

// Loop through part array and display substrings
foreach ($part as $piece)
      {
       echo $piece . ", "; // output: My, favorite, colors, are, red, green, blue
      }
?>
Positions
There are certain situations where you want to match at the beginning or end of a line, word, or string. To do this you can use meta characters. Two common meta characters are caret '^' which represent the start of the string, and the dollar '$' sign which represent the end of the string.
Now let's see some more examples and this time using PHP's preg_grep() function.
<?php
/**
 * here, it looks for strings that start with the letter 'F' using meta character '^'
 *
 * that is it! very simple!
 */

$expression = "/^F/";

$string = ["Quarterback", "Clark Kent", "Fred Kruger", "James Bond", "Flow Chart",
           "Fire Truck"];

$match = preg_grep($expression, $string);

// Loop through an array of strings and display matched strings
foreach ($match as $value)
      {
       echo $value . ", "; // output: Fred Kruger, Flow Chart, Fire Truck,
      }

/**
 * here, it looks for strings that end with the letter 'k' using meta character '$'
 *
 * that is it! very simple!
 */

$expression = "/k$/";

$string = ["Quarterback", "Clark Kent", "Fred Kruger", "James Bond", "Flow Chart",
           "Fire Truck"];

$match = preg_grep($expression, $string);

// Loop through an array of strings and display matched strings
foreach ($match as $value)
      {
       echo $value . ", "; // output: Quarterback, Fire Truck,
      }
?>
Word Boundaries
Remember that regular expression contains only these character tokens:
. * ? + [ ] ( ) { } ^ $ | \
But to match partial words, we need a way to specify boundaries where words are located. Hence, word boundaries are 'words' like cart, carrot, cartoon, etc. -- words that have multiple sylables.
But to match partial words, we have to put words in the regular expression that contains other characters used by the character tokens. In other words, how do we differentiate between the boundary words and the characters that the character tokens are performing on?
For example, consider this:
/[abcar](bcar)/
On the left is an ordinary pattern matched by the character tokens and on the right is supposed to be a boundary word to be matched.
So, how do we differentiate between the characters [on the left] that the character tokens are performing on and the boundary word on the righ? How do we differentiate them? We can't! It's all a mess!
This is where boundary characters come in. So we need boundary characters like \b, \w and as well as literal tokes \d, \o, \x, etc. Now, how do we differentiate them? You guessed it: \ to escape the b. Now we can put \b and \w in the mixed with the rest of the character tokens and they all are working side-by-side in harmony.
A word boundary character '\b' helps you search for the words that begins and/or ends with a pattern. For example, the regexp /\bcar/ matches the words beginning with the pattern car (with 'b' signifies as the 'beginning'), and would match cart, carrot, or cartoon, but would not match oscar.
Similarly, the regexp /car\b/ matches the words ending with the pattern car, and would match scar, oscar, or supercar, but would not match cart.
Likewise, the /\bcar\b/ matches the words beginning and ending with the pattern car, and would match only the word car.
The following example will highlight the words beginning with car in bold:
<?php
/**
* $expression = '/\bcar\w*/';
*
* here, our goal is to match any words beginning with the pattern car (with 'b'
* signifies as the 'beginning').
*
* the expression uses '\' to escape the literal 'b' so that it won't treat 'b'
* as an ordinary character to be matched by the character tokens.
*
* now 'b' becomes a live function to search for words that begin with 'car'.
*
* likewise, we're escaping the 'w' as well so that we can match any word character
* (definned as a to z, A to Z, 0 to 9, and the underscore). Same as [a-zA-Z_0-9].
*
* the 'w' stands for 'words' character as in car, cart, carrot, web, newspaper, etc.
*
* now the '*' is used to match zero or more occurrences of words like:
* car, cart, carrot, web, newspaper, etc.
*
* anytime there is a matched, i.e., 'car', preg_replace() performs a replace of the
* content (car) only after it has been matched using characters contained in
* variable $replacement.
*
* now the characters in $replacement has another special meaning as well.
* it's a buit-in function! see the description below for more.
*
* basically, '$0' acts as a placeholder to hold the matched word.
* so whenever there is a matched, it puts the matched word in $0.
* and then that $0 is replacing the original word in the document making the
* original word(s) bold.
*/
$expression = '/\bcar\w*/';
// '$0' will be replaced by the $string captured by $expression: car, cart, cartoon, etc.
$replacement = '$0';
$string = 'Words begining with car: cart, carrot, cartoon.
Words ending with car: scar, oscar, supercar.';
// preg_replace() performs a replace of the content only after it has been matched
echo preg_replace($expression, $replacement, $string);
/**
* as you can see, there is two parts in this: first, it does the regular expression
* search and match, and second, it uses preg_replace() to just replace the entire old
* strings contain in $expression and replace it with the newly decorated strings in
* $replacement and puts the entirely strings including the newly decorated strings
* back in variable $string ready to be used/displayed.
* preg_replace() just performs a replace of the content only--and no search and match.
*
* output:
* Words begining with car: cart, carrot, cartoon.
* Words ending with car: scar, oscar, supercar.
*/
?>
Replacement may contain references of the form \\n or $n
Notice that variable $replacement may contain references of the form \\n or $n, with the latter form being the preferred one [see $replacement = '$0' above]. Every such reference will be replaced by the text captured by the n'th parenthesized pattern ($expression, in this case). n can be from 0 to 99, and \\0 or $0 refers to the text matched by the whole pattern.
Now a side note: what does it mean: n'th parenthesized pattern?
Well, regular expressions can be very complex and to match all kinds of scenarios some regular expressions need to use parenthesese to group all their many possible expression options. For more check this out parenthesized pattern or this parenthesized pattern.
Opening parentheses are counted from left to right (starting from 1) to obtain the number of the capturing subpattern. To use backslash in $replacement, it must be doubled ("\\\\" PHP string).
When working with a replacement pattern where a backreference is immediately followed by another number (i.e.: placing a literal number immediately after a matched pattern), you cannot use the familiar \\1 notation for your backreference.
\\11, for example, would confuse preg_replace() since it does not know whether you want the \\1 backreference followed by a literal 1, or the \\11 backreference followed by nothing.
In this case the solution is to use ${1}1. This creates an isolated $1 backreference, leaving the 1 as a literal.
Complex (curly) {} Syntax
This isn't called complex because the syntax is complex, but because it allows for the use of complex expressions.
Any scalar variable, array element or object property with a string representation can be included via this syntax. In other words, you can include almost just about anything inside the curely brackets {}. Simply write the expression the same way as it would appear outside the string, and then wrap it in { and }.
Since { cannot be escaped, this syntax will only be recognized when the $ immediately follows the {.
For example, use {\$ to get a literal {$. Notice the curly bracket { and the $ in combination.
Some examples to make it clear:
<?php
// Show all errors
error_reporting(E_ALL);
$great = 'fantastic';
// Won't work, outputs: This is { fantastic}
echo "This is { $great}"; // notice the space gap after {
// Works, outputs: This is fantastic
echo "This is {$great}";
// Works
echo "This square is {$square->width}00 centimeters broad.";
// Works, quoted array keys 'key' only work using the curly brace syntax
echo "This works: {$arr['key']}";
// Works
echo "This works: {$arr[4][3]}";
/**
* This is wrong for the same reason as $foo[bar] is wrong outside a string.
* In other words, it will still work, but only because PHP first looks for a
* constant named foo; an error of level E_NOTICE (undefined constant) will be
* thrown.
*/
echo "This is wrong: {$arr[foo][3]}";
/**
* Works. When using multi-dimensional arrays, always use braces around arrays
* when inside of strings
*/
echo "This works: {$arr['foo'][3]}";
// Works.
echo "This works: " . $arr['foo'][3];
echo "This works too: {$obj->values[3]->name}";
// if $name = 'John Doe' then {${$name}}: 'John Doe'
echo "This is the value of the var named $name: {${$name}}"; // $name: John Doe
// if getName() = 'Jane Doe' then {${getName()}}: 'Jane Doe'
echo "This is the value of the var named by the return value of
getName(): {${getName()}}";
// if $object->getName() = 'Joe Sixpack' then {${$object->getName()}}: 'Joe Sixpack'
echo "This is the value of the var named by the return value of
\$object->getName(): {${$object->getName()}}";
/**
* Won't work, outputs: This is the return value of getName(): {getName()}
* getName() needs an object reference, i.e., $this->getName()
*/
echo "This is the return value of getName(): {getName()}";
?>
It is also possible to access class properties using variables within strings using this curely brackets {} syntax.
<?php
class foo
{
public $bar = 'I am bar.';
}
$foo = new foo();
$bar = 'bar';
$baz = array('foo', 'bar', 'baz', 'quux');
/**
* output: 'I am bar.'
* notice that it's not $foo->bar, but rather, first $foo->$bar, and then $foo->bar
*/
echo "{$foo->$bar}\n";
/**
* first, it executes the inner most code: $baz[1] = 'bar'
* then, it executes the class foo object property: $foo->bar = 'I am bar.'
*/
echo "{$foo->{$baz[1]}}\n";
?>
The above example will output:
I am bar.
I am bar.
Note:
Functions, method calls, static class variables, and class constants inside {$} work since PHP 5. However, the value accessed will be interpreted as the name of a variable in the scope in which the string is defined. Using single (pair) curly braces {} will not work for accessing the return values of functions or methods or the values of class constants or static class variables.
<?php
// Show all errors.
error_reporting(E_ALL);
class beers
{
const softdrink = 'rootbeer';
public static $ale = 'ipa';
}
$rootbeer = 'A & W';
$ipa = 'Alexander Keith\'s';
// This works; outputs: I'd like an A & W. Notice the use of two pairs of {}
echo "I'd like an {${beers::softdrink}}\n";
// This works too; outputs: I'd like an Alexander Keith's. Uses two pairs of {}
echo "I'd like an {${beers::$ale}}\n";
?>
String access and modification by character
Characters within strings may be accessed and modified by specifying the zero-based offset of the desired character after the string using square array brackets, as in $str[42]. Think of a string as an array of characters for this purpose. The functions substr() and substr_replace() can be used when you want to extract or replace more than 1 character.
Note: As of PHP 7.1.0, negative string offsets are also supported. These specify the offset from the end of the string. Formerly, negative offsets emitted E_NOTICE for reading (yielding an empty string) and E_WARNING for writing (leaving the string untouched).
Note: Strings may also be accessed using braces, as in $str{42}, for the same purpose.
Warning
Writing to an out of range offset pads the string with spaces. Non-integer types are converted to integer. Illegal offset type emits E_WARNING. Only the first character of an assigned string is used. As of PHP 7.1.0, assigning an empty string throws a fatal error. Formerly, it assigned a NULL byte.
Warning
Internally, PHP strings are byte arrays. As a result, accessing or modifying a string using array brackets is not multi-byte safe, and should only be done with strings that are in a single-byte encoding such as ISO-8859-1. Note: As of PHP 7.1.0, applying the empty index operator on an empty string throws a fatal error. Formerly, the empty string was silently converted to an array.
Some string examples:
<?php
// Get the first character of a string
$str = 'This is a test.';
$first = $str[0];
// Get the third character of a string
$third = $str[2];
// Get the last character of a string.
$str = 'This is still a test.';
$last = $str[strlen($str)-1];
// Modify the last character of a string
$str = 'Look at the sea';
$str[strlen($str)-1] = 'e';
?>
String offsets have to either be integers or integer-like strings, otherwise a warning will be thrown. Previously an offset like "foo" was silently cast to 0.
Differences between PHP 5.3 and PHP 5.4
<?php
$str = 'abc';
var_dump($str['1']);
var_dump(isset($str['1']));
var_dump($str['1.0']);
var_dump(isset($str['1.0']));
var_dump($str['x']);
var_dump(isset($str['x']));
var_dump($str['1x']);
var_dump(isset($str['1x']));
?>
Output of the above example in PHP 5.3:
<?php
string(1) "b"
bool(true)
string(1) "b"
bool(true)
string(1) "a"
bool(true)
string(1) "b"
bool(true)
Output of the above example in PHP 5.4:
string(1) "b"
bool(true)
Warning: Illegal string offset '1.0' in /tmp/t.php on line 7
string(1) "b"
bool(false)
Warning: Illegal string offset 'x' in /tmp/t.php on line 9
string(1) "a"
bool(false)
string(1) "b"
bool(false)
?>
Note:
Accessing variables of other types (not including arrays or objects implementing the appropriate interfaces) using {} or {} silently returns NULL.
A Programmers' Handy JavaScript Regex Cheat Sheet
Defining a Regular Expression in JavaScriptThere are two ways of defining a regular expression in JavaScript.
* let rgx = /^(\d+)/
You can use a regular expression literal and enclose the pattern between slashes. This is evaluated
at compile time and provides better performance if the regular expression stays constant.
* let rgx = new RegExp('^(\d+)')
The constructor function is useful when the regular expression may change programmatically.
These are compiled during runtime.
Matching a Specific Set of Characters
The following sequences can be used to match a specific set of characters. Notice that in regular expression all key characters are treated as case-sensitive, for example, a w (lower-cased) is different than a W (upper-cased).
* \w -- Matches all the words characters. Word characters are alphanumeric (a-z, A-Z characters, and underscore).
* \W -- Matches non-word characters. Everything except alphanumeric characters and underscore.
* \d -- Matches digit characters. Any digit from 0 to 9.
* \D -- Matches non-digit characters. Everything except 0 to 9.
* \s -- Matches whitespace characters. This includes spaces, tabs, and line breaks.
* \S -- Matches all other characters except whitespace.
* . -- (a period) Matches any character except line breaks.
* [A-Z] -- Matches characters in a range. For example, [A-E] will match A, B, C, D, and E.
* [ABC] -- Matches a character in the given set. For example, [AMT] will only match A, M, and T.
* [^ABC] -- Matches all the characters not present in the given set. For example, [^A-E] will match all other characters except A, B, C, D, and E.
Specifying the Number of Characters to Match
All the expressions above will match a single character at a time. You can add quantifiers to specify how many characters should be included in the match at once.
* + -- Matches one or more occurrences of the preceding token. For example, \w+ will return ABD12D as a single match instead of six different matches.
* * -- Matches zero or more occurrences of the preceding token. For example, b\w* matches the bold parts in b, bat, bajhdsfbfjhbe. Basically, it matches zero or more word characters after 'b'.
* {m, n} -- Matches at least m and at most n occurrences of the previous token. {m,} will match at least m occurrences, and there is no upper limit to the match. {k} will match exactly k occurrences of the preceding token.
* ? -- Matches zero or one occurrences of the preceding character. For example, this can be useful when matching two variations of spelling for the same work. For example, /behaviou?r/ will match both behavior and behaviour.
* | -- Matches the expression either before or after the pipe character. For example, /se(a|e)/ matches both see and sea.
Parenthesis-Related Regular Expressions
* (ABC) -- This will group multiple tokens together and remember the substring matched by them for later use. This is called a capturing group.
* (?:ABC) -- This will also group multiple tokens together but won't remember the match. It is a non-capturing group.
* \d+(?=ABC) -- This will match the token(s) preceding the (?=ABC) part only if it is followed by ABC. The part ABC will not be included in the match. The \d part is just an example. It could be any other regular expression string.
* \d+(?!ABC) -- This will match the token(s) preceding the (?!ABC) part only if it is not followed by ABC. The part ABC will not be included in the match. The \d part is just an example. It could be any other regular expression string.
Other Regular Expression Characters
There are also some other regular expression characters which have not been covered in previous sections:
* ^ -- Look for the regular expression at the beginning of the string or the beginning of a line if the multiline flag is enabled.
* $ -- Look for the regular expression at the end of the string or the end of a line if the multiline flag is enabled.
* \b -- Match the preceding token only if there is a word boundary.
* * \B -- Match the preceding token only if there is no word boundary.
Using Flags With Regular Expressions
Flags can be used to control how a regular expression should be interpreted. You can use flags either alone or together in any order you want. These are the five flags which are available in JavaScript.
* g -- Search the string for all matches of given expression instead of returning just the first one.
* i -- Make the search case-insensitive so that words like Apple, aPPLe and apple can all be matched at once.
* m -- This flag will make sure that the ^ and $ tokens look for a match at the beginning or end of each line instead of the whole string.
* u -- This flag will enable you to use Unicode code point escapes in your regular expression.
* y -- This will tell JavaScript to only look for a match at the current position in the target string.
You can specify flags for a regular expression in JavaScript either by adding them to the end of a regular expression literal or by passing them to the RegExp constructor. For example, /cat/i matches all occurrences of cat regardless of case, and RegExp("cat", 'i') does the same.
Useful Regular Expression Methods in JavaScript
The regular expressions that you create using the flags and character sequences we have discussed so far are meant to be used with different methods to search, replace or split a string. Here are some methods related to regular expressions.
* test() -- Check if the main string contains a substring which matches the pattern specified by the given regular expression. It returns true on successful match and false otherwise.
let textA = 'I like APPles very much';
let textB = 'I like APPles';
let regexOne = /apples$/i
// Output : false
console.log(regexOne.test(textA));
// Output : true
console.log(regexOne.test(textB));
In the above example, the regular expression is supposed to look for the word apples only at the end of the string. That's why we got false in the first case.
* search() -- Check if the main string contains a substring which matches the pattern specified by the given regular expression. It returns the index of the match on success and -1 otherwise.
let textA = 'I like APPles very much';
let regexOne = /apples/;
let regexTwo = /apples/i;
// Output : -1
console.log(textA.search(regexOne));
// Output : 7
console.log(textA.search(regexTwo));
In this case, the first regular expression returned -1 because there was no exact case-sensitive match.
* match() -- Search if the main string contains a substring which matches the pattern specified by the given regular expression. If the g flag is enabled, multiple matches will be returned as an array.
let textA = 'All I see here are apples, APPles and apPleS';
let regexOne = /apples/gi;
// Output : [ "apples", "APPles", "apPleS" ]
console.log(textA.match(regexOne));
* exec() -- Search if the main string contains a substring which matches the pattern specified by the given regular expression. The returned array will contain information about the match and capturing groups.
let textA = 'Do you like apples?';
let regexOne = /apples/;
// Output : apples
console.log(regexOne.exec(textA)[0]);
// Output : Do you like apples?
console.log(regexOne.exec(textA).input);
* replace() -- Search for a substring matching the given pattern and replace it with the provided replacement string.
let textA = 'Do you like aPPles?';
let regexOne = /apples/i
// Output : Do you like mangoes?
console.log(textA.replace(regexOne, 'mangoes'));
* split() -- This method will allow you to split the main string into substrings based on the separator specified as a regular expression.
let textA = 'This 593 string will be brok294en at places where d1gits are.';
let regexOne = /\d+/g
// Output : [ "This ", " string will be brok", "en at places where d", "gits are." ]
console.log(textA.split(regexOne))
Conclusion
Most programmers don't usually try to remember all the rules of regular expression but instead they try keep a short guide or "cheat sheet" nearby when doing programming work. Whenever you need to use a regular expression in your programming work you can just look it up. This cheat sheet is one of those handy guide that you can use as your cheat sheet for your programming needs.
What is an Immediately-Invoked Function Expression (or IIFE)?
First of all, in my honest opinion, JavaScript is the most complex language of all the languages out there. The next most complex language is Java. I'm definitely sure that a lot of programmers out there would agree with me on these two languages. However, these two languages are very powerful as well. If you're an expert on these two languages, you're among the high echelon of programmers out there -- espcially if you're a JavaScript guru.
JavaScript is a very powerful language and as such it is very complex as well. In JavaScript, you can have nested functions: functions inside another function and functions inside that function. So there are several levels of nested functions, one nested inside another, making it a spageti-type of intertwine looking code.
Then there is a concept called prototype. What is a JavaScript prototype?
A prototype in JavaScript is an object property variable or a function name object (or the other way around: object function name).
What the heck is function name object (or object function name)?
When you create a function in JavaScript, you create an object by way of the JavaScript engine, which adds a property called prototype to the function. Well, you created a function, which is an object and behind the scene a property called prototype is added to this object you'd just created -- hence the prototype object.
What is an object? To answer that, please see my other tutorial called Class verses Object.
So prototype is inherited from parent class called Object.
This prototype property is an object, which has a constructor property by default. The constructor property points back to the function you'd just created. Did you understand all that? If you don't, it's not the end of the world. Yes, this is advanced JavaScript.
Just know this: When you create a class (or object), you don't have to create properties in that class. Yes, that is right: you don't need to create all properties all at once at the time you create your class; you can create them later on using prototype property object. This feature comes in handy when you decided that you need properties or methods later on.
For example, if you create a class called Car and you forgot to create a property called color, no worries: You can actually create that property called color later outside of that class Car by referring to that class Car like this:
Car.prototype.color = 'blue';
// Now a property called color has been created somewhere
// outside of that class.
Now you can access that property called color just like any other properties as if you had declared it in the class Car in the first place.
Likewise, you create (or declare) a function name after you'd created a class Car and can be done by just specifying the prototype with a function name or more correctly function property: myMethod. For example:
Car.prototype.myMethod = function()
{
return this.color; // blue
};
A prototype in Javascript is an empty object that contains nothing in it. It is just an empty hallowed object that allows you to add properties and methods to an existing object that you already created (i.e., Car class). You can add properties and methods to the object of the class Car.
So a Javascript prototype is a special object similar to PHP's stdClass that allows you to declare variable properties and methods outside of the class definition.
In PHP, you can create an instance of an "all-purpose" class called stdClass and then declare (or add) properties and assign values to those properties.
So stdClass is an "all-purpose" class that contains nothing - no properties or methods - and when you instantiate it, it is an empty object that allows you to basically add properties (or methods, although rare) and assign values to them and use them on the spot.
This is a very convenient "all-purpose" class to use when you need an empty object to hold your properties and use them on the spot.
In PHP, you can do like this:
$customer = new \stdClass(); // notice the use of the namespace directory "\"
$customer->name = 'John Doe';
$customer->address = '123 Main St';
$customer->email = 'john@doe.com';
// now $customer is an object that contains John Doe's information
// now you can do whatever you want with this object $customer
Similarly in Javascript, you can declare properties and methods using prototype object. Suppose that you have a class definition called Customer and you forgot to declare some properties and methods, you can actually do it later using prototype object. For example:
Customer.prototype.name = 'John Doe'; // a property called 'name'
Customer.prototype.getName =
function(
{
return this.name; // 'John Doe'
});
Throw an anonymous function into the mix as well, then you have a language that is very hard to master all of its nooks and crannies.
Immediately-Invoked Function Expression is one of those nooks and crannies. I'm not sure if I understand it very well but I will try to explain it the best I possibly can.
Immediately-Invoked Function Expression (IIFE) is sometimes known as "self-executing function" or "self-executing anonymous function" or "self-invoked function" or "self-invoked anonymous function". They all mean the same thing, and they are all being used interchangibly.
So what exactly is IIFE?
As the expression implies, IIFE, is a self-invoked function -- it is automatically invoked by the browser once the browser encounters the function.
Normally, you have to call the function in order for the function to start executing. In an IIFE function, you just create the function and when the browser encounters the function, it executes the function automatically. Let's see some examples.
IIFE functions:
// there are two versions that you can use
// first version
(function() // <---- the outer "(" marked as the opening of the main function -- start of the main IIFE function
{
// notice that function() is just an ordinary javascript anonymous function that you can put your code in it
// and inside here is its body of that ordinary javascript function and not
// part of the IIFE, but it will be executed by IIFE automatically via chains of reaction
// you can put your code in here!
// more code here!
// .....
}
() // self-invoked function's opening and closing parenthesese
// and typically contains the word "jquery" inside it, i.e., (jQuery)
); // <---- marked as the closing of the main function -- end of the body of IIFE function
// any code between the opening/closing of the "main" function above will be executed by
// the self-invoked function designated by the two parenthese: () and typically contains the word "jquery" inside it
// now the second version
// this version is very popular among slider programmers, particularly jQuery sliders
(function() // <---- the outer "(" marked as the opening of the main function -- start of the IIFE function
{
// notice that function() is just an ordinary javascript anonymous function that you can put your code in it
// and inside here is its body of that ordinary javascript function and not
// part of the IIFE, but it will be executed by IIFE automatically via chains of reaction
// you can put your code in here!
// more code here!
// .....
}
) // <---- marked as the closing of the main body function -- end of the IIFE function
(); // <---- notice that the second version is outside of the main body
// <---- noitce also the ending with a ";" to end the IIFE
// any code between the opening/closing of the "main" function will be executed by
// the self-invoked function above designated by the two parenthese: ()
// and typically contains the word "jquery" inside it, i.e., (jQuery)
Question: How many of you Javascript programmers out there have seen or programmed using the above two syntaxes? If you have -- great! If not, it's not the end of the world! This is advanced Javascript programming.
That is it!
This is Immediately-Invoked Function Expression.
Now name each function version above into its own file name and navigate your broswer to the location you stored the files and you'll see some sort of results that the browser will output. Just put some content meaningful in the functions, such as an alert() or a console.log() for the browser to output some content.
As you can see, in the first version, IIFE function starts out with an opening parenthesis "(" and ends with a closing parenthesis ")"; while the second version is the same as the first version except that it pulls out the invoked-function's opening parenthesis "(" and the invoked-function's closing parenthesis ")" out of the enclosing parenthesese "()" and puts them outside of the main body at the very end of the function.
The invoked-function's opening parenthesis "(" and the invoked-function's closing parenthesis ")" invoke the function enclosed inside the outer parenthesese. In other words, "()" invokes the main function (main body) which is enclosed between the outer opening parenthesis "(" and the closing parenthesis ")".
That is all to know about Immediately-Invoked Function Expression. The rest is up to you to come up with logic inside the function to perform your objective. Here is a very brief example to help you get some ideas to get you heading in the right direction.
// it is customarily to place a semicolon ";" at the beginning of every
// self-invoked function
// this is to prevent bugs that might have been carried forward from
// other functions.
// so putting a semicolon ";" at the beginning of every self-invoked function
// delimits prior code from the previous functions that
// might have carried forward.
;(function(d)
{
var b = {
BigImagePath : "Content/mediafile/",
BigImageBorderColor : "FFF"
};
function i(j)
{
var k = "";
if (j != null)
{
// lastIndexOf returns the position of the last occurrence of a
// specified value (/) in a string (j)
if (j.lastIndexOf("/") == -1)
{
k = j
}
else
{
// + 1 to account for the starting position at 0
k = j.substring(j.lastIndexOf("/") + 1)
}
}
return k
}
a = {
start : function()
{
d(e).mousemove(function(k)
{
// some code logic
}
return d(e);
} // end start = function()
}; // end function a
/**
* remember "prototype" ?
*
* a prototype in JavaScript is an array property variable object.
* when a function is created in JavaScript, the JavaScript engine adds an array
* variable prototype property to the function.
* this array variable prototype property is an object (called prototype object)
* which has a constructor property by default.
* the constructor property points back to the function on which prototype object
* is a property.
*
* here (below), we create a function named mySlide and the JavaScript engine
* adds an array variable prototype property to this function mySlide.
* the default constructor property points back to this function mySlide.
* so in a sense, mySlide has a default constructor which is automatically called
* whenever this function is invoked or executed.
*
* to call/execute this function, do like this using jQuery statement:
* $("img.element_by_id_of_image_being_pointing_to").mySlide(setting);
* argument variable setting is passed to argument variable j
*/
d.fn.mySlide = function(j)
{
e = this;
if (a[j])
{
return a[j].apply(this, Array.prototype.slice.call(argument, 1))
}
else
{
if (typeof j === "object")
{
d.extend(b, j);
return a.start.apply(argument)
}
else
{
if (!j)
{
return a.start.apply(this, argument)
}
else
{
d.error("Method " + j + " does not exist on jQuery.mySlide")
}
}
} // end else
} // end d.fn.mySlide = function()
} // end function(d)
) // end main function()
(jQuery); // end self-invoked function()
Don't try to run this function because it is incomplete; it is an abbreviated listing of the actual functional jQuery slider that I wrote for my homemade project. This is just an illustration to help you understand the concept of Immediately-Invoked Function Expression.
What is a PHP Immediately-Invoked Function Expression (or IIFE)?
Just like an Immediately-Invoked Function Expression (or IIFE) in Javascript, a PHP Immediately-Invoked Function Expression (or IIFE) is also known as a "self-executing function" or "self-executing anonymous function" or "self-invoked function" or "self-invoked anonymous function". They all mean the same thing, and they are all being used interchangibly.
As a matter of fact, the Immediately-Invoked Function Expression (or IIFE) in PHP is a copycat of the Javascript counterpart. So if you understand the Javascript Immediately-Invoked Function Expression (or IIFE), you should have no trouble understanding PHP Immediately-Invoked Function Expression (or IIFE) because it adopted the functionality of the Javascript's IIFE. IIFE is only available in PHP version 7 or later.
/**
* as stated earlier, PHP version of IIFE is a copycat of Javascript IIFE
* so semantically and syntactically both PHP and Javascript versions are the same
* the below definition is all you need to know, and the rest is up to you to come
* up with the actual code logic that suite your objective!
*/
<?php
echo (function() // <---- the outer "(" marked as the opening of the main function -- start of the main IIFE function
{
// notice that function() is just an ordinary PHP anonymous function that you can put your code in it
// and inside here is its body of that ordinary PHP anonymous function and not
// part of the IIFE, but it will be executed by IIFE automatically via chains of reaction
// you can put your code in here!
// more code here!
// .....
return 12; // will output 12
}
) // <---- marked as the closing of the main body function -- end of the IIFE function
(); // <---- self-invoked function's opening and closing parenthesese
// notice that this is exactly as Javascript's IIFE second version: appearing outside of the body
// notice also the ending with a ";" to end the IIFE
?>
More Examples of PHP IIFE
<?php
$foo = (function()
{
return function($a)
{
return $a + 15;
};
}
)(); // <---- notice the ending with a ";" to end the IIFE
?>
Usage:
echo $foo(10); // will output 25
/**
* Note that in this example, when accessing an outer variable ($a) from within a function,
* function($b) in this case, we - unlike in JavaScript which has closures - need to use
* the use keyword to make that variable accessible: use ($a)
*/
<?php
$foo = (function($a)
{
// notice the nested anonymous functions, first, returning the innermost function
// and second, returning the next outer nested function
return function($b) use ($a)
{
return $a + $b;
};
}
)(15); // <---- notice that you can put some code inside the IIFE: 15 in this case
?>
Usage:
echo $foo(10); // will output 25
There you have it!!!
A brief introduction to Delphi
Note that this is just a very brief introduction to Delphi.
For more Delphi tutorials, please Google the subject and you'll get lots of resources to get you started.
Note that in Delphi, the syntax is slightly different than with other languages, for example, in other languages you use curly braces or brackets '{}' to group your block of code, such as the beginning and ending of a block of code. For example:
In other languages:
class MyClass
{
public function aMethod()
{
// code blocks
var number, zero;
if (true)
{
// if true code block
}
else if (...)
{
// else if code block
}
else
{
// else code block
}
try
{
zero := 0;
number := 1 div zero;
alert('number / zero = ' + number.toString());
}
catch (Exception e)
{
e.message('Unknown error encountered');
}
} // end function aMethod()
} // end class MyClass
In Delphi:
Type
TMyClass = class
public
class function aMethod()
begin // begin function aMethod block
// inside function aMethod code blocks
var
number, zero : Integer;
if (true) then
begin
// true condition code block
end // end if (true) then condition block without a ";"
else if (...) then
begin
// else if condition code block
end // end "else if" (...) block without a ";"
else
begin
// else condition code block
end // end "else" block, and it can contain a ";" as well -- it's optional!
end; // notice the "end" and a ";" to end the whole "if/else if/else" blocks!
// the ";" after thd "end" is a must and not an optional!
// Try to divide an integer by zero - to raise an exception
try
zero := 0;
number := 1 div zero;
ShowMessage('number / zero = ' + IntToStr(number));
except
ShowMessage('Unknown error encountered');
end; // end try block and it must contain a ";" -- it's not an optional!
end; // end function aMethod() - the ";" after the "end" is a must and not an optional!
end; // end class TMyClass block - the ";" after the "end" is a must and not an optional!
// Notice that in Delphi it uses keywords 'begin' and 'end',
// in certain blocks it can followed by a semicolon ';', to seperate between blocks.
// Note also that in a main program (not shown here) the final 'end' should be a period '.' instead of
// a ';' to end the whole program.
As you can see, once you know the basic syntax everything is trivial, especially if you're coming from other languages. All programming languages basically are identical in concept and foundation; for example, all languages have classes and all classes have three types of attributes.
Delphi also has three types of attributes: 1st type of attributes, 2nd type of attributes, 3rd type of attributes.
To learn more about the three types of attributes, please see my other tutorial called Class verses Object on this website.
Knowing that, let's start with a class definition and some basic language constructs like comment tags and letter casing.
Make note that in Delphi, an embedded comment is between the curly braces: {}. In other languages, they are: //, /* .... */.
// Delphi is a case-insensitive language, meaning upper- and lower-case letters are treated
// as lower-case letters -- indiferenced.
// this is a single-line comment in other languages such as PHP, Java, C/C++, Javascript, etc.
/* this is a multi-line comment in other languages such as PHP, Java, C/C++, Javascript, etc. */
// In Delphi, this is a single-line comment
{ In Delphi, this is a multi-line comment }
// In Delphi, the declaration section must begin with a "Type" keyword
Type
{ All class definitions must follow the "Type" heading }
{ The definition of a class must begin with the reserved keyword class. For example: }
// In Delphi, it is customarily to put a 'T' (for "Type") at the beginning of the class name
TMyClass = class // start of the class TMyClass declaration section
// 1st type attributes:
// In Delphi, this is how you declare your properties
{ As with other languages, Delphi has visibility controls also: public, protected, private }
public // begin a 'public' visibility control declaration section
const Max = 100; // declares a constant called Max that holds the integer 100
// If the right side of the equal sign returns an ordinal value, you can specify
// the type of the declared constant using a value typecast. For example:
const Number = Int64(20); // declares a constant called Number, of type Int64, that holds the integer 20
// To declare an array constant, enclose the values of the elements of the array,
// separated by commas, in parentheses at the end of the declaration.
// These values must be represented by constant expressions. For example:
// In PHP: const Digit = array('0', '1', '2', '3', '4', '5', '6', '7', '8', '9');
// Or: const Digit = ['0', '1', '2', '3', '4', '5', '6', '7', '8', '9'];
const Digit: array[0..9] of Char = ('0', '1', '2', '3', '4', '5', '6', '7', '8', '9');
// Above constant declaration: declares a typed constant called Digit that holds an array of characters 0 to 9
// The constant variable Digit can be accessed as an array as you normally would (in other languages) like this:
// Digit[0] ----> will hold a constant character string value of '0'
// Digit[1] ----> will hold a constant character string value of '1'
// Digit[2] ----> will hold a constant character string value of '2'
// Digit[3] ----> will hold a constant character string value of '3'
// and so on up to 9
// Notice that they hold character values (i.e., '0', '1', '9') and not integer values.
// But the array indexes are integer values (i.e., 0, 1, 2) as a normal array index.
// To declare a constant variable containing integer values, do the following:
const Digit: array[0..9] of Integer = (0, 1, 2, 3, 4, 5, 6, 7, 8, 9);
// Above constant declaration: declares a typed constant called Digit that holds an array of integers 0 to 9
// Similarly the variable Digit can be accessed as an array like the above characters example
// Simialrly you can declare a constant without the definition values as well:
const Digit: array[100..200] of Integer;
// And then in the implementation section you can assign values like the following:
Digit = array(100, 101, 102, 103, 104, 105, 106, 107, 108, 109, ...);
// The following declares a string typed constant called Day that holds an array of strings
const Day: array[0..6] of String = ('Sun', 'Mon', 'Tue', 'Wed', 'Thu', 'Fri', 'Sat');
// The constant string variable Day can be accessed as an array as you normally would like this:
// Day[0] ----> will hold a constant string value of 'Sun'
// Day[1] ----> will hold a constant string value of 'Mon'
// Day[2] ----> will hold a constant string value of 'Tue'
// Day[3] ----> will hold a constant string value of 'Wed'
// and so on up to 'Sat'
{ The purpose of the 1st type of attributes of the class (above) is to store content values that }
{ are constant and can't change its values during the lifecycle of the application }
// 2nd type attributes:
{ a property called 'A' is declared as 'public'
to access this property call getA(), to set this property call setA(10)
you normally call this property from anywhere inside the class, particularly from
inside the constructor using the global variable 'self' which is equivalent to $this in PHP:
self.setA(10); // property A is now holds an integer 10
A = self.getA(); // A = 10
}
{
notice that you can name the getter/setter (i.e., getA(), setA(), etc.) with any name you wish,
but the convention is to use camelCase, i.e., getMyPropertyA(), setMyPropertyA()
and as well as leaving out the () from the getter/setter methods as shown in the following:
}
class property A : Integer read getA write setA;
{ a property called 'B' is declared as 'public' }
to access this property call getB(), to set this property call setB(10) }
class property B : Integer read getB write setB;
protected { begin a 'protected' visibility control declaration section }
// likewise, to access this property call getX(), to set this property call setX(10)
class property X : Integer read getX write setX;
private // begin a 'private' visibility control declaration section
{ likewise, to access this property call getY(), to set this property call setY(10) }
class property Y : Integer read getY write setY;
// As you can see above, these property values can and will change their
// values during the lifecycle of the application
// As with other languages, Delphi has a 'var' type for declaring variables
var
number, zero : Integer;
myChar : Char;
myDateFormat : String;
isCorrect : Boolean;
// So the purpose of the 2nd type of attributes of the class (above) is to store content
// values that are constantly changing (its values) during the lifecycle of the application
{ In Delphi, this is how you declare your static methods }
// 3rd type attributes:
public // begin a 'public' visibility control declaration section
class function StatFunc(s : String); static; { a static function method }
class procedure StatProc(s : String); static; { a static procedure method }
class function Add(A : Integer, B : Integer) : Integer; { a regular, 'non-static', method }
class function GetCount(); { a regular, 'non-static', method }
protected { begin a 'protected' visibility control declaration section }
{ a regular, 'non-static', method }
class function Method1();
private // begin a 'private' visibility control declaration section
{ a regular, 'non-static', method }
class function Method2( { just like other languages you can embedd multi-line comment as well } );
{ In Delphi, this is how you declare your constructor method }
{ In Delphi, you have to declare your constructor method using a function/constructor name called
{ Create() with the same format as shown here}
public { a constructor and a destructor are declared as a 'public' visibility control }
// see a similar constructor method implementation later in the TShape example
constructor Create(Owner : TComponent); override;
{
As you may know already, a constructor gets called by other code very frequently, and as such,
it uses a lot of internal chipset registers. registers are like blackboards to write on.
in a blackboard, you need to erase the blackboard when the materials on it are not needed.
similarly in computer programming, you need to reclaim the used registers so that you can
use them again.
}
{
Delphi is a low-level language that can operate on chipset registers much like assembly
language can; and therefore, it can reclaim registers used during operations.
this destructor does that by reclaiming the used registers and clean out the garbages created
by the constructor.
}
destructor Destroy; override;
{ The purpose of the 3rd type of attributes of the class (above) is to calculate and manipulate }
{ the content values that contain in the 1st and 2nd types of attribute property variables }
end; { end of the class TMyClass declaration section }
{ Notice that after the end of the class TMyClass declaration section you can
declare another class declaration section as well, i.e., TMyOtherClass,
using the same format as above.
This is called "stacking" -- we're stacking classes one on top of another.
You can do this with other languages as well and it works the same way for the same purpose.
What it does is that, instead of having to create a seperate file for each class, you can
stack them on top of one another in the same file and call them from any class, and from
anywhere using only one include file statement, and saving you the effort of having to include
all of the files.
However, this practice of "stacking" is discouraged in all medium to large applications because
it can get cluttered and hard to debug.
So in most every day programming chores, "stacking" is discouraged and only in certain
situations where less cluttered can be achieved that you should use "stacking".
Having said that, here is how you can stack your classes:
}
TShape = class(TGraphicControl)
private
FPen : TPen;
FBrush : TBrush;
procedure PenChanged(Sender : TObject);
procedure BrushChanged(Sender : TObject);
public
{ This is a Delphi constructor: Constructor T{your_class_name}.Create()
In PHP: function __construct() }
constructor Create(Owner : TComponent); override;
destructor Destroy; { just like other languages you can embedd multi-line comment as well } override;
{ ... more code here! }
end; { end of the class TShape declaration section }
{ begin the constructor implementation section }
constructor TShape.Create(Owner : TComponent);
begin
inherited Create(Owner); // Note: this is a single-line comment: Initialize inherited parts
Width := 65; { Note: this is a multi-line comment: Change inherited properties }
Height := 65;
FPen := TPen.Create; // Initialize new fields
FPen.OnChange := PenChanged;
FBrush { just like other languages you can embedd multi-line comment as well } := TBrush.Create;
FBrush.OnChange := BrushChanged;
// Assuming you had declared these property methods like shown earlier, you can call them:
self.setA(10); // In PHP: $this->A = 10;
A = self.getA();// In PHP: $A = $this->A;
end;
As you can see, it is very easy to program in Delphi and it is also a very powerful language that can work with very low level registers similar to Assembler language.
For more resources on the subject of Delphi programming language, here is a link to the Delphi
Delphi is a programming language for the desktop applications and for cross-platform mobile applications such as building apps for smartphones (i.e., iOS and Android platforms) using Delphi. Here is a link to an excellent tutorial titled: Building your first Native Mobile Applications for iOS and Android Building Cross-Platform Mobile Applications Using Delphi: Building a REST Client for Stack Overflow
Typically, you would need to find an iOS platform SDK to build your iPhone mobile applications that can run on an iOS platform and then you would need to find an Android platform SDK to build your mobile applications that can run on Android platform.
With Delphi mobile platform, you can build both iOS and Android mobile applications using only one SDK platform. This is very convenient and powerful and not to mention the simpicity of having to learn only one platform for building cross-platform mobile applications.
Again, if you are interested into the deep end of the programming language world for both desktop and mobile, start with the free and full-featured Community Editions of Delphi and C++Builder. Community Editions of Delphi and C++Builder are designed to help you get started programming. These powerful IDEs provide all the features you need to quickly explore robust app development.
When Community Edition launched it made all the features of the Professional Edition of Delphi and C++Builder free to students and hobbyists in the community: including mobile platforms, desktop database, and the full source code for the runtime libraries. Now the 10.4.2 Sydney update brings the absolutely latest features and updated platform support to Delphi & C++Builder Community Edition.
There's no better way to build powerful native applications for iOS, Android, Windows, and macOS from a single codebase than using the robust and easy-to-learn Delphi language. This makes it the ideal choice for students or anyone who just wants to get things done.
C++Builder is your choice if you want to master the mysteries of the curly brace (see illustration below). It unlocks a huge variety of C++ standard libraries, while still giving you access to the powerful runtime libraries included in Delphi. This is a winning combination for C++ development.
The Community Editions of Delphi & C++Builder are designed for students and hobbyists. If that is you, and you are new to programming, then download the free Community Edition of your choice [Delphi 10.4.2 CE or C++Builder 10.4.2 CE] and register for the free Learn to Code Summer Camp.
Community Editions are available free of charge to developers, and organizations with fewer than five developers. Here are the download links Start Learning Delphi for Free: Delphi & C++Builder FREE Community Editions Start Learning Delphi for Free: Download the FREE Delphi Community Edition Start Learning Delphi for Free: Download the Free C++Builder Community Edition
Here is an introduction to Model-View-View Model (MVVM) in Delphi:
An Introduction to Model-View-View Model (MVVM) in Delphi: Build an MVVM App in Twenty Minutes An Introduction to Model-View-View Model (MVVM) in DelphiFor more resources on the subject of Delphi programming language, here are some links to the Delphi resources:
Delphi Community Development Forum Delphi BlogsHere are more examples on Delphi Programming.
This code is an example of how to create a form and a button in a Delphi application.
The goal is to create a new form and a new button when a user clicks on a button in a Delphi application.
This code has a form (TForm1) with a single button.
Each time a user clicks on a button, a new button and a new form are created on the fly.
The created button is shown on the TForm1.
The form TForm1 is created but not visibly shown.
A list (FList) keeps a reference to the created button and form.
The created button and form have their Tag property set to the index in the list.
The button's OnClick event handler uses this index to retrieve the corresponding form from the list and make it visible.
In other words, when a user clicks on the button shown on the form it executes the Button1Click() procedure, and inside this procedure that it fires up an OnClick event property causing the private procedure MyClick() to be called.
The form is created with a nil Parent so that it is a flying window.
If you use self instead of nil, the created form will be inside the TForm1, much like a DMI application.
File: FormButtonApp.pas
{ Each Delphi application is a unit}
{ A typical Delphi application starts with a unit keyword follows by a name, and in this example
it is called "DynFormDemo"}
Unit DynFormDemo; // name of the unit of this application
{ Each Delphi application contains an interface section}
Interface { An interface section is like a declaration section}
{ Each Delphi application contains a "uses" clause (or include statement in PHP)}
{ The "uses" clause lists all the units/libraries that this unit uses}
Uses Winapi.Windows, Winapi.Messages, System.SysUtils, Sysyem.Variants,
System.Classes, Vcl.Graphics, Vcl.Controls, Vcl.Forms, Vcl.Dialogs, Vcl.StdCntrls,
System.Generics;
{ You declare all your classes and records and all other declarations in the type section}
Type
TFormItem = record
AForm : TForm;
AButton : TButton;
end; { An end of a record declaration section}
TForm1 = class(TForm);
{ Any declaration without specific visibility/access control fall under public section}
Button1 : TButton;
{declaring a button procedure for a user to click}
procedure Button1Click(Sender : TObject);
private
FList : TList <TFormItem>;
procedure MyClick(Sender : TObject);
public
constructor Create(AOwner : TComponent); override;
destructor Destroy; override;
end;
Var
Form1 : TForm1; {yes, TForm1}
{ Each Delphi application contains an implementation section where you implement the
actual code contain in the interface section}
implementation
{$R *.dfm}
{implement a button procedure for a user to click}
procedure TForm1.Button1Click(Sender : TObject);
var
Item : TFormItem;
AButton : TButton;
AForm : TForm;
begin
{create an instance of the TButton object}
{this is how you create a button}
AButton := TButton.Create(Self);
{setting the properties of the button}
AButton.Tag := FList.Count;
AButton.Left := 80;
AButton.Top := 50 + AButton.Tag * 60;
AButton.Width := 300;
AButton.Height := 50;
AButton.Name := 'Liste' + IntToStr(AButton.Tag);
AButton.Caption := ClassName + ' ' + IntToStr(AButton.Tag);
AButton.OnClick := MyClick; {tying a button to a procedure to execute}
AButton.Parent := Self;
{create an instance of the TForm object}
{this is how you create a form}
AForm := TForm.Create(Self);
{setting the properties of the form}
AForm.Tag := AButton.Tag;
AForm.Left := AButton.Tag * 20;
AForm.Top := AButton.Tag * 20;
AForm.Width := 200;
AForm.Height := 100;
AForm.Name := 'John Doe' + IntToStr(AForm.Tag);
AForm.Caption := 'John Doe' + IntToStr(AForm.Tag);
AForm.Parent := nil;
AForm.Visible := FALSE;
Item.AForm := AForm;
Item.AButton := AButton;
FList.Add(Item); {adding a form containing a button to the list}
end;
constructor TForm.Create(AOwner : TComponent);
begin
inherited;
FList := TList <TFormItem>.Create;
end;
destructor Destroy;
begin
FreeAndNil(FList);
inherited;
end;
{when a user clicks on a button the event of the click action is captured and sent via}
{the variable Sender. You can name this variable any name you wish}
{you can use this captured event variable Sender to do whatever necessary [as shown below]}
procedure TForm1.MyClick(Sender : TObject);
var
Item : TFormItem;
begin
Item := TList[(Sender as TButton).Tag]; {tying a button to the list}
if assigned(Item.AForm) then
begin
Item.AForm.Show; {display the form and the button in the list}
end;
end;
end.
How to Create, Use, and Close Forms in Delphi
Form
Form objects are the basic building blocks of a Delphi application, the actual windows with which a user interacts when they run the application. Forms have their own properties, events, and methods with which you can control their appearance and behavior. A form is actually a Delphi component, but unlike other components, a form doesn't appear on the component palette.
We normally create a form object by starting a new application (File | New Application). This newly created form will be, by default, the application's main form - the first form created at runtime.
Note: To add an additional form to Delphi project, (in the Delphi IDE) select File|New Form.
Make sure you have a Delphi IDE installed on your computer. Check out the Delphi Community Development Forum for guidance.
OnCreate
The OnCreate event is fired when a TForm is first created, that is, only once. The statement responsible for creating the form is in the project's source (if the form is set to be automatically created by the project). When a form is being created and its Visible property is True, the following events occur in the order listed: OnCreate, OnShow, OnActivate, OnPaint.
You should use the OnCreate event handler to do, for example, initialization chores like allocating string lists.
Any objects created in the OnCreate event should be freed by the OnDestroy event.
Create a Delphi Form From a String
There may be instances when you do not know the exact class type of a form object. You may only have the string variable carrying the name of the form's class, such as "TMyForm".
Note that the Application.CreateForm() procedure expects a variable of type TFormClass for its first parameter. If you can provide a TFormClass type variable (from a string), you will be able to create a form from its name.
The FindClass() Delphi function locates a class type from a string. The search goes through all registered classes. To register a class, a procedure RegisterClass() can be issued. When the FindClass function returns a TPersistentClass value, cast it to TFormClass, and a new TForm object will be created.
Sample Exercise
Create a new Delphi project and name the main form: MainForm (TMainForm).
Add three new forms to the project, name them:
FirstForm (TFirstForm)
SecondForm (TSecondForm)
ThirdForm (TThirdForm)
Remove the three new forms from the "Auto-create Forms" list in the Project-Options dialog.
We're working from the Delphi IDE using form designer available in the IDE.
Drop a ListBox on the MainForm and add three strings: 'TFirstForm', 'TSecondForm', and 'TThirdForm'.
procedure TMainForm.FormCreate( Sender: TObject);
begin
RegisterClass(TFirstForm);
RegisterClass(TSecondForm);
RegisterClass(TThirdForm);
end;
In the MainForm's OnCreate event register the classes:
procedure TMainForm.CreateFormButtonClick( Sender: TObject);
var s : string;
begin
s := ListBox1.Items[ListBox1.ItemIndex];
CreateFormFromName(s);
end;
Once the button is clicked, find the selected form's type name, and call a custom CreateFormFromName procedure:
procedure CreateFormFromName(const FormName : string);
var fc : TFormClass;
f : TForm;
begin
fc := TFormClass(FindClass(FormName));
f := fc.Create(Application);
f.Show;
end; (* CreateFormFromName *)
If the first item is selected in the list box, the "s" variable will hold the "TFirstForm" string value. The CreateFormFromName will create an instance of the TFirstForm form.
Creating a form (without the form designer)
The following code doesn't work because it doesn't start an event loop to keep the process running.
Form window = new Form(); window.FormBorderStyle = FormBorderStyle.None; window.BackgroundImage = blurred; //blurred is a Bitmap window.SetBounds(bounds.X, bounds.Y, bounds.Width, bounds.Height); //bounds is a Rectangle window.Show();
Change the above code to:
Form window = new Form(); window.FormBorderStyle = FormBorderStyle.None; window.BackgroundImage = blurred; //blurred is a Bitmap window.SetBounds(bounds.X, bounds.Y, bounds.Width, bounds.Height); //bounds is a Rectangle Application.Run(window);
The addition of Application.Run starts a message processing loop so that the application is now waiting for events to process until you run Application.Exit.
Sending the window through to this command guarantees that exit is automatically run when you close your form so you don't accidentally leave the process running in the background.
There is no need to run your forms show() method as Application.Run makes this visible for you automatically.
That said I would still recommend using a method similar to what was posted by LarsTech as it solves some additional problems.
static void main()
{
Application.EnableVisualStyles();
Application.SetCompatibleTextRenderingDefault(false);
Form window = new Form();
window.StartPosition = FormStartPosition.Manual;
window.FormBorderStyle = FormBorderStyle.None;
window.BackgroundImage = blurred; //blurred is a Bitmap
window.SetBounds(bounds.X, bounds.Y, bounds.Width, bounds.Height);
Application.Run(window);
}
Application.EnableVisualStyles tells your application to default to the styles used at your OS level.
Application.SetCompatibleTextRenderingDefault has been defaulted to false in new forms projects since Visual Studio 2005. You should have no reason to change it as you are obviously doing new development.
Make sure you have a message pump running.
Something like:
static void Main()
{
Application.EnableVisualStyles();
Application.SetCompatibleTextRenderingDefault(false);
Form window = new Form();
window.StartPosition = FormStartPosition.Manual;
window.FormBorderStyle = FormBorderStyle.None;
window.BackgroundImage = blurred;
window.SetBounds(bounds.X, bounds.Y, bounds.Width, bounds.Height);
Application.Run(window);
}
The other thing to make sure is that your bounds rectangle is actually within the screen dimensions.
To be continued!!!
A brief introduction to Java main() method
In every programming language there is an entry point of execution of the application. In other words, every program or application there is a starting point for the program to begin executing the code.
In Java, that starting point is a function called main().
Note: A function is also known as a method and both can be used interchangibly.
Every Java program or application has to have a main() function to jumpstart the application. If you program a Java program, you'll need to create a function called main(), otherwise, it will give you an error and your Java program won't start.
Java main() method is the entry point of any java program. Its syntax is always like this:
public static void main(String[] arg)
As often the case for any method or function, it is normally belonging to a class and must reside in a class. In the following, we have a class called "HelloWorldApp".
File: HelloWorldApp.java
class HelloWorldApp
{
public static void main(String[] arg)
{
System.out.println("Hello World!"); // Display the string
}
}
Let's continue talking about the function main() in greater details.
The main() method accepts one array string argument, in this case, arg. Notice that arg is of type array String[].
It doesn't have to be named as arg - it can be any name you choose, but it has to be a type 'String[]'.
The array arg contains the values of what the user will type after the class name, when compiling/running or launching your program. For example, to run a class named Foo, the user must type the run command, followed by a compile directive, and in this case, 'java', followed by a class name 'Foo':
$ java Foo
Notice that I specified '$' as a temporary run command symbol. So you'll have to check the Java documentation to find out the exact run command as this tutorial in not about running a Java program but rather it is about a main() method.
Note also that nowaday people don't use run command line any more. The command line like: $ java Foo bar baz is nowaday outdated. Now they are often use IDE (or Integrated Development Environment), a sort of GUI (or Graphic User Interface) development program to do all of their programming work to make their lives easier.
So in this tutorial it is a moot point or useless point in showing you a particular IDE that is not your intended IDE of preference, and therefore, showing an outdated general command line is for an illustration purpose only.
So the message is this: Check out your IDE's instruction on how to compile, run, and use your IDE to do your programming work.
In a NetBean IDE, you can just select your project to open it and once it open, just select 'Run' from the menu bar at the top of the window and it will run your entire project for you.
If you have to run with arguments, say bar and baz, etc., instead of selecting 'Run', just select 'Run with Arguments' and a window opens up for you to enter the argument parameters. In this window, you can select or enter files as arguments as well.
As you may know, at times you may have a file or files for your program to read at run-time, such as a product rating table that contains ratings on each product if you're doing an ecommerce application.
To read the file containing product ratings at run-time, you'll have to include that file in the command line or in most cases nowaday in your IDE command line.
Of course, there are other ways of including files in your program as well and including it at run-time on the command line is one of the ways.
Now remember that this tutorial is about Java method main() and not about IDE or files.
Now everything the user types after the class name ('Foo') is considered to be a parameter. For example:
$ java Foo bar baz
Now when you type a similar command as shown above (provided you use the correct run command or IDE run command), the Java compiler engine reads the command and processes it accordingly.
In the case above, it receives a class Foo and two parameters: bar and baz. These parameters are stored in the array arg contains in the method: public static void main(String[] arg).
In other words, after you type the command it picks out all the various items and place them in the appropriate place, particularly, placing the two string items bar and baz in the string array argument called arg.
Now arg is an array variable containing two elements: arg[0] = 'bar', arg[1] = 'baz'.
Now you can access the first element by accessing arg[0], the second element by accessing arg[1], and so on if you provide more arguments at the command line when you run the command.
If you try to access an invalid position (when you didn't type what you were supposed to type), that statement will throw an ArrayIndexOutOfBoundsException, just like it would with any array. You can check how many parameters were typed with arg.length.
In other words, to find out how many arguments you supply to the command, use arg.length. For example:
public static void main(String[] arg)
{
if (arg.length > 0)
{
// We're checking arg to decide whether it is bar or other:
if (arg[0].equals("bar"))
{
// do something with bar parameter
}
else if (arg[0].equals("other"))
{
// do something with 'other' parameter
}
}
} // end main()
So the number of arguments in main(String[] arg) is dependent on the run-time user input into the command line or IDE GUI. The arguments can be a file or any ordinary variables that you want to pass into the main() function.
A typical usage would be to check if variable arg contains anything by checking the array length, and if it's ok, you access arg[0] to read what a user has typed on the command line. And then, you can process the arguments accordingly. For example:
public class Foo
{
public static void main(String[] arg)
{
if (arg.length == 0)
{
System.out.println("no arguments were given."); // Display the string
}
else
{
for (String a : arg)
{
System.out.println(a); // Display the string in variable 'a'
}
}
}
}
The above class will parse the parameters entered on the command line by a user. If he/she hasn't type anything, the class will print the message "no arguments were given."
If he/she typed something on the command line, those parameters will be shown on the screen.
So, if you run this class with the two examples shown in the following, the output would be shown accordingly, with the first one showing: no arguments were given., and the second one: bar baz.
$ java Foo
no arguments were given.
$ java Foo bar baz
bar
baz
In summary about function main() is that we can pass arguments to the main() method using command line during run-time. For example:
java myjavacode.MyClass Hello World
When the JVM executes the main() method of the myjavacode.MyClass, the String array passed as parameter to the main() method will contain two Strings: "Hello" and "World".
And you can access those values using the string array parameter contained in main(); for example, if you named your parameter as arg, then it would be: arg[0] = 'Hello' and arg[1] = 'World'.
Another typical usage for function main() is to read some files from external sources and then process those files accordingly inside function main(). Let's see an example to illustrate the point.
/**
* Stores a collection of product ratings efficiently in a
* file.
*/
public class MyFileReader implements Serializable
{
// there should be lots of public and private variable declaration here!
private static final long serialVersionUID = 7526472295622776147L;
/**
* Default constructor.
*/
public MyFileReader()
{
// there should be some constructor initialzation code here!
}
/**
* Reads a text file in the form of:
*
* product id, user id, product rating
*
* pid, uid, rating
*
* or something like this:
*
* sku-001, john_doe_123, 4
* sku-002, jane_doe_666, 5
* sku-003, mary_q_public_777, 2
* sku-004, joe_sixpack_999, 3
*
* this function readData() is called by main() below at the bottom
* passing the parameters of main() that the user entered as file names.
* for example:
*
* MyFileReader reader = new MyFileReader();
*
* String sourceFile = null;
* String destFile = null;
*
* the array arg is obtained from: public static void main(String arg[])
*
* notice that you put the "[]" next to 'String' or next to 'arg' and
* it will work just fine!
*
* sourceFile = arg[0];
* destFile = arg[1];
*
* reader.readData(sourceFile);
*/
public void readData(String fileName)
{
try
{
Scanner in = new Scanner(new File(fileName));
String[] line;
short pid;
int uid;
byte rating;
String date;
while (in.hasNextLine())
{
line = in.nextLine().split(",");
pid = Short.parseShort(line[0]);
uid = Integer.parseInt(line[1]);
rating = Byte.parseByte(line[2]);
// these two methods are not included here due to space constraint
addToProduct(pid, uid, rating);
addToCust(pid, uid, rating);
}
}
catch(FileNotFoundException e)
{
System.out.println("Can't find file " + fileName);
e.printStackTrace();
}
catch(IOException e)
{
System.out.println("IO error");
e.printStackTrace();
}
}
// here is the function main() that we're interested in!
public static void main(String arg[])
{
/**
* notice that you put the "[]" next to 'String' or next to 'arg' and
* it will work just fine!
*/
// instantiating our file class
MyFileReader reader = new MyFileReader();
// initialize our two files to be utilized
String sourceFile = null;
String destFile = null;
try
{
/**
* now right here is the crux of our tutorial about main()
* notice that the array arg contains two argumemt parameters
* one has the array element o and another has array element 1.
*/
sourceFile = arg[0];
destFile = arg[1];
// the rest of the code in the following is just ordinary
// file processing code using function readData() to do it!
reader.readData(sourceFile);
reader.sortHashes();
IntArrayList user = reader.custProduct.keys();
for (int i = 0; i < user.size(); i++)
{
System.out.println(user.get(i));
}
serialize(destFile, reader);
}
catch(Exception e)
{
System.out.println("usage: java MyFileReader sourceFile destFile");
e.printStackTrace();
}
} // end void main()
} // end class MyFileReader implements Serializable
There you have it!
A very brief introduction to function main().
For more Java tutorials, please Google the subject and you'll get plenty of resources to get started.
Here is a very good place to get started.
You'll have to follow the Learning Trail by starting from the 'Getting Started' start of the trail and following its 'Trail' to the end of the trail by clicking the 'Next >>' from topic to topic.
If you finish the 'Trail' you'll be an expert in Java:
Introduction to Java: Learning TrailWhat is a VARARG ?
A vararg is a variable-length argument list (a.k.a. vararg, variadic arguments), using the ellipsis (three dots, ...) token before the argument name to indicate that the parameter is variadic, i.e., it is an array variable to hold all parameters supplied by the caller of the function.
It is an arbitrary number of arguments in a method or constructor. It contains a list of arguments in a method, function, or constructor.
A simplier way of saying is that, a vararg is a variable token that accepts an arbitrary number of arguments in a method, function, or constructor.
Let's put it this way: When you create a method, a function, or a constructor, you have to declare your method, function, or constructor with an exact number of arguments, for example: public (a type, i.e., double) MyMethod(a, b, c). Notice that you have three arguments: a, b, c.
Now instead of having to declare an exact number of arguments (3 in the above case), you can use a variable token to declare in your method, function, or constructor to accept an arbitrary unknown number of arguments in your method, function, or constructor. For example: public String MyMethod(...vararg).
Notice an ellipsis (three dots, ...) in front of the variable vararg. This is called a vararg.
You can use a construct called vararg to pass an arbitrary number of values to a method. You use vararg when you don't know how many of a particular type of argument will be passed to the method. It's a shortcut to creating an array manually.
Consider this function which has a list of arguments, including variadic and non-variadic arguments.
<?php
/**
* To use vararg, you follow the type of the last parameter by an ellipsis (three dots, ...),
* then a space, and the parameter name.
*
* For example:
*
* public Address (String... addr)
*
* Notice the token ... before the variable argument!
*
* It signifies that the argument length is unknown at design time!
* The actual argument list will be known at run-time when caller of
* this function passes in the exact number of arguments!
*
* Also, noted that you can mix both variadic and non-variadic arguments in any function,
* seperating them with commas!
*
* The method can then be called with any number of that parameter, including none.
* For example:
*
* public static void main(String[] arg)
* {
* new Address(); // none!
* }
*/
package mailinglist;
/**
* A contact is a name and address.
*
* For the purpose of this example, I have simplified matters
* a bit by making both of these components simple strings.
* In practice, we would expect Address, at least, to be a
* more structured type.
*/
class Address implements Cloneable
{
private String name;
private String streetAddress;
private String city;
private String state;
private String zipCode;
/**
* Constructor
*
* Create an address.
*
* Notice that addr is an array of unknown (argument) length
* The argument length will be passed in by the calling code
*
* For example:
*
* public static void main(String[] arg)
* {
* new Address("John Doe", "1234 Main St", "Minneapolis", "Minnesota", "55401");
* }
*/
public Address(String... addr)
{
/**
* Because addr is an array of unknown (argument) length we have to test
* the argument length that was passed in by the calling code
*
* Note that this testing of argument length is not the most elegant way to do it.
* But it illustrates the point!
*/
if addr[0] != -1)
{
this.name = addr[0].name;
}
if addr[1] != -1)
{
this.streetAddress = addr[1].streetAddress;
}
if addr[2] != -1)
{
this.city = addr[2].state;
}
if addr[3] != -1)
{
this.state = addr[3].state;
}
if addr[4] != -1)
{
this.zipCode = addr[4].zipCode;
}
}
?>
Here is another example to show how to use vararg.
First of all, let's illustrate the Point coordinate class to be used in the vararg:
<?php
public final class Point
{
// Point coordinates
final double x; // x-coordinate
final double y; // y-coordinate
// A Point constructor to initialized the point coordinates
public Point(double x, double y)
{
this.x = x;
this.y = y;
}
}
?>
Here is the illustration of the vararg using class Point (above) as the object type. Notice that variable corner is an argument of unknown length of coordinates.
In other words, you can pass in lots of coordinates at run-time but during design-time, it is unknown. All we know is that we can reference the x- and y-coordinates at design-time:
<?php
class Geometry
{
// code logic
public Polygon Area(Point... corner)
{
int numberOfSide = corner.length;
double squareOfSide, lengthOfSide;
squareOfSide = (corner[1].x - corner[0].x) * (corner[1].x - corner[0].x) +
(corner[1].y - corner[0].y) * (corner[1].y - corner[0].y);
lengthOfSide = Math.sqrt(squareOfSide);
// more method body code follows that creates and returns a
// polygon connecting the Point(s)
}
}
?>
You can see from the above illustration, inside the method Area, corner is treated like an array. The method (Area) can be called either with an array or with a sequence of arguments. The code in the method body will treat the parameter as an array in either case.
You will most commonly see vararg with the printing methods; for example, this Java built-in library printf() method:
public PrintStream printf(String format, Object... vararg)
{
// Java internal code implementation for printf()
}
// Now the function above allows you to print an arbitrary number of objects.
// It can be called like this:
System.out.printf("%s: %d, %s%n", name, idnum, address);
// Or it can be called like this as well:
System.out.printf("%s: %d, %s, %s, %s%n", name, idnum, address, phone, email);
// Or with yet a different number of arguments.
// The possibility is vast when you use vararg
?>
There you have it!!!
A brief introduction to SPL auto load
For a related topic on auto load and on how to use SPL auto load, please check out the 'how to build your own framework':
Advanced Pattern in MVC: Code Your Own PHP MVC FrameworkAutoloading of classes is a daily chore if you're a programmer. Every time you build an application (big or small) requires you to load your classes from the directories where classes are located. Most inexperienced programmers (or maybe all inexperienced programmers) typically load their classes at the class level rather than at the application level. Here is an example of loading of classes at a class level:
<?php
include '/home/package/someclass.php';
include_once '/home/package/someotherclass.php';
require '/home/package/somemoreclass.php';
require_once '/home/package/someothermoreclass.php';
/**
* An example of loading classes at a class level
*/
class MyClass extends OtherClass
{
// more code here
// .....
}
As you can see, this class loads four classes (someclass.php, someotherclass.php, somemoreclass.php, someothermoreclass.php) files at the top of the class file. This is called class level loading. This is the most popular way of doing for most of us programmers, including experienced and inexperienced programmers.
There is absolutely nothing wrong with class level loading and it can accomplish tasks (large or small) very well. However, pattern programming methodologies are becoming more and more popular and thus making use of application level loading even more mainstream.
Pattern programming methodologies such as the MVC pattern, loading of classes are taking place at the application level -- and that is, we don't put the include, include_once, require, or require_once at the top of every class or at anywhere in the class. Rather, it is autoloaded directly into the base class.
FYI: PHP's __autoload() is deprecated as of PHP 7.2.0 and its usage is discouraged.
So use SPL auto load instead.
The following description shows how SPL auto loads of classes.
SPL is short for Standard PHP Library, a collection of interfaces and classes that are meant to solve common problems. No external libraries are needed to build this extension and it is available and compiled by default in PHP 5.
SPL provides a set of standard datastructure, a set of iterators to traverse over objects, a set of interfaces, a set of standard Exceptions, a number of classes to work with files and it provides a set of functions like spl_autoload_register().
To auto load classes, there are two ways of doing it:
First, here is a simple version that uses an anonymous function to attempt to load the classes ExampleClass1 and ExampleClass2 from the files exampleclass1.php and exampleclass2.php, respectively. This is the simplest version you can use:
<?php
spl_autoload_register(function ($class_name)
{
// Of course, you need to specify a complete path to the
// class file
include $class_name . '.php';
}
);
?>
The code above registers anonymous function (along with its argument variable $class_name) with PHP (or SPL, to be more specific).
Now any time you create an instance of a class, like the following.
Also, don't forget to include the use clause at the top of your class file that refers/instantiates the classes. For example:
use app\controller\ExampleClass1;
use app\model\ExampleClass2;
$obj1 = new ExampleClass1();
Or
$obj2 = new ExampleClass2();
Or if classes are namespaced like these:
$obj1 = new app\controller\ExampleClass1();
Or
$obj2 = new app\model\ExampleClass2();
PHP (or SPL) will attemp to create an instance of the class, but if PHP doesn't recorgnize that class it will tries to load and include that class name specified in variable $class_name -- or classes ExampleClass1 and ExampleClass2 in this case.
Or if classes are namespaced, it's app\controller\ExampleClass1 and app\model\ExampleClass2.
Note: You should always use namespace on all of your classes when required as it is more robust and efficient. Also notice that,
'app' and 'controller' are actually folder names containing the models or classes (ExampleClass1, in this case). Likewise, 'app' and 'model' are the folder names containing the model 'ExampleClass2'
In other words, if PHP (or SPL) doesn't recorgnize that class it will call the anonymous function() above passing a string -- ExampleClass1 or ExampleClass2 -- to the anonymous function. Or if classes are namespaced, it will pass a string -- app\controller\ExampleClass1 or app\model\ExampleClass2 -- to the anonymous function.
Suppose you want to incorporate an spl_autoload functionality in your base class called Example. Here is how you would do it:
<?php
'path' and 'to' are actually folder names containing the models or classes
namespace path\to;
/**
* As you can see, in the above namespace statement, it points to a folder 'path/to'
*
* You'll see later, that the namespace like 'path\to' will be converted to a directory
* structure of the form: path/to/my/className. For example: path/to/my/ParentClass.
*
* Pay special attention to the 'use' clause as it allows class 'Example' to extend
* from class 'ParentClass'
*
* Now in class ParentClass, you need to namespace it so that class 'Example' can
* extend it by using the 'use' clause. For example, at the top of class ParentClass:
*
* namespace path\to;
*
* with 'path' being a folder named 'path' and 'to' also being
* a sub-folder named 'to'. Of course, you can name any name you wish!
*
* Now when PHP sees class 'Example', if it doesn't recorgnize it, it will call the
* anonymous function and passing the string 'Example' to it!
*
* Also, since class Example extends ParentClass, it will use that parent class by
* referring to the 'use' clause, and in effect, SPL calls the anonymous
* function as well and passing the string 'ParentClass' to it as well!
*
* So the key to a good programming practice is to use namespace on your classes!
*/
use path\to\ParentClass;
/**
* Example is the base class serving common functionalities.
*/
class Example extends ParentClass
{
// Using anonymous function, you can put spl_autoload_register() statement
// anywhere in your main base class including inside the constructor
// In an MVC pattern, you can put spl_autoload_register() statements inside
// the starting script file as well
spl_autoload_register(function ($class_name)
{
// Of course, you need to specify a complete
// path to the class file
// also, name all class files the same as
// their class names
// If you happen to read my other tutorial
// on 'coding standard', I lay out a reason
// by stating that it is very important
// that a file name MUST be the same as the
// class name!
// This is the reason why it has to be!
// In my coding standard I also suggest that
// all file names are in lowercase letters!
// However, it is NOT manditory! It's not "A MUST"!
// This is because I found that for some shared
// hostings, they think a lowercase file name is
// different than its camelcase class name and they
// give error: Class NOT Found!
// For example declaring classes like these:
// class MyApplication is different than class myapplication
// this difference is pertaining to shared hostings only
// and not pertaining to PHP language itself!
// so make note of that!
// In other words, it can't find a class with the same name
// as the lowercase file name.
// yes, it is weird! but be aware of it!
// it caused me a major headache until I realized the problems!
// This scenario is very rare, but it is out there
// and just be aware of it!
// If you see this error, try to rename your class
// file name in the same letter case as the
// class name.
// But in general, use lowercase letter for all
// file names
include $class_name . '.php';
}
);
}
?>
Here again, if PHP (or SPL) doesn't recorgnize the class that is being instantiated, it will call the anonymous function() inside class Example passing a string contains in the variable $class_name to the anonymous function. Remember that autoloading of classes is often being done in the base class or sometimes called base controller class.
Secondly, here is a more sophisticated version that uses a function name to autoload the classes. This is the preferred version if you're developing large-scale applications.
spl_autoload_register() allows you to register multiple functions (or static methods ['myAutoloader' in this case] from your own autoload class) that PHP will put into a stack/queue and call sequentially when PHP sees an unknown class being referenced or instantiated.
In other words, PHP (or SPL) will call a function name that has been registered in the spl_autoload_register() and tries to load and include that class name inside that function. For example:
<?php
spl_autoload_register('myAutoloader');
?>
That code above will register a function named 'myAutoloader' which is illustrated below:
So if you defined an autoload function named 'myAutoloader' [as shown below] and registered it in spl_autoload_register() [as shown above], PHP will call that function name whenever it sees an unknown class being referenced or instantiated. The two keywords that we're interested in are: referenced and instantiated. For example, when you reference or create an instance of a class, like so:
<?php
// here, we referenced MyClass and if PHP doesn't recorgnize this class it will
// call 'myAutoloader'
MyClass::$some_static_property_variable = $this;
// here, we create an instance of MyClass and if PHP doesn't recorgnize this class
// it will call 'myAutoloader'
$myClass = new MyClass();
Or if classes are namespaced like these:
// here, we referenced the namespaced MyClass and if PHP doesn't recorgnize this class
// it will call 'myAutoloader'
app\base\MyClass::$some_static_property_variable = $this;
// here, we created an instance of the namespaced MyClass and if PHP doesn't recorgnize
// this class it will call 'myAutoloader'
$myClass = new app\core\model\MyClass();
// likewise, we can reference the namespaced app\core\OtherClass via the 'extends' clause
// and if PHP doesn't recorgnize 'app\core\OtherClass' class it will call 'myAutoloader'
// using the 'use' clause that you include it at the top of your class!
// make sure to namespace your classes and use the 'use' clause to include it!
use app\core\OtherClass;
class MyClass extends app\core\OtherClass
?>
As you can see, whenever you instantiate a class or reference a class -- including via an extends clause, if PHP does not recorgnize the class (i.e., "MyClass" or app\core\OtherClass hasn't been instantiated and/or included) -- PHP will call a function named myAutoloader() and tries to include that class file inside that function named myAutoloader():
<?php
// PHP calls this function passing a class name as a string like so:
// myAutoloader("MyClass")
// or if a class contains a namespace it also does it accordingly:
// myAutoloader("app\core\MyClass")
function myAutoloader($className)
{
// you might want to create a folder named class and put all of your
// classes in it:
// $path = '/class/'
// this folder named class should be in the same directory as the
// entry point of your application.
// here, all classes should be inside directory /class/
$path = '/path/to/class/';
// if a class ($className) uses a namespace, the namespace will be
// converted into the directory structure, for example:
// namespace app\core\model\MyClass becomes app/core/model/MyClass
// the following statement replaces the characters "\" in the string
// $className with "/" to convert a namespace into a directory structure
// also, all class name/file (pair) need to be named the same
$filename = $path . str_replace("\\", '/', $className) . ".php";
if (file_exists($filename))
{
include($filename);
if (class_exists($className))
{
// we could do like this as well: return; // exit the function!
return TRUE; // exit the function!
}
}
return FALSE; // exit the function!
}
?>
In the example above, "MyClass" is the name of the class that you are trying to reference or instantiate, PHP passes this class name as a string to spl_autoload_register(), which allows you to pick up the variable ($className) and use it to "include" the appropriate class/file [as shown above].
As a result, you don't specifically need to include that class via an include/require statement. Just simply reference or instantiate the class you want to reference/instantiate like in the examples above, and since you registered a function (via spl_autoload_register()) of your own, PHP will call that function and it will figure out where all your classes are located.
Notice that this custom function is a function that you have to create and then register it in the SPL and if PHP doesn't recorgnize 'app\core\OtherClass' class it will call 'myAutoloader' autoloader.
Remember that autoloading of classes is often being done in the application's base class, sometimes called controller base class in an MVC pattern talk.
To register your custom auto load function, you typically put spl_autoload_register() statements in your main base helper class and call that class from inside the starting script file. For example:
File: '/myfirstproject/package/application.php'.
<?php
/**
* Application is the base helper class serving base class common functionalities.
*
* Notice that there is no namespace for this class Application because it doesn't
* need one!
*
* Remember that not all classes require a namespace and this one is an example
* of that!
*
* However, pay special attention to the 'use' clause as it allows class 'Application'
* to extend from parent class 'Example'
*
* Now in class Example, you need to namespace it so that class 'Application' can
* extend it by using the 'use' clause. For example, at the top of class Example:
*
* namespace path\to;
*
* with 'path' being a folder named 'path' and 'to' also being
* a sub-folder named 'to'. Of course, you can name any name you wish!
*
* Now when PHP sees class 'Application', it should recorgnize it because
* the starting script that uses this class will include it!
*
* Now, since class Application extends Example, it will use that parent class by
* referring to the 'use' clause, and in effect, SPL calls the function
* myAutoloader() as well and passing the string 'Example' to it as well!
*
* So the key to a good programming practice is to use namespace on your classes!
*
* Pay special attention also that, as stated earlier, you can register your autoloader
* anywhere (as the below shows)
*/
use path\to\Example;
class Application extends Example
{
/**
* As you can see, the class Application is empty! No content, whatsoever!
*
* This is because class Application extends from class Example and therefore
* it gets all of its functionalities from parent base class Example.
*
* Of course, if you need more functionalities that parent base class Example
* didn't provide, you can add them here as well! Nothing stops you from doing so!
*
* However, keep this class to an absolute minimum and clean and empty if possible!
*/
}
// PHP automatically registers the custom 'myAutoloader' function of
// the class 'Application'
// remember that class 'Application' extends from parent base class Example,
// and therefore, function myAutoloader is in parent class Example
spl_autoload_register('Application', 'myAutoloader');
/**
* As stated earlier, you can register your autoloader anywhere including in the same
* file.
*
* Notice that the autoloader is registered in the same class file as class Application,
* but outside of the class definition because we want to register the same class
* Application, so therefore, it has to be outside of the class Application definition.
*
* So from here, your starting script file index.php has to call/include this
* class Application, for example:
*
* require __DIR__ . '/path/to/application.php';
*/
?>
In the starting script file, typically in the index.php, you do it like the following.
Also, you might want to create a folder named class and put all of your classes in it. This folder named class should be in the same directory as the entry point of your application. In this case, inside the main project folder called /myfirstproject/. For example: /myfirstproject/class/:
File: '/myfirstproject/index.php'.
<?php
/**
* The main index.php starting script file
*
* Notice that there is no need to use the 'use' clause in the starting
* script file: index.php
*
* You do it the old fashion way using:
*
* require(), require_one(), include(), include_one()
*/
// loads the helper class: '/myfirstproject/package/application.php'
// __DIR__ points to the root directory: /myfirstproject/ or whatever you name it!
require __DIR__ . '/package/application.php';
// of course, there should be other classes/code to load as well!
$app = new Application();
// notice that the call to init() is actually calling Example's
// init() because class Application extends from class Example
$app->init();
?>
Assuming Example is an application's base class, here is how you would implement your own custom auto load function:
<?php
/**
* Example is the base class serving common functionalities.
*
* In my other tutorial called "advanced pattern programming: MVC,
* this class 'Example' is equivalent to base class Base()
*
* the "extends ParentClass" is a fake class! So either you omit it or
* implement it accordingly according to your parent class logic!
* for beginners, I recommend you to just remove it entirely!
*
* Notice the namespace of the class Example.
* Notice the use of the 'use' clause as well!
*/
namespace path\to;
use path\to\ParentClass;
// notice that you could namespace the class Route as well and
// use that namespace here!
// use path\to\route;
class Example extends ParentClass
{
// this init() is to call class route's init()
public function init()
{
// notice that you could namespace the class Route as well!
// I'm being very lazy here and forget to namespace it!
// __DIR__ points to the root directory:
// /myfirstproject/ or whatever you name it!
require __DIR__ . '/route/route.php';
$route = new route();
// the following code executes method init() of class route
// see my other tutorial called "advanced pattern programming: MVC
$route->init();
}
// PHP automatically calls this function along with passing in
// a class name as a string
public function myAutoloader($className)
{
// you could put classes in different folders for modularity purpose, for example,
// the following $root code is for non-namespaced classes only, i.e., MyClass, Person, etc.
// actually, you can even put both namespaced and non-namespaced classes in these
// folders mixing them together and it will load them accordingly
// for namespaced classes it is automatically converted into its
// own directory stucture without you having to specify it explicitly
// for non-namespaced classes it will also load them "AS IS" as specified in
// the following in the $root code below!
// for example, the following code is mainly for non-namespace classes,
// however, you can put namespaced classes in the following folders as well:
$root = [
$_SERVER['DOCUMENT_ROOT'] . DIRECTORY_SEPARATOR . 'resource/',
$_SERVER['DOCUMENT_ROOT'] . DIRECTORY_SEPARATOR . 'component/',
$_SERVER['DOCUMENT_ROOT'] . DIRECTORY_SEPARATOR . 'module/',
$_SERVER['DOCUMENT_ROOT'] . DIRECTORY_SEPARATOR . 'model/',
$_SERVER['DOCUMENT_ROOT'] . DIRECTORY_SEPARATOR . 'view/',
$_SERVER['DOCUMENT_ROOT'] . DIRECTORY_SEPARATOR . 'controller/',
$_SERVER['DOCUMENT_ROOT'] . DIRECTORY_SEPARATOR . 'helper/',
$_SERVER['DOCUMENT_ROOT'] . DIRECTORY_SEPARATOR . 'cart/',
$_SERVER['DOCUMENT_ROOT'] . DIRECTORY_SEPARATOR . 'mailer/',
$_SERVER['DOCUMENT_ROOT'] . DIRECTORY_SEPARATOR . 'vendor/',
$_SERVER['DOCUMENT_ROOT'] . DIRECTORY_SEPARATOR . 'miscellaneous/'
];
// as stated above, you can put both namespaced and non-namespaced classes
// in the above folders, mixing them together and it will load them accordingly
// however, for namespaced classes, you have to namespace them accordingly according
// to the folder levels. for example, for $_SERVER['DOCUMENT_ROOT'] . DIRECTORY_SEPARATOR . 'resource/',
// it is: namespace path\to\resource;
// with path\to\ being the $_SERVER['DOCUMENT_ROOT'] . DIRECTORY_SEPARATOR
// the trick is to specify the exact path to resource directory structure without using
// the global variable $_SERVER['DOCUMENT_ROOT'] . DIRECTORY_SEPARATOR
// now preserve the original class name before turning it into
// a directory structure
$class = $className;
/**
* first, we need to test to see if there is a namespace in variable
* $className, i.e., \core\model\MyClass
*
* if there is a namespace in variable $className, then we can go ahead
* and do the conversion and trimming
*
* if not, in the "else" clause, we use the class name contains in
* variable $className "AS IS" for example: MyClass
*
* second, the statement below converts a namespace into a directory structure.
* remember that SPL passes a raw namespace in its entire format and so we
* need to convert that raw namespace into a proper directory structure so
* that it can find where the files are located.
*
* $className with "\" to convert a namespace into a directory structure.
*
* for example, a namespace like this: 'path\to' will be converted to 'path/to'
*
* third, trim the left "/" resulted from converting
* namespace to a directory structure, for example:
* /core/model/MyClass becomes core/model/MyClass.
*/
// if there is a namespace in variable $className, i.e., \core\model\MyClass
if (strpos($className, "\\") !== false)
{
// we have a namespace class
$str = ltrim(str_replace("\\", DIRECTORY_SEPARATOR, $className), '/');
// namespaced classes are automatically converted into
// their own directory stucture without you having to specify them explicitly
// use the newly created directory structure to form a file path
$file = $str . '.php';
if (file_exists($file))
{
include($file);
// after the include statement, we can just exit the loop and the function,
// we don't want the loop to go on!
// we could do like this right here:
// return;
// we don't even need the following 'if' condition!
// well, maybe we do!
// it's up to your preference!
// either way it will work!
if (class_exists($file)) // core/model/MyClass
{
// we could do like this as well:
// return; // exit the loop and the function, we don't want the loop to go on!
return TRUE; // exit the loop and the function, we don't want the loop to go on!
} // end class_exists
} // end file_exists
} // end if namespace
else
{
// no namespace class
foreach ($root as $path)
{
// you could put classes in different folders for modularity purpose
// like the illustration in $root above!
// this is for non-namespaced classes only, i.e., MyClass, Person, etc.
$file = $path . $className . '.php';
// for namespaced classes only, i.e., core/model/MyClass, etc., the "if" statement is false
// actually, for all namespaced classes, they won't even come here at all
if (file_exists($file))
{
include($file);
// after the include statement, we can just exit the loop and the function,
// we don't want the loop to go on!
// we could do like this right here:
// return;
// we don't even need the following 'if' condition!
// well, maybe we do!
// it's up to your preference!
// either way it will work!
if (class_exists($file)) // MyClass
{
// we could do like this as well:
// return; // exit the loop and the function, we don't want the loop to go on!
return TRUE; // exit the loop and the function, we don't want the loop to go on!
} // end class_exists
} // end file_exists
} // end foreach()
return FALSE; // exit the function after exhausting the loop without any luck!
} // end "else" if (strpos($className, '\\') !== false)
} // end myAutoloader()
} // end class Example
?>
In the above base class Example, if somewhere in your application [most likely in the controller], you reference or create an instance of any class, like so:
<?php
// here, we referenced MyClass and if PHP doesn't recorgnize this class it will
// call 'myAutoloader'
MyClass::$some_static_property_variable = $this;
// here, we create an instance of MyClass() and if PHP doesn't recorgnize this class
// it will call 'myAutoloader'
$myClass = new MyClass();
?>
PHP will trigger a call to the function myAutoloader($className) above passing along the class name MyClass as a string to the function. As a result, that class gets included and instantiated.
The benefit of using spl_autoload_register() is that -- unlike PHP's __autoload() (which is deprecated as of PHP 7.2.0) -- you don't need to implement an autoload function in every file that you create or use the include, include_once, require, or require_once at the top of every class or at anywhere in the class.
<?php
/**
* 'Autoloader', 'Helper', 'Database' are class names.
* Notice that you can place autoloaders in the same class as well:
* 'ClassLoader', 'LibraryLoader'
*
* In my other tutorial called "advanced pattern programming: MVC,
* this class 'Example' is equivalent to base class Base()
*
* the "extends fromParentClass" is a fake class! So either you omit it
* or implement it accordingly according to your parent class logic!
* for beginners, I recommend you to just remove it entirely!
*/
namespace path\to;
use path\to\fromParentClass;
class Example extends fromParentClass
{
// register classes and their functions
public function __construct()
{
// Load a class: 'Autoloader' is the class name,
// 'ClassLoader' is the name of a function
spl_autoload_register('Autoloader::ClassLoader');
// Load a library: 'LibraryLoader' is the name of a function
spl_autoload_register('Autoloader::LibraryLoader');
// Load a helper class: 'Helper' is the name of the class
spl_autoload_register('Helper::HelperLoader');
// Load a database: 'DatabaseLoader' <== name of a function
spl_autoload_register('Database::DatabaseLoader');
}
}
?>
Here is the implementation of the class Autoloader:
<?php
/**
* Autoloader is the class libraries.
*
* the "extends fromOtherParentClass" is a fake class! So either you omit
* it or implement it accordingly according to your parent class logic!
* for beginners, I recommend you to just remove it entirely!
*/
namespace path\to;
use path\to\fromOtherParentClass;
class Autoloader extends fromOtherParentClass
{
// PHP automatically calls this function along with passing in
// a class name as a string
public function ClassLoader($className)
{
// so here, all classes should be in directory /class/
// make sure to namespace them accordingly and "use" them accordingly
// see the earlier illustration in $root above for more guiden!
$path = '/path/to/class/';
/**
* first, we need to test to see if there is a namespace in variable
* $className, i.e., \core\model\MyClass
*
* if there is a namespace in variable $className, then we can go ahead
* and do the conversion and trimming
*
* if not, in the "else" clause we use the class name contains in
* variable $className "AS IS" for example: MyClass
*
* second, the statement below converts a namespace into a directory structure.
* remember that SPL passes a raw namespace in its entire format and so we
* need to convert that raw namespace into a proper directory structure so
* that it can find where the files are located.
*
* $className with "\" to convert a namespace into a directory structure.
*
* for example, a namespace like this: 'path\to' will be converted to 'path/to'
*
* third, trim the left "/" resulted from converting
* namespace to a directory structure, for example:
* /core/model/MyClass becomes core/model/MyClass.
*/
// if there is a namespace in variable $className, i.e., \core\model\MyClass
if (strpos($className, "\\") !== false)
{
// we have a namespace class
$str = ltrim(str_replace("\\", DIRECTORY_SEPARATOR, $className), '/');
// use the newly created directory structure to form a file path
$file = $str . '.php';
if (file_exists($file))
{
include($file);
// after the include statement, we can just exit the loop and the function,
// we don't want the loop to go on!
// we could do like this right here:
// return;
// we don't even need the following 'if' condition!
// well, maybe we do!
// it's up to your preference!
// either way it will work!
if (class_exists($file)) // core/model/MyClass
{
// we could do like this as well:
// return; // exit the loop and the function, we don't want the loop to go on!
return TRUE; // exit the loop and the function, we don't want the loop to go on!
} // end class_exists
} // end file_exists
} // end if namespace
else
{
// no namespace class
// you could put classes in different folders for modularity
// like the illustration in $root directory example earlier!
// this is for non-namespaced classes only, i.e., MyClass, Person, etc.
$file = $path . $className . '.php';
if (file_exists($file))
{
include($file);
// after the include statement, we can just exit the loop and the function,
// we don't want the loop to go on!
// we could do like this right here:
// return;
// we don't even need the following 'if' condition!
// well, maybe we do!
// it's up to your preference!
// either way it will work!
if (class_exists($file)) // MyClass
{
// we could do like this as well:
// return; // exit the loop and the function, we don't want the loop to go on!
return TRUE; // exit the loop and the function, we don't want the loop to go on!
} // end class_exists
} // end file_exists
} // end "else" if (strpos($className, '\\') !== false)
return FALSE; // exit the function!
} // end function ClassLoader()
}
?>
The other classes are implemented in the same fashion. Self-explanatory.
More Examples
Let's see some more examples to help you get the right idea and heading in the right direction.
In the starting script file, typically in the index.php, is where you typically register your SPL autoload. For example:
File: '/mysecondproject/index.php'.
<?php
/**
* The main index.php starting script file
*/
// notice that __DIR__ points to the root directory or
// 'mysecondproject'
// loads the auto load class from directory /class/ or
// from wherever you put it!
require __DIR__ . '/class/autoloadclass.php';
// of course, there should be other classes/code to load as well!
// but for this example, loading Base() class is all we need!
// I could have namespace the class Base and use it here: use path\to\Base;
require __DIR__ . '/base/base.php';
// notice that we can register the SPL anywhere including
// in the index.php starting script file
// the first parameter is the class that contains the autoload()
// the second parameter is the actual autoload function
/**
* Note that spl_autoload_register() will look for class AutoloadClass in the same
* directory as it is being registered, which is in this starting script file: index.php.
*
* So make sure that you put class AutoloadClass at the same level in directory as
* this starting script file: index.php.
*/
spl_autoload_register('AutoloadClass', 'autoload');
// of course, there should be other code logic as well such as
// a call to [start()] to kickstart your application!
// but for this example, we'll call to init() of class Base()
// see my other tutorial called "advanced pattern programming: MVC"
$base = new Base();
// the call to init() will kickstart the whole application
$base->init();
// that is it! very simple!
?>
That is it for the starting script. Now we can just go ahead and write an autoload class containing its autoload function. For example:
File: '/class/autoloadclass.php'.
<?php
/**
* AutoloadClass definition.
*
* No need a namespace for class AutoloadClass!
*
* Make sure that you put this class AutoloadClass at the same level in directory as
* your starting script file: index.php.
*/
class AutoloadClass
{
// PHP automatically calls this function along with passing in a
// class name as a string
public function autoload($className)
{
// so here, all classes should be in directory /class/
$path = '/path/to/class/';
/**
* first, we need to test to see if there is a namespace in variable
* $className, i.e., \core\model\MyClass
*
* if there is a namespace in variable $className, then we can go ahead
* and do the conversion and trimming
*
* if not, in the "else" clause we use the class name contains in
* variable $className "AS IS" for example: MyClass
*
* second, the statement below converts a namespace into a directory structure.
* remember that SPL passes a raw namespace in its entire format and so we
* need to convert that raw namespace into a proper directory structure so
* that it can find where the files are located.
*
* $className with "\" to convert a namespace into a directory structure.
*
* for example, a namespace like this: 'path\to' will be converted to 'path/to'
*
* third, trim the left "/" resulted from converting
* namespace to a directory structure, for example:
* /core/model/MyClass becomes core/model/MyClass.
*/
// if there is a namespace in variable $className, i.e., \core\model\MyClass
if (strpos($className, "\\") !== false)
{
// we have a namespace class
$str = ltrim(str_replace("\\", DIRECTORY_SEPARATOR, $className), '/');
// use the newly created directory structure to form a file path
$file = $str . '.php';
if (file_exists($file))
{
include($file);
// after the include statement, we can just exit the loop and the function,
// we don't want the loop to go on!
// we could do like this right here:
// return;
// we don't even need the following 'if' condition!
// well, maybe we do!
// it's up to your preference!
// either way it will work!
if (class_exists($file)) // core/model/MyClass
{
// we could do like this as well:
// return; // exit the loop and the function, we don't want the loop to go on!
return TRUE; // exit the loop and the function, we don't want the loop to go on!
} // end class_exists
} // end file_exists
} // end if namespace
else
{
// no namespace class
// you could put classes in different folders for modularity
// like the illustration in $root directory example earlier!
// this is for non-namespaced classes only, i.e., MyClass, Person, etc.
$file = $path . $className . '.php';
if (file_exists($file))
{
include($file);
// after the include statement, we can just exit the loop and the function,
// we don't want the loop to go on!
// we could do like this right here:
// return;
// we don't even need the following 'if' condition!
// well, maybe we do!
// it's up to your preference!
// either way it will work!
if (class_exists($file)) // MyClass
{
// we could do like this as well:
// return; // exit the loop and the function, we don't want the loop to go on!
return TRUE; // exit the loop and the function, we don't want the loop to go on!
} // end class_exists
} // end file_exists
} // end "else" if (strpos($className, '\\') !== false)
return FALSE; // exit the function!
} // end function autoload()
}
?>
More Examples
Let's see some more examples to help you get the right idea and heading in the right direction.
In the starting script file, typically in the index.php, is where you typically register your SPL autoload. For example:
File: '/mythirdproject/index.php'.
<?php
/**
* The main index.php starting script file
*/
// notice that __DIR__ points to the root directory or
// 'mythirdproject'
// load the helper class from the root directory /mythirdproject/
require __DIR__ . '/application.php';
// of course, there should be other classes/code to load as well!
// but for this example, loading Application() class is all we need!
// include our helper class: Application() from the 'mythirdproject' folder
// notice that we can register the SPL anywhere including
// in this index.php starting script file as well as in a
// helper class Application as you'll see later in another example.
// sort of an extension to the main base class similar to class Base()
/**
* Note that spl_autoload_register() will look for class AutoloadClass in the same
* directory as it is being registered, which is in this starting script file: index.php.
*
* So make sure that you put class AutoloadClass at the same level in directory as
* this starting script file: index.php.
*/
// the first parameter is the class that contains the autoload()
// the second parameter is the actual autoload function
spl_autoload_register('AutoloadClass', 'autoload');
// of course, there should be other code logic as well such as
// a call to [start()] to kickstart your application!
// but for this example, we'll call to start() of class Main()
// notice that the call to start() will refer to class Main's start()
// you'll have to create a function called start() in your class Main
// this start() is similar to function init() in class Base() in my
// other tutorial called "Introduction to Advanced Pattern: MVC"
$app = new Application();
// the call to start() will kickstart the whole application
$app->start();
// that is it! very simple!
?>
That is it for the starting script. Now we can just go ahead and write a helper class that helps our main application class Main to extend its functionalities further. For example:
File: '/mythirdproject/application.php'.
<?php
/**
* Make note of the require statement below. It's at the top of the file,
* outside of the class and not inside of the class.
*
* Although you can put it inside the class, but outside the class is the
* more preferrable place because it is available/visible in the entire file,
* not just inside the class.
*
* If you put it inside the class you would have to create an instance
* of the class in order for the require statement to take effect.
*
* So putting it at the top of the class and outside of the class is
* the most preferrable spot because it is available/visible in the entire
* file, not just inside the class.
*/
// include our base class: Main() from the 'mythirdproject' folder
// we could use the namespace instead of this: require __DIR__ . '/main.php';
/**
* Class Aplication definition.
* Aplication is a helper class serving common application functionalities
*/
use path\to\Main;
class Aplication extends Main
{
// As you can see for this example, this helper class is empty!
// It gets all of its functionalities from parent class 'Main'
// If you need more functionalities that parent class Main didn't provide,
// you can add them here in this helper class!
// But for this example, it is left empty and it is just fine because
// we don't need any more functionalities!
// That is it for the helper class!
// It is blank!
}
// notice that we can register the SPL anywhere including
// in the index.php starting script file as well as in here outside
// of a helper class Application base class.
// preferrably putting the SPL right here outside the class [as appose to
// inside this class definition or inside index.php starting file.]
// notice that it is "outside" of this helper class definition but in the same file!
// the first argument is the class name and the second is the function name!
// note also that function 'autoload' is in parent class Main
// right here "outside" of the helper class definition is the most preferrable spot
// and in the same file: '/mythirdproject/application.php'
// it is perfectly legal!
spl_autoload_register('Main', 'autoload');
?>
Now all you have to do is instantiating this helper class and you get all of the functionalities from the parent class without having to refer or instantiating the parent class Main. You should never have to do anything with the base parent class Main - you do all of your programming work in the child classes of Main, like this child class Application.
Also, you shouldn't have to have more than one child class of Main. Just create one child class of Main like child/helper class Application and you're good to go.
So in a sense, child class like Application acts like a main application class that handle all of your functionalities even though it is practically empty.
Keep this child class to a very minimum and clean (as you can see: it's empty) and provide all of the functionalities in the parent class.
As stated above, all you have to do is instantiating this helper/child class Application and you're good to go. You should never have to instantiating the base parent class Main at all - you do it in this child class Application.
Now here is our main application base class Main similar to Base class in my other tutorial called "Introduction to Advanced Pattern: MVC". For example:
File: '/mythirdproject/main.php'.
<?php
/**
* Class Main definition.
* Main is the base main class serving common application functionalities
*
* This class is similar to Base class in my other tutorial called
* "Introduction to Advanced Pattern: MVC"
*/
namespace path\to;
class Main
{
// As you can see, this is the base class for the whole application!
// It has all the functionalities required to build an application!
// If you need more functionalities than this base parent class provides,
// you can add them in the child helper class that extends from this class!
// See helper class Application earlier!
// For this example I won't provide all the functionalities required by a
// normal base class would! Only a few key points about kickstarting capabilities!
// A typical base class, sometimes called main base controller class in an MVC
// scheme of thing, it should contains the setter, getter, and autoload
// functions, at the very least!
// How you implement your main base controller class is up to you!
// But just remember that your main base controller class is suppose to
// contain and handle all of the application's functionalities!
// But here are some of the key ingridients that should be in the base class:
// the constructor
public function __construct();
{
// constructor code logic
}
// kickstart the ball rolling by grabbing the http request!
public start();
{
// start() code logic
// you should grab the HTTP REQUEST from getRequest() below and
// process its route/controller/action accordingly as well as
// dispatching those route/controller/action to their proper destination!
}
// the parameter is the class name passed in by PHP's SPL
public autoload($className);
{
// auto loading code logic
}
public set($param, $value);
{
// set() code logic
}
public get($param);
{
// get() code logic
}
public createController();
{
// createController() code logic
}
public getModel($param);
{
// getModel() code logic
}
public getAction($param);
{
// getAction() code logic
}
// process HTTP REQUEST
public getRequest($param);
{
// getRequest() code logic
// process the HTTP REQUEST code logic, such as parsing the url and
// return the values as an array to the caller!
}
}
?>
More Examples
Here is another example to help you get the right idea and heading in the right direction.
This is another autoload function that you can use SPL auto load functionality to call this function (autoloader()) using values of a configuration file path. For example:
File: '/myfourthproject/autoloader.php'.
<?php
/**
* An autoloader function
*
* This function is a little bit complex than the prior ones shown earlier!
*/
// $name is the class name passed in by SPL everytime SPL calls this function
public function autoloader($name)
{
// get all the possible paths to the file
// (that is preloaded with the file structure of the project)
// for init_get(), please see:
// https://www.php.net/manual/en/function.ini-get.php
$path = explode(":", ini_get('include_path'));
// for 'include_path', see your php.init file
// it goes something like this: include_path = ".;c:\php\includes"
// please see PHP's: set_include_path() as well!
// see ini_set('include_path', ini_get('include_path')
// loop through for each possible path to the file
foreach ($path as $tryThis)
{
// try each possible iteration of the file name and
// use the first one that comes up, for example:
// name.class.php
$exist = file_exists($tryThis . '/' . $name . '.class.php');
if ($exist)
{
include_once($name . '.class.php');
return; // exit the function
}
// if the above condition is false, it should come here!
// ok that didn't work, try the other way around
$exist = file_exists($tryThis . '/' . 'class.' . $name . '.php');
if ($exist)
{
include_once('class.' . $name . '.php');
return; // exit the function
}
// if the above condition is false also, it should come here!
//neither did that...let's try as an inc.php
$exist = file_exists($tryThis . '/' . $name . '.inc.php');
if ($exist)
{
include_once($name . '.inc.php');
return; // exit the function
}
}
// if all three of the above conditions are false, it should come here!
// can't find the class passed in by SPL ...
die("Class $name could not be found!");
}
?>
That is it!
Very simple to implement your own SPL auto load application.
For more see spl autoload. FYI: PHP's __autoload() is deprecated as of PHP 7.2.0 and its usage is discouraged.
What is the difference between namespace and __NAMESPACE__ ?
First of all, a namespace is a file directory conflict resolution methodology, resolving file directories to avoid naming conflicts. For example, there are lots of situations where you use libraries from third parties that have the same class names, the same file names, the same directory names, etc., as your class names, your file names, your directory names, respectively, and this will cause conflicts among the third party librabries and your own libraries.
For example, if I write an application library, say, a very huge and sophisticated MVC library and allow you to download and use my MVC library, there are bound to be some class names in my library that might have the same name as your own application and this will cause either my library to not working properly or it will cause your own application not to work properly because of the conflict between the two libraries.
To solve this problem, a namespace was invented.
Secondly, the difference between namespace and __NAMESPACE__ is that namespace is just a keyword used to declare the namespace while __NAMESPACE__ is just a constant of the namespace used to refer to the declared namespace.
I'm a little lazy; and therefore, I will refer you to these excellent tutorials on the Web:
namespace keyword and __NAMESPACE__ constant
Namespacing, use and group use declarations in PHP
There you have it! Go at it full bore!!
What is the difference between dirname(__FILE__) and __DIR__ ?
First of all, we'll leave realpath() to be discussed last.
Usage: include (dirname(__FILE__) . '/file.php');
Usage: include (__DIR__ . '/file.php');
Both cases achieve the same thing and their usages are identical! So there is no different between the two. You can use either of the two and you're good to go.
However, __DIR__ is faster and more efficient than dirname(__FILE__). So using __DIR__ rather than dirname(__FILE__) is strongly recommended.
Both __DIR__ and dirname(__FILE__) load the parent current (absolute) path.
So what exactly does it mean to load the parent current path? Answer: It just means the current directory!
Using the following as an illustration, suppose we have a root folder named 'project' that contains a main file named index.php. Inside the project folder we also have two direct children folders, one named inc and the other named web.
Directory project also has grandchildren/great grandchildren folders/files, or more specifically, directory project has three grandchildren folders named: model, view, and controller along with their files.
Directory project also has one great grandchild folder named: helper along with its file7.php and file8.php.
Now let's focus our attention mainly in the two direct children of directory project: inc and web. Inside the child folder inc we have two files: file1.php and file2.php. And likewise, inside the child folder web we also have two files: file3.php and file4.php.
Disregard the model, view, and controller for now.
<?php
project
|-- index.php
|
|-- inc
| +-- file1.php
| +-- file2.php
|
|-- web
| +-- file3.php
| +-- file4.php
|
|
| +-- model
| +-- file5.php
|
| +-- helper
| +-- file7.php
| +-- file8.php
|
| +-- view
| +-- file9.php
|
| +-- controller
| +-- file10.php
|
?>
To start, you'll need to find out what directory the current file is in, because this is the file we're concerned about. In other words, under what directory is your file residing in? Knowing what directory your file is in, you can look up the path of that file.
Using the above illustration as an example, index.php is in the parent directory named 'project'; while file1.php and file2.php both are in a parent directory named 'inc'; and file3.php and file4.php both are in a parent directory named 'web'.
So the current file directory in respect to 'index.php' is 'project' and that is the parent current (absolute) path of the file 'index.php':
Likewise, the current file directory in respect to 'file1.php' and 'file2.php' is 'inc'; the current file directory in respect to 'file3.php' and 'file4.php' is 'web'.
So 'project', 'inc', and 'web' are parent directories for their relevant children folders/files. So to load a parent current directory path means to load 'project/' if we're working inside index.php file. Likewise:
<?php
load 'project/inc/' if we're inside file1.php trying to use /file2.php., e.g.:
include (__DIR__ . '/file2.php');
Basically, __DIR__ loads file1.php's parent current directory which is 'project/inc/'.
file2.php is in the same directory as file1.php and no further reference is necessary.
So it becomes: include ('project/inc/file2.php')
Likewise, the same thing can be said about the remaining three cases:
load 'project/inc/' if we're working inside file2.php, e.g., include(__DIR__ . '/file1.php');
load 'project/web/' if we're working inside file3.php, e.g., include(__DIR__ . '/file4.php');
load 'project/web/' if we're working inside /file4.php, e.g., include(__DIR__ . '/file3.php');
?>
The thing that confuses people the most is that they throw in the word 'parent' in addition to the word 'current' when they really just mean the 'current' directory. Period! So to load a 'parent current' directory path can be said to load a 'current' directory path.
Now knowing that we can use either __DIR__ or dirname(__FILE__) to find the 'current' directory path. For example:
<?php
assuming a script that is at the same level as 'index.php' and trying to use 'index.php':
include (__DIR__ . '/index.php');
as you can see __DIR__ loads 'project/'
now assuming a script 'index.php' trying to use 'file7.php' or 'file8.php':
include (__DIR__ . '/web/model/helper/file7.php');
include (dirname(__FILE__) . '/web/model/helper/file7.php');
include (__DIR__ . '/web/model/helper/file8.php');
include (dirname(__FILE__) . '/web/model/helper/file8.php');
notice that __DIR__ and dirname(__FILE__) both loads project/ directory.
now assuming a script that is at the same level as 'file1.php' and trying to use 'file1.php'.
let's put it this way: assuming 'file1.php' is trying to use 'file2.php':
include (__DIR__ . '/file2.php');
include (dirname(__FILE__) . '/file2.php');
now assuming 'file2.php' is trying to use 'file1.php':
include (__DIR__ . '/file1.php');
include (dirname(__FILE__) . '/file1.php');
now all four cases __DIR__ and dirname(__FILE__) load 'project/inc/'
now assuming a script that is at the same level as 'file3.php' and trying to use 'file3.php':
include (__DIR__ . '/file3.php');
include (dirname(__FILE__) . '/file3.php');
both cases __DIR__ and dirname(__FILE__) load 'project/web/'
now assuming a script that is at the same level as 'file5.php' and trying to use 'file5.php':
include (__DIR__ . '/file5.php');
include (dirname(__FILE__) . '/file5.php');
both cases __DIR__ and dirname(__FILE__) load 'project/web/model/'
now assuming a script that is at the same level as 'file7.php' and trying to use
'file7.php' or 'file8.php'.
let's put it this way: assuming 'file7.php' is trying to use
'file8.php':
include (__DIR__ . '/file8.php');
include (dirname(__FILE__) . '/file8.php');
now assuming 'file8.php' is trying to use
'file7.php':
include (__DIR__ . '/file7.php');
include (dirname(__FILE__) . '/file7.php');
both cases __DIR__ and dirname(__FILE__) load 'project/web/model/helper/' because both
file7.php and file8.php are at the same level of directory and only __DIR__ and
dirname(__FILE__ are needed.
now assuming a script that is at the same level as 'file9.php' and trying to use
'file9.php'.
again, this is the same as the above cases where both files are at the same level and no
further up in directories are needed to reference:
include (__DIR__ . '/file9.php');
include (dirname(__FILE__) . '/file9.php');
both cases __DIR__ and dirname(__FILE__) load 'project/web/view/'
now assuming a script that is at the same level as 'file10.php' and trying to use
'file10.php':
include (__DIR__ . '/file10.php');
include (dirname(__FILE__) . '/file10.php');
both cases __DIR__ and dirname(__FILE__) load 'project/web/controller/'
?>
Now to reach out to other directories outside of current parent directory, you will have to get out (/../) of your own parent directory:
<?php
load 'project/web/' if we're working inside file1.php and want to use file3.php,
e.g., include (__DIR__ . '/../web/file3.php');
Here, we're inside file1.php trying to use file3.php. But file1.php and file3.php are
in their own seperate parent directory.
So file1.php has to get out of its own parent directory traversing backward one step or
one directory level up to be at the same level as file3.php's parent directory.
In other words, file1.php has to traverse backward to be at the same level as index.php,
inc, and web. So traversing one step backward (/../) is good enough to be at the same
level as index, inc, and web.
Traversing backward is denoted as /../ which is counted as one step backward or
one directory level up.
/../, /../../, and /../../../ are called symbolic links.
/./ (or one-dot) is called no symbolic link.
If you ever come across someone's code that looks something like this:
<a href="./index.html">Home</a>
or
<link href="./css/style.css" rel="stylesheet">
or
<script src="./project/js/jquery.js">
It means no symbolic link. It means/works the same thing as these:
<a href="index.html">Home</a>
or
<link href="css/style.css" rel="stylesheet">
or
<script src="project/js/jquery.js">
Going up two directory levels up: /../../
Going up three directory levels up: /../../../
Now once you're at the same level as 'web' you can go down one step to find file3.php.
But you need to tell the script where to traverse to, hence, the /web/ reference:
include (__DIR__ . '/../web/file3.php');
So in effect __DIR__ equals to 'project/inc/' because we're inside file1.php.
So __DIR__ basically points to the directory leading up to file1.php.
Now at this time we're at 'project/inc/'
But we want to go one step backward.
So in effect /../ takes one step backward to be at 'project'.
So in effect __DIR__ . '/../' equals to 'project'.
So right now we're at 'project'.
But we still need to go forward to find file3.php, so a reference to /web/ is required.
Hence, the /web/file3.php was included in the statement above.
So include (__DIR__ . '/../web/file3.php') becomes: include ('project/web/file3.php')
Now our mission is accomplished!
The remaining three cases can be illustrated in the same fashion:
load 'project/web/' if we're working inside file2.php and
want to use file4.php, e.g., include (__DIR__ . '/../web/file4.php');
load 'project/inc/' if we're working inside file3.php and
want to use file1.php, e.g., include (__DIR__ . '/../inc/file1.php');
load 'project/inc/' if we're working inside file4.php and
want to use file2.php, e.g., include (__DIR__ . '/../inc/file2.php');
?>
If we do an include "inc/file1.php" from index.php it will work. However, if we do an include "inc/file2.php" from inside file1.php to include file2.php, it won't work, because "inc/file1.php" is at the same directory level as "inc/file2.php". The latter was a trick to throw people off guard using "inc/".
Likewise, from the index.php perspective, include "inc/file2.php", will work.
__DIR__ fixes this, so from file1.php we can do this:
<?php
include (__DIR__ . "/file2.php");
?>
Like dirname(__FILE__), __DIR__ also loads the parent current (absolute) path relative to the current file being worked on. For example, in the example above, we're working on index.php and inside this index.php perspective that we're currently referring to as the current working directory.
So up to the current directory or the current working directory is where both dirname(__FILE__) and __DIR__ are specifically designed to handle the leading parent directory.
For example, inside file1.php, you don't have to specify 'project/inc/file2.php' to use file2.php. You can specify __DIR__ . 'file2.php' and __DIR__ will take care of the proper hierarchical levels of directory.
Likewise, inside file3.php, you don't have to specify 'project/web/file4.php' to use file4.php. You can specify __DIR__ . '/file4.php' and __DIR__ will take care of the proper hierarchical levels of directory.
So from the perspective of file1.php or file3.php, it retreats back to the parent's current directory and move down to find file2.php or file4.php, respectively. __DIR__ takes care of the proper hierarchical levels of directory up to the current working directory:
<?php
include (__DIR__ . '/file2.php');
include (__DIR__ . '/file4.php');
?>
Now, how do we include files file3.php and file4.php from file1.php or file2.php or include file1.php and file2.php from file3.php or file4.php?
__DIR__ fixes this, so from file1.php and file2.php we can do this:
<?php
include (__DIR__ . "/../web/file3.php");
include (__DIR__ . "/../web/file4.php");
?>
From file3.php and file4.php we can do this:
<?php
include (__DIR__ . "/../inc/file1.php");
include (__DIR__ . "/../inc/file2.php");
?>
As for dirname(__FILE__), it returns the directory of current included file -- the file that is being worked on currently in the current directory.
To get the directory of current included files you can use dirname(__FILE__).
For example, if a script called 'file2.php', which is in the sub-directory 'inc', wants to include the script 'file1.php', you can use:
<?php
dirname(__FILE__) . 'file1.php');
?>
Likewise, if a script called 'file4.php', which lay in the same directory as 'file3.php', wants to use the script 'file3.php', you can use:
<?php
dirname(__FILE__) . 'file3.php');
?>
Multiple Hierachical Directory Level
To work with multiple hierachical directory levels, maybe you can think of them in term of floor levels such as in a building where you have multiple floors and each floor has rooms--a hotel building comes to mind.
If you are in the third floor and your room is in the fifth floor, you would go up two floors and then once you get to the fifth floor, all you have to do is walk on the flat surface to find your room.
Now if you are in the eighth floor and your room is in the fifth floor, you would go down three floors and then once you get to the fifth floor, all you have to do is walk on the flat surface to find your room.
Now the same thing can be said about multiple directory levels where the current directory is in the third level and you want to find files in the fifth directory deep inside the hierachical directory levels.
Similarly, you would go up two levels using this notation /../../ to be at the same level as the file(s) that you want to find. Once you're at the same level as the file(s) all you have to do is go to get it at the same floor on the flat surface.
Now how about the multiple hierachical directory level of model, view, and controller?
What happens if file7.php or file8.php wants to use either file9.php or file10.php, or both?
Just by looking at the directory structure illustrated earlier, we can see that the grandparent directory of file7.php and file8.php is called 'model' and it is at the same directory level as view and controller--the two directory levels that we're trying to be at.
So now, all we have to do is go up two floors to be at the same level as the parent directory of file9.php and file10.php, or at the same level as view and controller, respectively. The two-floors up (/../../) puts us at the same level as view and controller.
And from there, we can just walk forward directly on the same flat level to the destination. For example:
This is from inside either file7.php or file8.php:
<?php
include (__DIR__ . '/../../view/file9.php');
include (__DIR__ . '/../../controller/file10.php');
include (dirname(__FILE__) . '/../../view/file9.php');
include (dirname(__FILE__) . '/../../controller/file10.php');
?>
Now, what happens if file7.php or file8.php wants to use either file2.php or file4.php, or both?
Again, they have to traverse backward three steps (this time) to be at the same level as the parent directory of file2.php and file4.php, or at the same level as inc and web, respectively. For example:
This is from inside either file7.php or file8.php:
<?php
include (__DIR__ . '/../../../inc/file2.php');
include (__DIR__ . '/../../../web/file4.php');
include (dirname(__FILE__) . '/../../../inc/file2.php');
include (dirname(__FILE__) . '/../../../web/file4.php');
?>
Now, what happens if file7.php or file8.php wants to use index.php?
I'll leave that as an exercise for you to do. This one could be a tricky one!
There you have it! Use __DIR__ instead of dirname(__FILE__) because it is faster and more efficient.
realpath()
Now let's see what realpath() is all about and how to use it.
realpath() is a function that returns canonicalized absolute pathname in the symbolic links /../../../.
realpath() expands all symbolic links and resolves references to /./, /../ and extra / characters in the input path and returns the canonicalized absolute pathname.
Now take a look at the directory structure example above (again) from the perspective of either file7.php or file8.php. In other words, we're talking from inside either file7.php or file8.php and traversing three levels up to find file9.php or file10.php, respectively: /../../../web/view/, use realpath(/../../../web/view/) to return the canonicalized absolute pathname /web/view/ or /../../../web/controller, use realpath(/../../../web/controller/) to return the canonicalized absolute pathname /web/controller/.
Again, from the perspective of either file7.php or file8.php to find file1.php and file2.php or file3.php and file4.php, respectively: use realpath(/../../../inc/) to return the canonicalized absolute pathname /inc/. Likewise, use realpath(/../../../web/) to return the canonicalized absolute pathname /web/.
Now realpath() on Windows: use realpath('/windows/system32') to return the canonicalized absolute pathname C:\WINDOWS\System32. Likewise, use realpath('C:\Program Files\\') to return the canonicalized absolute pathname C:\Program Files.
There you have it, using realpath() to return the canonicalized absolute pathname: /../../../.
What is the difference between get_class(), get_called_class(), and __CLASS__ ?
Usage: get_class($this);
Usage: get_called_class ($this);
Usage: __CLASS__;
All three cases achieve the same thing and their usages are identical! So there is no different between them. You can use any one of them and you're good to go.
get_class(), get_called_class(), and __CLASS__ functions all return the name of the actual class which was instantiated. Consider this:
<?php
class ParentClass
{
public function test()
{
echo 'get_called_class() returns: ' . get_called_class() . "\n"; // ChildClass
echo 'get_class() returns: ' . get_class() . "\n"; // ParentClass
echo 'get_class($this) returns: ' . get_class($this) . "\n"; // ChildClass
echo '__CLASS__ returns: ' . __CLASS__ . "\n"; // ParentClass
}
}
class ChildClass extends ParentClass
{
public function testChild()
{
// both return their own immediate class and not the parent class: ParentClass
echo 'get_class() testChild returns: ' . get_class() . "\n"; // ChildClass
echo '__CLASS__ testChild returns: ' . __CLASS__ . "\n"; // ChildClass
}
}
?>
Now let's create another class that uses the ParentClass and ChildClass:
<?php
class Stranger
{
// creating an instance of ChildClass
$instance = new ChildClass();
// here is a test question: what are the answers to this call to test() ?
$instance->test();
/**
* here, class ChildClass is calling ParentClass' method test()
* no, it's not class Stranger that is calling ParentClass' method test()
* in a test, a lot of people seem to think that class Stranger is the current class
* but in this context, it's not the case.
* class Stranger has nothing to do with referencing any of the context.
* it's ChildClass who is calling ParentClass' test() from inside class Stranger.
*
* so get_called_class() returns: ChildClass
* why?
* as the name implies: get the class that calls this method test()
* which is ChildClass who calls ParentClass' method test().
*
* likewise, get_class() as the name implies: get the name of the current class
* which is ParentClass because get_class() was being referenced inside the current
* class ParentClass.
*
* now what happens if get_class() is being referenced inside ChildClass?
* then it would return the current class which is ChildClass.
* if you look inside ChildClass you'll see two examples showing this same
* idea just described.
*
* okay, next we have get_class($this). what is this all about?
* well, passing $this to get_class() tell it to get the class containing in $this.
* in other words, we want to specify which class we want get_class() to return to us.
* in this case, we want get_class() to return a class name that $this is referring to.
*
* we know that $this is referring to the current class object and if you read my
* other tutorial about class verses object, you'll know that both mean the same thing,
* which is a class. so in a sense, $this is a class.
*
* knowing that, get_class($this) returns ChildClass because get_class() was being
* called by the current object $instance which is an object of class ChildClass.
*
* In a test, a lot of people seem to get this wrong quite often because they think
* the current class is the ParentClass and therefore they mark their answer as
* ParentClass.
*
* next, likewise, __CLASS__ returns the current class which is ParentClass because
* __CLASS__ is being referenced inside the current class ParentClass.
*
* well, so too, get_class($this) is being referenced inside the current
* class ParentClass but the difference is the variable $this which is referencing to
* the current 'object' and not the current 'class'.
*/
// here is another test question: what are the output? see the answers below!
$instance->testChild();
}
?>
Now we can see the effect of all six cases:
Output:
get_called_class() returns: ChildClass
get_class() returns: ParentClass
get_class($this) returns: ChildClass
__CLASS__ returns: ParentClass
get_class() testChild returns: ChildClass
__CLASS__ testChild returns: ChildClass
get_called_class() returns the class name that calls test(). In this case, ChildClass calls test().
get_class() returns the class name of itself. get_class() is typically being used inside its own class to return the class name of itself. In this case, it is being used inside test() to return its own class name: ParentClass.
get_class($this) is the same as get_class() above but it specifically specifies which class to return. In this case, it returns the class name of the current class being instantiated. The $this special variable refers to the current object being referenced, in this case, the current object being referenced or instantiated is ChildClass.
__CLASS__ is the same as get_class() and both return the class name of itself. __CLASS__ returns the current class name that __CLASS__ is being referenced in. As you can see in the test() and testChild(), both methods referenced __CLASS__ in its own class that __CLASS__ was residing in.
Like get_class(), __CLASS__ is typically being used inside its own class to return the class name of itself. In this case, it is being used inside test() and testChild() to return their own class name: ParentClass and ChildClass, respectively.
What is the difference between __METHOD__ and __FUNCTION__ ?
Both __METHOD__ and __FUNCTION__ are special constants (similar to __CLASS__).
__METHOD__ returns the name of the method along with the name of the class that __METHOD__ is being referenced in; while __FUNCTION__ returns only the name of the function that __FUNCTION__ is being referenced in. Consider this:
<?php
class MyClass
{
public function test1()
{
// will output the name of the method along with the name of the class that
// __METHOD__ is being referenced in
echo __METHOD__ . "\n"; // will output: MyClass::test1
}
public function test2()
{
// will output only the name of the function that __FUNCTION__ is being
// referenced in
echo __FUNCTION__ . "\n"; // will output: test2
}
}
?>
And then do this:
$obj = new MyClass();
$obj->test1();
will output ----> MyClass::test1
$obj->test2();
will output -----> test2
FYI: A class is the program you write (i.e., the MyClass class implementation above); while object (i.e., $obj) is the copy of the class or the clone of the class, most often being known as the instance of the class.
A class resides in ROM (permanent memory area) whereas object (i.e., $obj) resides in RAM (temporary memory area.)
In ROM, data is stored there permanently even when the computer is turned off. In a RAM memory area, on the other hand, data get stored temporarily while the program is running or while the computer is still turned on. When the computer is turned off, the RAM data (i.e., $obj) is completely erased and is no longer stored in the RAM.
Instances of a class can be useful only while the program is running or while the computer is turned on; and when the program is not running or when the computer is turned off, instances of a class are no longer useful to a program; and therefore, it is stored in a temporary memory area. Instances of a class can be created 'on the fly' at any time when needed by a program.
So there is no need to store instances of a class permanently in permanent memory spaces and wasting valuable memory spaces.
What is the difference between abstract and interface ?
First of all, it is strongly recommended that you skip the "preface" description outlined next and jump to the abstract and interface descriptions and examples first. After that, once you're finished, then come back and read this "preface" description. That way, you'll understand it much better than reading it right now.
Preface: Abstract verses Interface.
An interface is like a protocol. It doesn't designate the behavior of the object; it designates how your code tells that object to act. An interface would be like the English Language: defining an interface defines how your code communicates with any object implementing that interface. [Say what? If you understood that, you're a genius!]
An interface is always an agreement or a promise. When a class says, "I implement interface Y," it is saying, "I promise to have the same public methods that any object with interface Y has."
On the other hand, an abstract class is like a partially built class. It is much like a document with blanks to fill in. It might be using English, but that isn't as important as the fact that some of the document is already written.
An abstract class is the foundation for another object. When a class says, "I extend abstract class Y," it is saying, "I use some methods or properties already defined in this class named Y."
So, consider the following PHP:
<?php
// this is a child class X implementing an interface Y.
// this is saying that "X" agrees to speak language "Y" with your code.
class X implements Y
{
// code body!
// right here inside this code body that it is saying that
// "X" agrees to speak language "Y" with its "own" X actual code.
// "X" is implementing X's "own" actual code using "Y" language.
}
// this is a child class X extending an abstract parent class Y.
// this is saying that "X" is going to complete the partial class "Y".
class X extends Y
{
// code body!
// right here inside this code body that it is saying that
// "X" agrees to adopt some of the "Y" declarations (or language)
// and even uses Y's actual implementation in the case of static methods.
}
?>
As you can see, you might already noticed the difference: an interface uses the keyword: implements while an abstract uses the keyword: extends.
You would have your class implements a particular interface if you were distributing a class to be used by other people. The interface is an agreement to have a specific set of public methods for your class.
You would have your class extends an abstract class if you (or someone else) wrote a class that already had some methods written (or fully implemented inside parent class) that you want to use in your new (child) class or classes.
These two concepts, while easy to confuse, are specifically different and distinct. For all intents and purposes, if you're the only user of any of your classes, you don't need to implement interfaces. You would use abstracts.
[End "preface" description.]
An abstract, as the word implies, is a plain concept existing in thought or as an idea only and not having a physical or concrete existence. It exists in thought or idea only without any physical existence.
An abstract idea is an idea that haven't been put into concrete physical ready-made product yet. It exists in idea or thought only and haven't been made as a product yet.
Spriritual belief is an abstract idea because it exists in thought only and not having a concrete existence. Instinct is an abstract idea because it exists in thought only and not having a concrete existence.
Having a killer instinct is an abstract idea because it exists in thought only and not having a concrete existence.
Having a fantasy on something is an abstract idea because it exists in thought only and not having a concrete existence.
To sum it all up: All forms of idea are abstract ideas because it exists in thought only and not having a concrete existence.
In programming, an abstract class is a class that haven't been implemented yet. It exists only in the declaration of the class only. It hasn't been implemented in actual code yet.
In a class declaration, it contains the keyword abstract, followed by the keyword class, followed by the class' name.
It also contains the un-implemented body as well, for example: the class properties, followed by the class' methods (also known as functions).
That's all! No specific code is implemented in the class body itself and no specific code is implemented in the methods of the class either.
An abstract class is a class that can contain properties. Properties are optional. However, an abstract class must contain at least one abstract method.
An abstract method is a method that is declared in the abstract class, but have not been implemented in the actual code just yet [inside the abstract class itself]. So basically, an abstract class just declares its properties and methods without implementing any actual code.
The implementation of the actual code is left for the child classes to implement their own distinct seperate ways. The key phrase fragment is: 'own distinct seperate ways' because each implementation of the actual code is unique to each child class' implementation.
That's why it is called 'abstract' class and 'abstract' method because the class and the methods are very abstract without any implementation.
Let's examine and clarify this phrase a little bit: an 'abstract class just declares its properties and methods without implementing any actual code.'
Don't let that phrase fools you: an abstract class can declare its properties and methods AND implementing any actual code as well -- if need to!
Yes, you can declare an abstract class with its properties and methods and as well as fully-implementing any actual code as well! This is perfectly very legal!
However, generally an abstract class just declares its properties and methods without implementing any actual code and leave all the implementation to its child classes. That's the usual way of doing it; however, nothing stops you from implementing actual code in abstract classes.
As a matter of fact, a lot of programmers do just that: they create their abstract classes with their properties and methods fully-implemented with any actual code that they need to.
So nothing stops you from doing that either!!!
You typically declare static properties and methods of abstract class as you normally would and then, fully-implementing any actual code if you need to, including an abstract class's constructor . For example:
<?php
abstract class MyClass extends MyParentClass
{
/**
* declaring abstract class' constants and fully-implementing them as well
* by initializing their values. there is nothing wrong with that!
*/
const EVENT_COMMAND_START = 'command_start';
const STATE_BEGIN = 0;
/**
* declaring abstract class' properties without initialization with their
* initial values. this is the usual way of doing!
*/
protected static $conn;
public $databaseName;
public $username;
public $password;
public function __construct($databaseName, $username, $password)
{
/**
* this is not the secure way of doing - passing connection data in
* the constructor. you should do a better/secure way than this!
* besides, this is not about security - it's about abstract programming!
*/
$this->databaseName = $databaseName;
$this->username = $username;
$this->password = $password;
$this->getConnection();
// more constructor code!
}
static function getConnection()
{
self::$conn = new PDO("mysql:host=$host;dbname=$this->databaseName",
"$this->username", "$this->password");
}
static function test()
{
echo "test\n";
}
}
?>
As you can see, nothing stops you from implementing your abstract classes, if you need to. This is especially true with static methods because you can invoke them statically as shown in the below example in abstract class Foo. For example:
<?php
abstract class Foo
{
static function bar()
{
echo "test bar\n";
}
}
?>
Now you can reference the static method bar like this: Foo::bar(); // output: 'test bar'
Or for the abstract class MyClass shown earlier:
Likewise, you can reference the static method test like this: MyClass::test(); // output: 'test'
And for the static method getConnection like this: MyClass::getConnection(); // return: 'a PDO connection object'
You are allowed to do this only with static methods.
All non-static methods are better left to child classes to implement them.
All child classes that extend from the parent abstract class must implement all of the abstract methods that the parent class has. Let's see some examples.
An abstract class or method is defined with the abstract keyword. For example:
<?php
abstract class ParentClass
{
abstract public function someMethodName1()
abstract public function someMethodName2($name, $color);
abstract public function someMethodName3() : string;
abstract public function someMethodName4() : [];
abstract public function someMethodName5() : array();
}
?>
There you have it! An abstract class called ParentClass.
As you can see, there is no specific implementation of the class body itself, including the five methods, except static methods [e.g., you can declare your static methods among your non-static methods and at the same time fully-implementing them - nothing stops you from doing that].
It just declares them and leave them for the child classes to implement them in their own unique ways. Now any class or classes can inherit from this abstract parent class and implement the functionalities any way according to their objective.
Just remember that all child classes that extend from the abstract (parent) class [like ParentClass above] must implement all of the abstract methods contained in the parent class [like the five methods shown in the ParentClass above].
ParentClass above) cannot be instantiated. But child classes that extends from an abstract parent class can be instantiated.
This only means that you cannot instantiate and initialize an object from an abstract class declared like the one shown above. And as a result of the fact that you cannot instantiate and initialize an object from an abstract class, you cannot also call or reference any properties or methods of the abstract class.
In order to be able to call or reference any properties or methods of the abstract class, you have to do it by referring to its child classes. So in effect, you're just calling or referencing the properties and methods of the child classes.
However, invoking static method of abstract class is still feasible as you've seen in the classes Foo and ParentClass examples above. Make note: Only static methods of the abstract class can be called or referenced directly without having to derive a child class.
When inheriting from an abstract class, all methods marked as abstract in the parent's class declaration must be defined or implemented by the child. When inheriting from an abstract class, the child class method must be defined or implemented with the same name, and the same or a less restricted access modifier.
So, if the abstract method is defined as protected, the child class method must be defined as either protected or public, but not private. Also, the type and number of required arguments must be the same. However, the child classes may have optional arguments in addition.
For example:
<?php
abstract class ParentClass
{
abstract public function someMethodName($name, $color);
}
?>
Now we can define our child class with additional arguments. Additional arguments must go after the list of parent arguments. For example:
<?php
class ChildClass extends ParentClass
{
// our child class may define optional additional arguments not defined in the
// parent's signature
public function someMethodName($name, $color, $size, $make, $model);
}
?>
As you can see, when a child class is inherited from an abstract parent class, the abstract keyword goes away from the class head declaration and from the method heading as well. They're real class and real method now and no longer abstract.
So, when a child class is inherited from an abstract class, we have the following rules:
- The child class
methodmust be defined with the same name (i.e., someMethodName()) and it redeclares the parent abstracttmethod. In other words, it must be the same signature declaration as the parent method declaration (in the above case, someMethodName($name, $color). - The child class
methodmust be defined with the same or a less restricted access modifier (in the above case, public).So, if the abstract
methodis defined asprotected, the child classmethodmust be defined as eitherprotectedorpublic, but notprivate. - The number of required arguments must be the same (in the above case, $name, $color). However, the child class may have optional additional arguments (in the above case, $size, $make, $model).
Let's look at an example:
<?php
abstract class SpaceShip extends Event
{
private $radar = [];
private $fuel = int;
private $camera = array();
private $command = string;
abstract public function Start($start);
abstract public function goUp($up);
abstract public function goDown($down);
abstract public function goLeft($left);
abstract public function goRight($right);
abstract public function Speedometer($speed);
abstract public function Throttle($gear);
}
?>
Okay, we're building an abstract 'Spaceship' vehicle class that individuals or countries that want to go to Mars can use this abstract class to implement their own unique Mars spaceship vehicle. Any individual or country that implements this abstract class 'Spaceship' must implement all of the methods provided here.
Of course, they can add more functionalities in their own class as well, but the basic functionalities to go to Mars is provided here in this base abstract class 'Spaceship'.
Now in their own unique implementation, they can do a lot more to make their spaceship vehicle functional that can reach their destination safely, which is Mars.
Disclaimer: I'm not an expert in Mars spaceship vehicle or any spaceship vehicle, or any non-spaceship vehicle for that matter.
With that disclaimer taken care of, let's proceed to see how one would go about in implementing a Mars spaceship vehicle command interface software.
<?php
class Mars extends SpaceShip
{
const COMMAND_EVENT_START = 'command_start';
const COMMAND_EVENT_UP = 'command_up';
const COMMAND_EVENT_DOWN = 'command_down';
const COMMAND_EVENT_LEFT = 'command_left';
const COMMAND_EVENT_RIGHT = 'command_right';
const COMMAND_EVENT_SPEED = 'command_speed';
const COMMAND_EVENT_THROTTLE = 'command_throttle';
public $radar = [];
public $fuel = int;
public $camera = array();
public $command = string;
public $start = 0;
public $speed = 0;
public $up = 0;
public $down = 0;
public $left = 0;
public $right = 0;
public $gear = 0;
public function __construct($speed, $up, $down, $left, $right, $gear)
{
// initialize the spaceship object. in other words, ground the spaceship!
$this->start = component::start();
$this->speed = $speed;
$this->up = $up;
$this->down = $down;
$this->left = $left;
$this->right = $right;
$this->gear = $gear;
// attach an event to ignite the space ship vehicle
$this->event(self::COMMAND_EVENT_START, [$this, 'Start'], $this->start);
// attach an event to increase/decrease the speed of the space ship vehicle
$this->event(self::COMMAND_EVENT_SPEED, [$this, 'Speedometer'], $this->speed);
// attach an event to go up in altitude
$this->event(self::COMMAND_EVENT_UP, [$this, 'goUp'], $this->up);
// attach an event to go down in altitude
$this->event(self::COMMAND_EVENT_DOWN, [$this, 'goDown'], $this->down);
// attach an event to turn left
$this->event(self::COMMAND_EVENT_LEFT, [$this, 'goLeft'], $this->left);
// attach an event to turn right
$this->event(self::COMMAND_EVENT_RIGHT, [$this, 'goRight'], $this->right);
// attach an event to throttle the speed of the space ship vehicle
$this->event(self::COMMAND_EVENT_THROTTLE, [$this, 'Throttle'], $this->gear);
}
public function Start($event)
{
// this function is called by the IgnitionController as a result of the
// event mechanism.
// the event mechanism is implemented in the Event class that class SpaceShip
// extends from.
// likewise, the component class is implemented as a component in which
// the Event class extends from it.
// the Event class, in turn, implements the IEvent interface class.
// however, all of the work is being done in the Event class.
// right here where you fire up the ignition
component::start($event->data);
}
public function Speedometer($event)
{
// right here where you increase/decrease the speed of the vehicle
component::speed($event->data);
}
public function goUp($event)
{
// right here where you go up in altitude
component::up($event->data);
}
public function goDown($event)
{
// right here where you go down in altitude
component::down($event->data);
}
public function goLeft($event)
{
// right here where you tell the space ship vehicle to turn left
component::left($event->data);
}
public function goRight($event)
{
// right here where you tell the space ship vehicle to turn right
component::right($event->data);
}
public function Throttle($event)
{
// un-implemented);
}
}
?>
As you can see, it is very easy to do abstract programming and it is a very powerful methodology that allows you to modularize your program.
Of course, you can have additional properties and methods as well [in addition to the inherited methods].
Guess what? It's legal to leave the methods un-implemented [as shown in the Throttle() above] as long as they're declared and included in the child class' code body as shown above.
Of course, the Mars space ship class is going nowhere as it stands right now. But that is not the point of this tutorial. The goal of this tutorial is to teach you how to do abstract programming and the example shown thus far should help you understand how to do abstract programming.
Alright, we'll build one to go to the moon as well.
<?php
class Moon extends SpaceShip
{
const COMMAND_EVENT_UP = 'command_up';
const COMMAND_EVENT_DOWN = 'command_down';
const COMMAND_EVENT_LEFT = 'command_left';
const COMMAND_EVENT_RIGHT = 'command_right';
const COMMAND_EVENT_SPEED = 'command_speed';
const COMMAND_EVENT_THROTTLE = 'command_throttle';
public $radar = [];
public $fuel = int;
public $camera = array();
public $command = string;
public $speed = 0;
public $up = 0;
public $down = 0;
public $left = 0;
public $right = 0;
public $gear = 0;
public function __construct($speed, $up, $down, $left, $right, $gear)
{
// initialize the spaceship object. in other words, ground the spaceship!
$this->speed = $speed;
$this->up = $up;
$this->down = $down;
$this->left = $left;
$this->right = $right;
$this->gear = $gear;
// attach an event to ignite the space ship vehicle
$this->event(self::COMMAND_EVENT_START, [$this, 'Start'], $this->start);
// attach an event to increase/decrease the speed of the space ship vehicle
$this->event(self::COMMAND_EVENT_SPEED, [$this, 'Speedometer'], $this->speed);
// attach an event to go up in altitude
$this->event(self::COMMAND_EVENT_UP, [$this, 'goUp'], $this->up);
// attach an event to go down in altitude
$this->event(self::COMMAND_EVENT_DOWN, [$this, 'goDown'], $this->down);
// attach an event to turn left
$this->event(self::COMMAND_EVENT_LEFT, [$this, 'goLeft'], $this->left);
// attach an event to turn right
$this->event(self::COMMAND_EVENT_RIGHT, [$this, 'goRight'], $this->right);
// attach an event to throttle the speed of the space ship vehicle
$this->event(self::COMMAND_EVENT_THROTTLE, [$this, 'Throttle'], $this->gear);
}
public function Start($event)
{
// this function is called by the IgnitionController as a result of the
// event mechanism.
// the event mechanism is implemented in the Event class that class SpaceShip
// extends from.
// likewise, the component class is implemented as a component in which
// the Event class extends from it.
// the Event class, in turn, implements the IEvent interface class.
// however, all of the work is being done in the Event class.
// right here where you fire up the ignition
component::start($event->data);
}
public function Speedometer($event)
{
// right here where you increase/decrease the speed of the vehicle
component::speed($event->data);
}
public function goUp($event)
{
// right here where you go up in altitude
component::up($event->data);
}
public function goDown($event)
{
// right here where you go down in altitude
component::down($event->data);
}
public function goLeft($event)
{
// right here where you tell the space ship vehicle to turn left
component::left($event->data);
}
public function goRight($event)
{
// right here where you tell the space ship vehicle to turn right
component::right($event->data);
}
public function Throttle($event)
{
// right here where you tell the space ship vehicle to throttle the speed
component::gear($event->data);
}
}
?>
Okay, we'll build one to go to the Jupiter as well.
<?php
class Jupiter extends SpaceShip
{
const COMMAND_EVENT_UP = 'command_up';
const COMMAND_EVENT_DOWN = 'command_down';
const COMMAND_EVENT_LEFT = 'command_left';
const COMMAND_EVENT_RIGHT = 'command_right';
const COMMAND_EVENT_SPEED = 'command_speed';
const COMMAND_EVENT_THROTTLE = 'command_throttle';
public $radar = [];
public $fuel = int;
public $camera = array();
public $command = string;
public $speed = 0;
public $up = 0;
public $down = 0;
public $left = 0;
public $right = 0;
public $gear = 0;
public function __construct($speed, $up, $down, $left, $right, $gear)
{
// initialize the spaceship object. in other words, ground the spaceship!
$this->speed = $speed;
$this->up = $up;
$this->down = $down;
$this->left = $left;
$this->right = $right;
$this->gear = $gear;
// attach an event to ignite the space ship vehicle
$this->event(self::COMMAND_EVENT_START, [$this, 'Start'], $this->start);
// attach an event to increase/decrease the speed of the space ship vehicle
$this->event(self::COMMAND_EVENT_SPEED, [$this, 'Speedometer'], $this->speed);
// attach an event to go up in altitude
$this->event(self::COMMAND_EVENT_UP, [$this, 'goUp'], $this->up);
// attach an event to go down in altitude
$this->event(self::COMMAND_EVENT_DOWN, [$this, 'goDown'], $this->down);
// attach an event to turn left
$this->event(self::COMMAND_EVENT_LEFT, [$this, 'goLeft'], $this->left);
// attach an event to turn right
$this->event(self::COMMAND_EVENT_RIGHT, [$this, 'goRight'], $this->right);
// attach an event to throttle the speed of the space ship vehicle
$this->event(self::COMMAND_EVENT_THROTTLE, [$this, 'Throttle'], $this->gear);
}
public function Start($event)
{
// this function is called by the IgnitionController as a result of the
// event mechanism.
// the event mechanism is implemented in the Event class that class SpaceShip
// extends from.
// likewise, the component class is implemented as a component in which
// the Event class extends from it.
// the Event class, in turn, implements the IEvent interface class.
// however, all of the work is being done in the Event class.
// right here where you fire up the ignition
component::start($event->data);
}
public function Speedometer($event)
{
// right here where you increase/decrease the speed of the vehicle
component::speed($event->data);
}
public function goUp($event)
{
// right here where you go up in altitude
component::up($event->data);
}
public function goDown($event)
{
// right here where you go down in altitude
component::down($event->data);
}
public function goLeft($event)
{
// right here where you tell the space ship vehicle to turn left
component::left($event->data);
}
public function goRight($event)
{
// right here where you tell the space ship vehicle to turn right
component::right($event->data);
}
public function Throttle($event)
{
// right here where you tell the space ship vehicle to throttle the speed
component::gear($event->data);
}
}
?>
To launch the spaceship we need several controller classes [in an MVC scheme of thing].
Firstly, we need one controller for the ignition controller. This is very important because we have to fire up an ignition remotely if we have to in case the space ship is stalled in the middle of nowhere.
For takeoff we need another controller class as well. Again, we can tell the space ship to takeoff remotely if we need to.
So basically, we need one controller per task that the space ship is undertaking. For example, one controller to tell the space ship to speed up or decrease the speed; one controller to go up in altitude; another controller to go down in altitude; another controller to turn left; another controller to turn right, and so on and so forth.
For this tutorial, we won't implement all of the controller but only implementing a couple of controller, leaving the rest as exercises for you to do. Here is the ingition controller:
<?php
class IgnitionController extends Controller
{
public function ignitionEvent()
{
// first, create an instance of our Mars class
$launch = new Mars();
// to start the engine, press the "start" button on the spaceship dashboard or
// remotely in a dashboard remote device
// the effect of pressing the "start" button will propagate to the
// IgnitionController class and executes the ignitionEvent() right here!
// in here where we trigger the "command-start" event to fire up the ignition.
// In other words, trigger() executes the callback function Start() [of the class
// Mars], in which, Start() is attached to the event constant COMMAND_EVENT_START.
// if you look in the Mars' constructor you'll see some statements like this:
// $this->event(self::COMMAND_EVENT_START, [$this, 'Start'], $this->start).
// the 'Start' in [$this, 'Start'] is the callback function name
// that gets called when the below statement is triggered/executed.
// notice that method trigger() is implemented in the class Event.
// class Event is not included here!
// the Event class implements the IEvent interface class.
// however, all of the work is being done in the Event class.
// that's all there is! this one line kickstarts the ignition!
$launch->trigger(Mars::COMMAND_EVENT_START);
}
}
?>
Here is the SpeedController:
<?php
class SpeedController extends Controller
{
public function speedEvent()
{
// first, create an instance of our Mars class
$launch = new Mars();
// to increase/decrease the speed, press the "+" or "-" button next to
// "speed" label on the spaceship dashboard or remotely via a
// dashboard remote device.
// the effect of pressing the "+" or "-" button will propagate to this
// SpeedController class here and therefore executes this speedEvent() in here!
// similar to the ignitionEvent() above, this trigger() executes the callback
// function Speedometer() which is attached to the event constant:
// COMMAND_EVENT_SPEED.
// if you look in the Mars' constructor you'll see some statements like this:
// $this->event(self::COMMAND_EVENT_SPEED, [$this, 'Speedometer'], $this->speed).
// the 'Speedometer' in [$this, 'Speedometer'] is the callback function
// name that gets called when the below statement is triggered/executed.
// notice also that we can trigger the event using the event name 'command_speed'
$launch->trigger('command_speed');
}
}
?>
The rest of the controller are implemented in similar fashion.
Here are some more abstract concept code examples:
<?php
abstract class BankAccount
{
// hold the current balance for the account
public $balance = 0;
// increase the current balance for the account
abstract public function Debit($acctNo, $amount);
// decrease the current balance for the account
abstract public function Credit($acctNo, $amount);
// return the current balance for the account
abstract public function getBalance($acctNo);
}
?>
Here is the child class CheckingAccount code example:
<?php
protected class CheckingAccount extends BankAccount
{
// deposit/increase the current balance for the account
public function Debit($acctNo, $amount);
{
// first authenticate the account holder.
// you should do a better authentication here! you get the point!
if ($acctNo == '12345';
{
$this->balance = $this->balance + $amount;
}
else
{
echo "Account access denied!";
}
}
// withdraw/decrease the current balance for the account
public function Credit($acctNo, $amount);
{
// first authenticate the account holder.
// you should do a better authentication here! you get the point!
if ($acctNo == '12345';
{
$this->balance = $this->balance - $amount;
}
else
{
echo "Account access denied!";
}
}
// get the current balance for the account
public function getBalance($acctNo);
{
// first authenticate the account holder.
// you should do a better authentication here! you get the point!
if ($acctNo == '12345';
{
return $this->balance;
}
else
{
echo "Account access denied!";
}
}
} // end CheckingAccount
?>
Here is the child class SavingsAccount code example:
<?php
protected class SavingsAccount extends BankAccount
{
// deposit/increase the current balance for the account
public function Debit($acctNo, $amount);
{
// first authenticate the account holder.
// you should do a better authentication here! you get the point!
if ($acctNo == '12345';
{
$this->balance = $this->balance + $amount;
}
else
{
echo "Account access denied!";
}
}
// withdraw/decrease the current balance for the account
public function Credit($acctNo, $amount);
{
// first authenticate the account holder.
// you should do a better authentication here! you get the point!
if ($acctNo == '12345';
{
$this->balance = $this->balance - $amount;
}
else
{
echo "Account access denied!";
}
}
// get the current balance for the account
public function getBalance($acctNo);
{
// first authenticate the account holder.
// you should do a better authentication here! you get the point!
if ($acctNo == '12345';
{
return $this->balance;
}
else
{
echo "Account access denied!";
}
}
} // end SavingsAccount
?>
Here is the child class PreferredSavingsAccount code example:
<?php
protected class PreferredSavingsAccount extends BankAccount
{
// deposit/increase the current balance for the account
public function Debit($acctNo, $amount);
{
// first authenticate the account holder.
// you should do a better authentication here! you get the point!
if ($acctNo == '12345';
{
$this->balance = $this->balance + $amount;
}
else
{
echo "Account access denied!";
}
}
// withdraw/decrease the current balance for the account
public function Credit($acctNo, $amount);
{
// first authenticate the account holder.
// you should do a better authentication here! you get the point!
if ($acctNo == '12345';
{
$this->balance = $this->balance - $amount;
}
else
{
echo "Account access denied!";
}
}
// get the current balance for the account
public function getBalance($acctNo);
{
// first authenticate the account holder.
// you should do a better authentication here! you get the point!
if ($acctNo == '12345';
{
return $this->balance;
}
else
{
echo "Account access denied!";
}
}
} // end PreferredSavingsAccount
?>
Here is the child class CreditCardAccount code example:
<?php
protected class CreditCardAccount extends BankAccount
{
// deposit/increase the current balance for the account
public function Debit($acctNo, $amount);
{
// first authenticate the account holder.
// you should do a better authentication here! you get the point!
if ($acctNo == '12345';
{
$this->balance = $this->balance + $amount;
}
else
{
echo "Account access denied!";
}
}
// withdraw/decrease the current balance for the account
public function Credit($acctNo, $amount);
{
// first authenticate the account holder.
// you should do a better authentication here! you get the point!
if ($acctNo == '12345';
{
$this->balance = $this->balance - $amount;
}
else
{
echo "Account access denied!";
}
}
// get the current balance for the account
public function getBalance($acctNo);
{
// first authenticate the account holder.
// you should do a better authentication here! you get the point!
if ($acctNo == '12345';
{
return $this->balance;
}
else
{
echo "Account access denied!";
}
}
} // end CreditCardAccount
?>
Next up is an interface programming tutorial. An interface programming is similar to an abstract programming.
Advantages of PHP Interface
What is an Interface?
An interface is essentially a blueprint or a contract or a promise or a protocol or a guideline for what you can create.
For example, an interface declares five methods. These five methods are the blueprint or the contract or the promise or the protocol or the guideline for what child classes can create/implement based on these five methods. If a child class wants to implement this interface it must implement all five methods that the interface has.
The five methods act as a blueprint or a contract or a promise or a protocol or a guideline for what child classes can create/implement.
An interface allows unrelated child classes to implement the same set of methods (i.e., the five methods mentioned above), regardless of their positions in the class inheritance hierarchy. If you've read the Mars spaceship example earlier, there were seven methods declared for the abstract parent class SpaceShip.
We could just as well swap that abstract class with an interface instead, making that abstract class as an interface having seven methods being declared as the interface parent class ISpaceShip.
Now any class that wants to use the interface ISpaceShip must implement the seven methods declared in the interface parent class ISpaceShip.
Here is the interface parent class ISpaceShip:
<?php
// like a class, you can extend an interface from another interface using
// the 'extends' operator: interface ISpaceShip extends IEvent
interface ISpaceShip extends IEvent
{
// this means that child classes that implement interface ISpaceShip have to implement
// all of the methods declared in all of the parent interfaces: ISpaceShip, IEvent
// note that if you don't want to do any actual code implementation in any of the child
// methods, you can just list the (required interface) methods in the child class
// definition without their actual code implentation! just empty methods! it is legal!
// however, doing that defeats the purpose of child classes implementing parent interfaces!
// An interface consists of methods that contain no implementation.
// In other words, all methods of the interface are abstract methods just like
// the abstract class SpaceShip declared earlier.
// An interface can have its own constants, as the following shows:
const COMMAND_EVENT_UP = 'command_up';
const COMMAND_EVENT_DOWN = 'command_down';
const COMMAND_EVENT_LEFT = 'command_left';
const COMMAND_EVENT_RIGHT = 'command_right';
const COMMAND_EVENT_SPEED = 'command_speed';
const COMMAND_EVENT_THROTTLE = 'command_throttle';
// An interface cannot contain properties.
// The following four statements are illegal!
// You cannot have these. These have to be declared in the child classes.
// There you have it:
// if you want to know the difference between abstract and interface
// This is one of the differences between abstract and interface
private $radar = [];
private $fuel = int;
private $camera = array();
private $command = string;
// The following statements are legal!
public function Start($start);
public function goUp($up);
public function goDown($down);
public function goLeft($left);
public function goRight($right);
public function Speedometer($speed);
public function Throttle($gear);
}
?>
Unlike a class, which can extend only from one (other) class, an interface can extend from multiple interfaces, making the class that implements the interface as a multi-inheritance functionality class.
Here is an abbreviated listing of IEvent that extends two interfaces:
<?php
// an interface can extend from multiple interfaces using the 'extends' operator
// and seperating each interface with a comma.
interface IEvent extends IBase, IObject
{
// An interface cannot contain property/attribute declarations -- no properties!.
// An interface consists of method declarations that contain no implementation.
public function event($class, $name, $handler, $data, $append = true);
// An interface consists of method declarations that contain no implementation.
public function trigger($class, $name, $event = null);
}
// this means that child classes have to implement all of the methods
// declared in all of the parent interfaces: IEvent, IBase, IObject
/**
* Usage:
*
* notice that ISpaceShip extends IEvent and therefore class Event
* gets access to IEvent through parent class ISpaceShip
*
* class Event implements ISpaceShip
* {
* // code body
* }
*
* or you can implement IEvent directly as well:
*
* class Event implements IEvent
* {
* // code body
* }
*/
?>
A class can only extend from one (other) class; however, an interface can inherit multiple inheritances from other interfaces. In other words, interfaces allow classes to inherit multiple inheritances through the use of the interfaces.
A class can implement multiple interfaces, making the class as a multi-inheritance functionality class.
Here is an abbreviated listing of IComponent that extends three interfaces:
<?php
interface IComponent extends IBase, ICore, IObject
{
public function setComponent($name, $value);
public function getComponent($name);
}
?>
When we want to declare a new class that reuses properties and methods of an existing class, we say a subclass inherits from or extends a parent class. However, for the interfaces, we say a class implements an interface.
A class can only inherit from one parent class, but in addition, a class can implement one or more interfaces (in the case below: a class Moon extends the abstract SpaceShip parent class and as well as implements the ISpaceShip and IComponent interfaces). For example:
<?php
// notice that class Moon first extends from an abstract class SpaceShip which was
// defined earlier in the abstract programming section, and then, it implements
// two interfaces: ISpaceShip and IComponent
// yes, this is the order: you first extend the class and then implement the interfaces.
class Moon extends SpaceShip implements ISpaceShip, IComponent
{
const COMMAND_EVENT_UP = 'command_up';
const COMMAND_EVENT_DOWN = 'command_down';
const COMMAND_EVENT_LEFT = 'command_left';
const COMMAND_EVENT_RIGHT = 'command_right';
const COMMAND_EVENT_SPEED = 'command_speed';
const COMMAND_EVENT_THROTTLE = 'command_throttle';
public $radar = [];
public $fuel = int;
public $camera = array();
public $command = string;
public $speed = 0;
public $up = 0;
public $down = 0;
public $left = 0;
public $right = 0;
public $gear = 0;
public function __construct($speed, $up, $down, $left, $right, $gear)
{
// initialize the spaceship object. in other words, ground the spaceship!
$this->speed = $speed;
$this->up = $up;
$this->down = $down;
$this->left = $left;
$this->right = $right;
$this->gear = $gear;
// attach an event to ignite the space ship vehicle
$this->event(self::COMMAND_EVENT_START, [$this, 'Start'], $this->start);
// attach an event to increase/decrease the speed of the space ship vehicle
$this->event(self::COMMAND_EVENT_SPEED, [$this, 'Speedometer'], $this->speed);
// attach an event to go up in altitude
$this->event(self::COMMAND_EVENT_UP, [$this, 'goUp'], $this->up);
// attach an event to go down in altitude
$this->event(self::COMMAND_EVENT_DOWN, [$this, 'goDown'], $this->down);
// attach an event to turn left
$this->event(self::COMMAND_EVENT_LEFT, [$this, 'goLeft'], $this->left);
// attach an event to turn right
$this->event(self::COMMAND_EVENT_RIGHT, [$this, 'goRight'], $this->right);
// attach an event to throttle the speed of the space ship vehicle
$this->event(self::COMMAND_EVENT_THROTTLE, [$this, 'Throttle'], $this->gear);
}
public function Start($event)
{
// this function is called by the IgnitionController as a result of the
// event mechanism.
// the event mechanism is implemented in the Event class that class SpaceShip
// extends from.
// likewise, the component class is implemented as a component in which
// the Event class extends from it.
// right here where you fire up the ignition
component::start($event->data);
}
public function Speedometer($event)
{
// right here where you increase/decrease the speed of the vehicle
component::speed($event->data);
}
public function goUp($event)
{
// right here where you go up in altitude
component::up($event->data);
}
public function goDown($event)
{
// right here where you go down in altitude
component::down($event->data);
}
public function goLeft($event)
{
// right here where you tell the space ship vehicle to turn left
component::left($event->data);
}
public function goRight($event)
{
// right here where you tell the space ship vehicle to turn right
component::right($event->data);
}
public function Throttle($event)
{
// right here where you tell the space ship vehicle to throttle the speed
component::gear($event->data);
}
// these interface methods need to be implemented!!!
public function event($class, $name, $handler, $data, $append = true)
{
// this interface method needs to be implemented!!!
}
public function trigger($class, $name, $event = null)
{
// this interface method needs to be implemented!!!
}
public function setComponent($name, $value)
{
// this interface method needs to be implemented!!!
}
public function getComponent($name)
{
// this interface method needs to be implemented!!!
}
}
?>
Here are some more interface concept code examples:
<?php
interface IBankAccount
{
// increase the current balance for the account
abstract public function Debit($acctNo, $amount);
// decrease the current balance for the account
abstract public function Credit($acctNo, $amount);
// return the current balance for the account
abstract public function getBalance($acctNo);
}
?>
Here is the child class CheckingAccount code example:
<?php
protected class CheckingAccount implements IBankAccount
{
// an interface cannot contain properties, so they will have to
// be declared in the child classes like what we're doing right here!
// hold the current balance for the account
public $balance = 0;
// deposit/increase the current balance for the account
public function Debit($acctNo, $amount);
{
// first authenticate the account holder.
// you should do a better authentication here! you get the point!
if ($acctNo == '12345';
{
$this->balance = $this->balance + $amount;
}
else
{
echo "Account access denied!";
}
}
// withdraw/decrease the current balance for the account
public function Credit($acctNo, $amount);
{
// first authenticate the account holder.
// you should do a better authentication here! you get the point!
if ($acctNo == '12345';
{
$this->balance = $this->balance - $amount;
}
else
{
echo "Account access denied!";
}
}
// get the current balance for the account
public function getBalance($acctNo);
{
// first authenticate the account holder.
// you should do a better authentication here! you get the point!
if ($acctNo == '12345';
{
return $this->balance;
}
else
{
echo "Account access denied!";
}
}
} // end CheckingAccount
?>
Here is the child class SavingsAccount code example:
<?php
protected class SavingsAccount implements IBankAccount
{
// an interface cannot contain properties, so they will have to
// be declared in the child classes like what we're doing right here!
// hold the current balance for the account
public $balance = 0;
// deposit/increase the current balance for the account
public function Debit($acctNo, $amount);
{
// first authenticate the account holder.
// you should do a better authentication here! you get the point!
if ($acctNo == '12345';
{
$this->balance = $this->balance + $amount;
}
else
{
echo "Account access denied!";
}
}
// withdraw/decrease the current balance for the account
public function Credit($acctNo, $amount);
{
// first authenticate the account holder.
// you should do a better authentication here! you get the point!
if ($acctNo == '12345';
{
$this->balance = $this->balance - $amount;
}
else
{
echo "Account access denied!";
}
}
// get the current balance for the account
public function getBalance($acctNo);
{
// first authenticate the account holder.
// you should do a better authentication here! you get the point!
if ($acctNo == '12345';
{
return $this->balance;
}
else
{
echo "Account access denied!";
}
}
} // end SavingsAccount
?>
Here is the child class PreferredSavingsAccount code example:
<?php
protected class PreferredSavingsAccount implements IBankAccount
{
// an interface cannot contain properties, so they will have to
// be declared in the child classes like what we're doing right here!
// hold the current balance for the account
public $balance = 0;
// deposit/increase the current balance for the account
public function Debit($acctNo, $amount);
{
// first authenticate the account holder.
// you should do a better authentication here! you get the point!
if ($acctNo == '12345';
{
$this->balance = $this->balance + $amount;
}
else
{
echo "Account access denied!";
}
}
// withdraw/decrease the current balance for the account
public function Credit($acctNo, $amount);
{
// first authenticate the account holder.
// you should do a better authentication here! you get the point!
if ($acctNo == '12345';
{
$this->balance = $this->balance - $amount;
}
else
{
echo "Account access denied!";
}
}
// get the current balance for the account
public function getBalance($acctNo);
{
// first authenticate the account holder.
// you should do a better authentication here! you get the point!
if ($acctNo == '12345';
{
return $this->balance;
}
else
{
echo "Account access denied!";
}
}
} // end PreferredSavingsAccount
?>
Here is the child class CreditCardAccount code example:
<?php
protected class CreditCardAccount implements IBankAccount
{
// an interface cannot contain properties, so they will have to
// be declared in the child classes like what we're doing right here!
// hold the current balance for the account
public $balance = 0;
// deposit/increase the current balance for the account
public function Debit($acctNo, $amount);
{
// first authenticate the account holder.
// you should do a better authentication here! you get the point!
if ($acctNo == '12345';
{
$this->balance = $this->balance + $amount;
}
else
{
echo "Account access denied!";
}
}
// withdraw/decrease the current balance for the account
public function Credit($acctNo, $amount);
{
// first authenticate the account holder.
// you should do a better authentication here! you get the point!
if ($acctNo == '12345';
{
$this->balance = $this->balance - $amount;
}
else
{
echo "Account access denied!";
}
}
// get the current balance for the account
public function getBalance($acctNo);
{
// first authenticate the account holder.
// you should do a better authentication here! you get the point!
if ($acctNo == '12345';
{
return $this->balance;
}
else
{
echo "Account access denied!";
}
}
} // end CreditCardAccount
?>
The Rule
- An Interface can't be instantiated.
- You can't implement any method in an interface, i.e., it can only contains signature of the method but not actual code details (body). Leave all the implementation of the actual code to (child) classes.
- Interfaces can contain methods and/or constants, but no attributes such as property variables. Interface constants have the same restrictions as class constants. Interface methods are implicitly abstract.
- Interfaces must not declare constructors or destructors, since these are implementation details on the (child) class level.
- All the methods in an interface must have public visibility.
- Interfaces can include abstract methods and constants, but cannot contain concrete methods and variables. "Concrete methods" and "variables" are methods and variables that contain actual code implementation. Remember that all methods are implemented in the child classes and interfaces cannot contain property variables.
- A class (or a child class for that matter) can implement more than one interface, while it can inherit from only one abstract class.
- All methods declared in an interface must be implemented by the child class that implements the interface.
- All methods declared in an interface must be public; this is the nature of an interface.
- Interfaces can be extended to other interfaces (just like classes) using the extends operator.
- All methods in the interface must be implemented within a class; in other words, all methods declared in the interface must be implemented within a child class and not seperating some methods for one child class and some methods for another child class.
The methods have to go in only in one child class. Classes may implement more than one interface if desired by separating each interface with a comma.
Why should we use PHP interfaces?
There are several reasons that we should use interface in our PHP object-oriented programming:
- Interfaces allow you to define/create a common structure for your classes - to set a standard for objects.
- Interfaces solve the problem of single inheritance -- they allow you to inject 'objects' from multiple sources.
- Interfaces provide a flexible base/root structure that you don't get with classes.
- Interfaces are great when you have multiple coders working on a project -- you can set up a loose structure for programmers to follow and let them worry about the details.
WHEN SHOULD YOU MAKE A CLASS AND WHEN SHOULD YOU MAKE AN INTEFACE?
If you have a class that is never directly instantiated in your program, this is a good candidate for an interface. In other words, if you are creating a class to only serve as the parent to other classes, it should probably be made into an interface.
When you know what methods a class should have but you are not sure what the details will be. When you want to quickly map out the basic structures of your classes to serve as a template for others to follow -- keeps the code-base predictable and consistent -- it should probably be made into an interface..
What is a VARARG ?
A vararg is a variable-length argument list (a.k.a. vararg, variadic arguments), using the ellipsis (three dots, ...) token before the argument name to indicate that the parameter is variadic, i.e., it is an array variable to hold all parameters supplied by the caller of the function.
It is an arbitrary number of arguments in a method or constructor. It contains a list of arguments in a method, function, or constructor.
A simplier way of saying is that, a vararg is a variable token that accepts an arbitrary number of arguments in a method, function, or constructor.
Let's put it this way: When you create a method, a function, or a constructor, you have to declare your method, function, or constructor with an exact number of arguments, for example: public function MyMethod($a, $b, $c). Notice that you have three arguments: $a, $b, $c.
Now instead of having to declare an exact number of arguments (3 in the above case), you can use a variable token to declare in your method, function, or constructor to accept an arbitrary unknown number of arguments in your method, function, or constructor. For example: public function MyMethod(...$vararg).
Notice an ellipsis (three dots, ...) in front of the variable $vararg. This is called a vararg.
Consider this function which has a list of arguments, including variadic and non-variadic arguments.
<?php
/**
* Notice the token ... before the variable argument!
* It signifies that the argument length is unknown at design time!
* The actual argument list will be known at run-time when caller of
* this function passes the exact number of arguments!
*
* Also, noted that you can mix both variadic and non-variadic arguments in any function,
* seperating them with commas!
*/
public function variadic_func($nonVariadic, ...$variadic)
{
echo json_encode($variadic);
}
// you can call the function like this at run-time:
variadic_func(1, 2, 3, 4); // prints [2, 3, 4] <--- notice also that it is an array!
// as you can see, the actual number of arguments will
// be varied (hence variadic arguments) depending on the caller
?>
You can include type names as well (Bar in the below case) and it can be added in front of the ellipsis (three dots, ...):
<?php
class Foo
{
// code logic
public function myfoo(Bar ...$bar)
{
// code logic
}
}
// you can call the function like this at run-time:
$foo = new Foo();
$foo->myfoo(1, 2, 3, 4); // prints [2, 3, 4] <--- notice also that it is an array!
?>
You can use the & reference operator as well and it can be added before the ellipsis (three dots, ...), but after the type name (if any). Consider this example:
<?php
class Bar
{
// code logic
// now declare a vararg that points to the actual arguments using a reference operator denoted by &
// the token & is a reference operator that points to the actual address location of
// the actual arguments in the list
public function mybar(Foo &...$foo)
{
// code logic
}
}
// you can call the function like this at run-time:
$bar = new Bar();
$bar->mybar(1, 2, 3, 4); // prints [2, 3, 4] <--- notice also that it is an array!
?>
There you have it!!!
What is the difference between array and Object ?
Arrays and objects are different things in PHP, although they share some functionality. You can use an array as a dictionary-like data structure, meaning, you can use arrays by referring to their key indexes, for example, $profile = [], $profile['firstName'] = 'John', $profile['lastName'] = 'Doe', $profile['address'] = '123 Main St', etc.
In an object, you'll have to specify the whole object that contains its indexes and then specify the actual index objects, for example, assuming profile is that whole object, then you can assign the actual values to the object like this: $firstName = $profile->firstName= 'John', $lastName = $profile->lastName = 'Doe', $address = $profile->address = '123 Main St', etc.
As you can see, both are objects: array object and regular object. The only difference is the syntax. Arrays use the bracket characters [], while objects use the "arrow" operator (->). If you try to use array brackets to access the values on on object, PHP will issue a fatal error:
Fatal error: Cannot use object of type stdClass as array ...
Most of this is common knowledge to working PHP programmers. What's less commonly known is PHP's neat trick to allow end-user-programmers to define what should happen when a programmer tries to access object properties with array syntax. Put another way, you can give your objects the ability to work with array brackets ($myObject[]).
As you can see, $myObject[] is an object using array syntax to work with its object properties.
Because of a common confusion between array access and regular object access, PHP came up a better solution to solve this confusion between array object and regular object by providing an interface called ArrayAccess.
Yes, the goal of this tutorial is not to explain what an array and object are, but rather, to explain what an array access is, and how to go about in using it, using a PHP's especial trick to allow programmers to access object properties using array syntax.
So what exactly is an ArrayAccess ?
An ArrayAccess is a PHP interface that allow programmers to access object properties using array syntax. That's all that is -- allowing object properties to be accessed using array syntax.
There are situations where it is very convenient to access object properties using array syntax and PHP's ArrayAccess interface aims to do just that.
To start, you need to create a class and implement an interface called ArrayAccess along with its four methods: offsetExists(), offsetGet(), offsetSet(), offsetUnset(). For example:
<?php
/**
* Here is a barebone skeleton without the four methods
*/
class MyClass implements ArrayAccess
{
// code body ....
}
// Now let's try to assign a value to the property and then access it using both
// array and object syntaxes:
$object = new MyClass();
// assigning property 'foo' using array syntax
$object['foo'] = 'bar';
// accessing property 'foo' using array syntax
echo $object['foo']; // output nothing!
// accessing property 'foo' using object syntax
echo $object->foo; // output nothing!
// assigning property 'foo' using object syntax
$object->foo = 'bar';
// accessing property 'foo' using array syntax
echo $object['foo']; // output nothing!
// accessing property 'foo' using object syntax
echo $object->foo; // output nothing!
?>
As you can see, it uses array syntax to work with the object. The beauty about it is that, you can use the regular object syntax as well and it will work just fine. So you have two choices now to work with the object and using either one or both is just a matter of choice.
However, without the four methods, the above example won't do anything. So we need to implement the interface's four methods as well in order for it to do anything, and it looks like the following.
<?php
/**
* How do you implement the four interface methods?
* The documentation on PHP's website about implementing ArrayAccess's four methods is very vague and confusing.
*
* Anyhow, let's implement the four methods and see if we can learn anything from it.
*/
class MyClass implements ArrayAccess
{
// now let's implement the four methods by just echoing out its method name
public function offsetExists($offset)
{
// now whenever you test a property of this MyClass, whether it exists or not,
// behind the scene PHP calls this method called offsetExists($offset),
// passing a property name contains in $offset to this method!
// that's all PHP does behind the scene and nothing else!
// the rest is up to you to implement any way you desire!
// the below statement just echoing out its method name: offsetExists
echo __METHOD__, "\n";
}
public function offsetGet($offset)
{
// now whenever you access a property of this MyClass, say:
// $object = new MyClass();
// $myvarproperty = $object['foo'];
// behind the scene PHP calls this method called offsetGet($offset),
// passing a property name 'foo' (contains in $offset) to this method!
// that's all PHP does behind the scene and nothing else!
// the rest is up to you to implement any way you desire!
// the below statement just echoing out its method name: offsetGet
echo __METHOD__, "\n";
}
public function offsetSet($offset, $value)
{
// now whenever you assign a property of this MyClass, say:
// $object = new MyClass();
// $object['foo'] = 'bar',
// behind the scene PHP calls this method called offsetSet($offset, $value), passing
// a property name 'foo' (in $offset) and its value 'bar' (in $value) to this method!
// that's all PHP does behind the scene and nothing else!
// the rest is up to you to implement any way you desire!
// the below statement just echoing out its method name: offsetSet
echo __METHOD__, "\n";
}
public function offsetUnset($offset)
{
// now whenever you un-assign or unset a property of this MyClass, say:
// $object = new MyClass();
// $object['foo'] = '',
// behind the scene PHP calls this method called offsetSet($offset), passing
// a property name 'foo' (in $offset) to this method!
// that's all PHP does behind the scene and nothing else!
// the rest is up to you to implement any way you desire!
// the below statement just echoing out its method name: offsetUnset
echo __METHOD__, "\n";
}
}
?>
As you can see from the above illustration, PHP does nothing as to what should be implemented inside the four methods. This is by design as to allow programmers the flexibility to implement their own unique ways.
Let's see one way of implememtation that looks like the following.
<?php
/**
* As a rule of thumb, you shouldn't have to do much in these four methods and
* the example shown in these four methods should be suffice, only minor modifications needed!
*
* You should implement other code logic to augment these four methods as well.
*/
class MyClass implements ArrayAccess
{
// declaring a protected property
protected $data = array();
public function offsetExists($offset)
{
// now whenever you test a property of this MyClass, whether it exists or not,
// behind the scene PHP calls this method called offsetExists($offset),
// passing a property name contains in $offset to this method!
// that's all PHP does behind the scene and nothing else!
// the rest is up to you to implement any way you desire!
// let's return if our protected property $data exists or not
return array_key_exists($offset, $this->data);
}
public function offsetGet($offset)
{
// now whenever you access a property of this MyClass, say:
// $object = new MyClass();
// $myvarproperty = $object['foo'];
// behind the scene PHP calls this method called offsetGet($offset),
// passing a property name 'foo' (contains in $offset) to this method!
// that's all PHP does behind the scene and nothing else!
// the rest is up to you to implement any way you desire!
// let's just return our protected property $data
return $this->data[$offset];
}
public function offsetSet($offset, $value)
{
// now whenever you assign a property of this MyClass, say:
// $object = new MyClass();
// $object['foo'] = 'bar',
// behind the scene PHP calls this method called offsetSet($offset, $value), passing
// a property name 'foo' (in $offset) and its value 'bar' (in $value) to this method!
// that's all PHP does behind the scene and nothing else!
// the rest is up to you to implement any way you desire!
// let's set our protected property $data passed in by PHP in $value
$this->data[$offset] = $value;
}
public function offsetUnset($offset)
{
// now whenever you un-assign or unset a property of this MyClass, say:
// $object = new MyClass();
// $object['foo'] = '',
// behind the scene PHP calls this method called offsetSet($offset), passing
// a property name 'foo' (in $offset) containing a null value to this method!
// that's all PHP does behind the scene and nothing else!
// the rest is up to you to implement any way you desire!
// let's unset our protected property $data using index key passed in by PHP in $offset
unset($this->data[$offset]);
}
}
// Now let's try to assign a value to the property and then access it using both
// array and object syntaxes:
$object = new MyClass();
// assigning property 'foo' using array syntax
$object['foo'] = 'bar';
// accessing property 'foo' using array syntax
echo $object['foo']; // bar
// accessing property 'foo' using object syntax
echo $object->foo; // bar
// assigning property 'foo' using object syntax
$object->foo = 'bar';
// accessing property 'foo' using array syntax
echo $object['foo']; // bar
// accessing property 'foo' using object syntax
echo $object->foo; // bar
?>
Here is another one that can accomplish the job as well.
<?php
/**
* As a rule of thumb, you shouldn't have to do much in these four methods and
* the example shown in these four methods should be suffice, only minor modifications needed!
*
* You should implement other code logic to augment these four methods as well.
*/
class MyOtherClass implements ArrayAccess
{
// declaring a protected property
protected $data = array();
// declaring a constructor
public function __construct($data[])
{
// $this refers to the current object: $obj = new MyOtherClass(['zero', 'one']);
$this->data = $data;
}
public function offsetExists($index)
{
// now whenever you test a property $data of this MyClass, whether it exists or not,
// behind the scene PHP calls this method called offsetExists($index),
// passing a property name contains in $index to this method!
// that's all PHP does behind the scene and nothing else!
// the rest is up to you to implement any way you desire!
// let's return if our protected property $data exists/sets or not
return isset($this->data[$index]);
}
public function offsetGet($index)
{
// now whenever you access a property of this MyClass, say:
// $object = new MyClass(['zero', 'one']);
// $mypropertyone = $object['one'];
// behind the scene PHP calls this method called offsetGet($index),
// passing a property name 'one' (contains in $index) to this method!
// that's all PHP does behind the scene and nothing else!
// the rest is up to you to implement any way you desire!
// let's just return our protected property $data
if ($this->offsetExists($index]))
{
return $this->data[$index];
}
else
{
return false;
}
}
public function offsetSet($index, $value)
{
// now whenever you assign a property of this MyClass, say:
// $object = new MyClass(['zero', 'one']);
// $object['zero'] = 'testing',
// behind the scene PHP calls this method called offsetSet($index, $value), passing
// a property name 'zero' (in $index) and its value 'testing' (in $value) to this method!
// that's all PHP does behind the scene and nothing else!
// the rest is up to you to implement any way you desire!
// let's set our protected property $data passed in by PHP in $value
if ($index)
{
$this->data[$index] = $value;
}
else
{
$this->data[] = $value;
}
return true;
}
public function offsetUnset($index)
{
// now whenever you un-assign or unset a property of this MyClass, say:
// $object = new MyClass(['zero', 'one']);
// $object['one'] = '',
// behind the scene PHP calls this method called offsetSet($index), passing
// a property name 'one' (in $index) containing a null value to this method!
// that's all PHP does behind the scene and nothing else!
// the rest is up to you to implement any way you desire!
// let's unset our protected property $data using index key passed in by PHP in $index
unset($this->data[$index]);
return true;
}
}
// Now let's try to assign a value to the property and then access it using both
// array and object syntaxes:
$object = new MyClass(['zero', 'one']);
// assigning properties using array syntax
$object[] = 'two';
$object[] = 'three';
// accessing property 'zero' using array syntax
echo $object['zero']; // two
// accessing property 'one' using object syntax
echo $object->one; // three
// assigning properties using object syntax
$object->property1 = 'property value 1';
$object->property2 = 'property value 2';
// accessing property 'property1' using array syntax
echo $object['property1']; // property value 1
// accessing property 'property2' using object syntax
echo $object->property2; // property value 2
?>
There you have it!!!
What is a call_user_func() function ?
call_user_func() is a PHP callback function. A callback is a function that is to be executed after another function has finished executing -- hence the name 'call back'. A callback function is a function that is passed as an argument to another function, to be "called back" at a later time after another function has finished executing. Let's see how a PHP callback function call_user_func() works. For example:
File: simple.php.
<php
class Simple
{
// creating a simple callback function
public function simpleCallBack()
{
echo 'Hello, World!';
}
// creating a simple method to use call_user_func() function
public function simpleMethod()
{
/**
* normally you call a function/method using a class object and a function name.
* for example, $obj->simpleCallBack()
* or in the case of a static method:
* Simple::simpleCallBack()
*
* now with a callback, you are calling it using call_user_func() and
* passing a callback function name as a string to call_user_func() function.
* Then call_user_func() function calls the actual callback function and
* passes any arguments to it as well (if any).
* in the simple case below there isn't any argument to be passed to.
*/
$callback = call_user_func('simpleCallBack');
return $callback;
}
}
?>
Now we can use the above function like this:
<php
class UseSimple
{
// creating an instance of class Simple:
obj = new Simple();
// this statement will output: Hello, World!
obj->simpleMethod();
}
?>
Let's see some more examples:
File: simple.php.
<php
class Simple
{
// creating a simple "static" callback function
public static function simpleCallBack()
{
echo 'Hello, World!';
}
// creating a simple method to use call_user_func() function
public function simpleMethod()
{
/**
* this time, we're dealing with a "static" callback function and we need to
* pass the class' name as well as the callback function name
*/
$callback = call_user_func(['Simple', 'simpleCallBack']);
// or you could do like this as well and you get the same result:
// $callback = call_user_func(['Simple::simpleCallBack']);
return $callback;
}
}
?>
Now we can use the above function like this:
<php
class UseSimple
{
// creating an instance of class Simple:
obj = new Simple();
// this statement will output: Hello, World!
obj->simpleMethod();
}
?>
Let's see some more examples:
File: simple.php.
<php
class Simple
{
// creating a simple "static" callback function
public static function simpleCallBack()
{
echo 'Hello, World!';
}
// creating a simple method to use call_user_func() function
public function simpleMethod()
{
/**
* this time, we will use an "Object" method call instead of
* the "static" method call! $this refers to the current class "Simple" object!
*/
$callback = call_user_func([$this, 'simpleCallBack']);
/**
* or you could do this as well: creating an instance of class Simple.
* $obj = new Simple();
* however, using $this as in the above case is more sexy!
* $callback = call_user_func([$obj, 'simpleCallBack']);
*/
return $callback;
}
}
?>
Now we can use the above function like this:
<php
class UseSimple
{
// creating an instance of class Simple:
obj = new Simple();
// this statement will output: Hello, World!
obj->simpleMethod();
}
?>
Let's see some more examples:
File: foo.php.
<php
class Foo
{
// creating a relative static class callback function
public static function callBack()
{
echo 'Foo!';
}
// creating a method to use call_user_func() function
public function Method()
{
/**
* this time, we're passing a child class' name 'Bar' as well as the
* parent's callback function name 'callBack'
* this will output: Foo!
*/
$callback = call_user_func(['Bar', 'parent::callBack']);
return $callback;
}
}
?>
Now consider this as well:
File: bar.php.
<php
class Bar extends Foo
{
// overriding a relative static parent class callback function "callBack"
public static function callBack()
{
echo 'Bar!';
}
// creating a method to use call_user_func() function
public function Method()
{
/**
* this time, we're passing this child class' name 'Bar' as well as the
* parent's callback function name 'callBack'
* this will output: Foo!
*
* now what if we're passing this child class' name 'Bar' as well as this
* child's callback function name 'callBack'. what is the output?
* the 'callBack' didn't specify which callback to use and it defaults to
* the current object which is the child Bar. so this will output: Bar!
*/
$callback = call_user_func(['Bar', 'parent::callBack']);
return $callback;
}
}
?>
Now we can use the above function like this:
<php
class relativeStatic
{
// creating an instance of class Bar:
obj = new Bar();
// this statement will output: Foo!
obj->Method();
}
?>
Let's see some more examples:
File: foo.php.
<php
class Foo
{
// declaring a variable to hold the name of a callback function
public $callback = 'callBack';
// creating a method passing a callback function name as an argument
public function myMethod($this, $callback)
{
/**
* the call to call_user_func() will execute the callback function named
* "callBack".
*/
$callback = call_user_func([$this, $callback]);
return $callback;
}
public function callBack()
{
/**
* return the string value: "Hello, World!" to myMethod() which
* calls this function
*/
return 'Hello, World!';
}
}
?>
Now we can use the above function like this:
<php
class Bar
{
// creating an instance of class Foo:
obj = new Foo();
// this statement will output: Hello, World!
obj->myMethod();
}
?>
Let's see some more examples:
<php
class Download
{
/**
* create a function passing a callback function as an argument:
* $callback = ['CallBack', 'downloadComplete']
*/
public function downloadFile($file, $callback = NULL)
{
// declaring an array variable
$site = array();
foreach ($file as $key => $value)
{
// simulated downlaod action in each download!
sleep(2);
$data = 'Downloaded content from each file.';
if (is_callable($callback))
{
call_user_func($callback, $value, $data));
}
}
$site = [
'file' => $value,
'data' => $data,
]
return $site;
} // end downloadFile()
} // end class Download
?>
Let's define a class to use the callback. For example:
<php
class CallBack
{
// declaring an array variable
$site = array();
// create a static callback function called downloadComplete()
public static function downloadComplete($file, $data)
{
// declaring an array variable
echo sprint("Finished downloading from %s%", $file);
} // end downloadFile()
} // end class Download
?>
Now let's create another class to use the callBack class. For example:
<php
class UseCallBack
{
// a list of files to download
$site = [
'http://site1.com',
'http://site2.com',
]
// start the download process
downloadFile($file, ['CallBack' 'downloadComplete']);
} // end class Download
?>
What is the difference between $this, Self, and Parent ?
First of all before we get into the $this verses self verses parent descriptions, let's investigate an important key player that makes self and parent function the way they do.
That key player is called the Scope Resolution Operator, an operator similar to the PHP's "->" arrow accessor, or "." (a dot) accessor in other languages. For example:
// in PHP: pay close attention to the "->"
$value = $obj->getValue();
// and in other languaes: pay close attention to the "."
value = obj.getValue();
Now the Scope Resolution Operator (or in simpler terms, the double colon) looks like this:
// in PHP: pay close attention to the "::"
$value = MyClass::getValue();
// and in other languaes: it looks the same as PHP's "::"
value = MyClass::getValue();
The Scope Resolution Operator "::" (also called Paamayim Nekudotayim) or in simpler terms, the double colon, is a token that allows access to static, constant, and overridden properties or methods of a class.
In other words, it is a static class operator used to refer to static constant, (static) properties, and (static) methods of a class.
When referencing these items from inside the class definition, use the "self" keyword (more on self later). When referencing these items from outside the class definition, use the name of the class. For example:
// in PHP: using the name of the class: MyClass
$value = MyClass::getValue();
// in other languaes: the same as PHP's: using the name of the class: MyClass
value = MyClass::getValue();
The "::" accesses a (static) constant, a "static" property, and a "static" method similar to using an arrow "->" as an object accessor to access a non-static property and a non-static method.
$this verses Self
What is the difference between $this and self?
$this and self are similar in meaning and both achieve the same result. But they're used in different ways.
Inside a class definition, $this refers to the current object, while self refers to the current class. Both are similar in meaning and both achieve the same result.
It is necessary to refer to a class element using self, and refer to an object element using $this.So there is the difference, if any, self refers to a class element while $this refers to an object element. See more examples along with explanations throughout the following two sections.
Self verses Parent
"self" is a special object directive variable that refers (or points) to the current class itself--"itself" -- get it? The current class itself!
On the other hand, "parent" is also a special object directive variable that refers (or points) to the current class' parent class--the class that the current class inherited from!
Let's see some examples to help you understand better. For example:
<php
class Foo
{
/**
* Description:
*
* "::" is a token that allows access to static, constant, and overridden properties
* or methods of a class.
*
* according to the description there are three items that "::" is being used.
* but the description left out two more cases, and that is: accessing self and parent.
*
* let's see the first three items first and then we'll see the latter two last.
*/
/**
* according to the description it states: "::" allows access to
* static constant of a class.
* let's see what that means by declaring a constant variable to be used with "::".
* notice that all constants are static--no keyword "static" needed!
*/
const ORIGINAL_ENGINE_SIZE = '4.0-liter';
/**
* according to the description it states: "::" allows access to
* static overriden properties of a class.
* okay, let's see what that means by declaring a static property variable to be
* used with "::".
*/
public static $color = 'blue';
/**
*
* we'll declare a non-static overriden property variable as well just to be different!
*/
public $model = 'F150';
/**
* according to the description it states: "::" allows access to
* static overriden methods of a class.
* okay, let's see what that means by creating a static function called staticMethod())
* to be used with "::".
*/
public static function staticMethod()
{
/**
* make note of the use of the "self" and the "::"
* what happens if you replace "self::$color" with "self::$model" ?
* it will give you an error saying cannot access a non-static variable with self
* so if you want to access the non-static properties use $this->model
*/
// output: "The color is blue"
echo sprint("The color is %s%", self::$color);
/**
* likewise, to refer to this static constant. all constants are static!
* output: "The original engine is 4.0-liter"
*/
echo sprint("The original engine is %s%", self::ORIGINAL_ENGINE_SIZE);
/**
* make note of the use of the "self" and the "::" to refer to
* a "non-static" Method()
* this is illegal! you have to use "$this"
*/
self::Method(); // same as Foo::Method() <-- use $this instead
/**
* to refer to the non-static Method() do this:
*/
$this->Method();
/**
* likewise, to refer to this staticMethod() we do a re-cursive call--call itself!
*/
self::staticMethod(); // this is perfectly legal!
/**
* "self" can be used without the "::" as well. consider this:
* $obj is an instance of class Foo
*/
$obj = new Foo();
// or we could do this as well and it works the same way:
$obj = new self;
/**
* in the "if" statement below, $obj is referring to either form above.
* so you can use either form above and it will work just fine!
*
if ($obj instanceof self) /** "self" referring to Foo **/
{
// yes, $obj is an instance of class Foo
sprint("obj is an instance of %s%", $obj instanceof self);
}
}
/**
* okay, create a non-static function called Method() as well just to be different!
*/
public function Method()
{
/**
* output: "The model is F150"
* $this refers to the current object element: $model
*
* wait a minute: is $model the current object element?
* is $model an object or a class property?
*
* if you read my other tutorial called class verses object, you'll know
* that class and object both have the same meaning and achieve the same result,
* but each being used differently.
*
* properties like $model are stored in a permanent memory address location while
* objects like $this (or $this->model) are stored in a temporary location
* called RAM.
*/
echo sprint("The model is %s%", $this->model);
/**
* make note of the use: "self" and "::" to refer to the constant value.
*
* output: "The original engine is 4.0-liter"
*/
echo sprint("The original engine is %s%", self::ORIGINAL_ENGINE_SIZE);
/**
* make note of the use of the "self" and the "::" to refer to
* a "static" staticMethod()
*/
self::staticMethod(); // same as Foo::staticMethod()
}
} // end class Foo
?>
The examples shown thus far were from inside the class itself -- inside class Foo.
Now let's see some examples from outside the class -- particularly outside class Foo. For example:
<php
class UseFoo
{
// declaring a variable.
$foo = 'Foo';
/**
* make note of the use of variable: "$foo" to refer to the class name and
* the "::" to refer to the constant value.
*
* output: "The original engine is 4.0-liter"
*/
echo sprint("The original engine is %s%", $foo::ORIGINAL_ENGINE_SIZE);
/**
* likewise, the use of the class name: "Foo" to refer to the class name and
* the "::" to refer to the constant value.
*
* output: "The original engine is 4.0-liter"
*/
echo sprint("The original engine is %s%", Foo::ORIGINAL_ENGINE_SIZE);
/**
* likewise, the use of the class name: "Foo" to refer to the class name and
* the "::" to refer to the static variable property $color.
*
* output: "The color is blue"
*/
echo sprint("The color is %s%", Foo::$color);
/**
* to refer to staticMethod() do this:
*/
Foo::staticMethod();
/**
* to refer to non-static Method() do this: you already knew that!
*/
$obj = new Foo();
$obj->Method();
/**
* "self" can be used without the "::" as well. consider this:
* is $obj an instance of class UseFoo?
*/
if ($obj instanceof self)
{
// no, $obj is not an instance of class UseFoo, it's an instance of Foo!
sprint("no, obj is not an instance of %s%, it's an instance of Foo!",
$obj = $obj instanceof self? instanceof self : instanceof self);
}
// now $obj is an instance of UseFoo because of the object assingment above
// so the output: obj is an instance of UseFoo
sprint("obj is an instance of %s%", $obj instanceof self);
}
?>
Yes, the latter part of the code example above is a little too complex than it needs to be, but it illustrates the many ways self usage can be used.
$this verses parent
Now let's see some examples about parent and more $this examples as well. For example:
<php
class Foo
{
// declaring (parent) array variable to hold class objects--instances of classes.
public $instance = [];
// declaring (parent) class properties
public $make;
public $model;
public $color;
// declaring parent constructor
public function __construct($make, $model, $color)
{
// $this refers to the current object element or current class property
$this->make = $make;
$this->model = $model;
$this->color = $color;
/**
* another example about using $this
*
* if you look at the top of this class Foo, you'll notice that there is an array
* property variable called $instance to hold instances of classes.
* we'll use that property variable to demonstrate another way $this can be used.
* $this on the left side refers to the current object property while $this on
* the right side refers to the current class object or a copy of the
* class Foo object.
*/
$this->instance = $this;
/**
* what that one line of code above does is that it assigns an instance of
* class Foo object to its property variable called $instance.
* it's a copy of itself stored in its own property variable called $instance.
* this is perfectly legal!
*
* now child classes can just refer to this property variable called $instance if
* they want to use class Foo's instance object.
* you'll see sophisticated programmers make use $this to assign it to
* some variables a lot!
*/
}
protected function myFunc()
{
/**
* notice the recursive call to myFunc()--a call to itself from inside itself!
* notice the use of the class name "Foo" instead of "self"
* it is perfectly legal!
* we could as well use "self" in place of "Foo" and it is perfectly legal!
*/
echo sprint("This is a recursive call: %s%", Foo::myFunc());
}
}
?>
Now let's see the effect of using "parent::". For example:
<php
class Bar extends Foo
{
// declaring child class properties
public $rebate;
public $tax;
// declaring child class constructor with two additional argument parameters
public function __construct($make, $model, $color, $rebate, $tax)
{
/**
* right here where we use the keyword "parent" to refer to parent class "Foo"
* so it has the same effect as the non-inherited: Foo::__construct()
*
* notice that you still have to pass the same number of argument parameters: 3
*/
parent::__construct($make, $model, $color); /** calls Foo's __construct() **/
// $this refers to the current object element or current class property
$this->rebate = $rebate;
$this->tax = $tax;
}
// override parent's function definition
public function myFunc()
{
/**
* now call the parent function and if you look in the parent function,
* it echo out: The color is blue
* and that's exactly what this call to the parent function does.
* it outputs: The color is blue
* this has the same effect as the non-inherited: Foo::myFunc()
*/
parent::myFunc(); /** calls Foo's myFunc() **/
/**
* now here is a trick!
* look at the echo statement below and see if you understand the consequence
*
* what is the output? I'll leave it to you to make sense of it!
*/
echo sprint("The answer is %s%", Bar::myFunc());
}
}
?>
There you have it! $this verses self verses parent are three amigos that get used on a regular basis by everyday programmers. These three amigos are very powerful when used the right way. Have a go at them!
What is the difference between Static, Self, and Final ?
Both static and final are special visibility clauses (similar to public, protected, and private). Self is a class object. For more explanation and examples, see $this verses self verses parent tutorial.
Declaring class properties or methods as static make them accessible without needing an instantiation of the class. A property declared as static cannot be accessed with an instantiated class object using "->".
However, a static method can access that property declared as static (see inside aStaticMethod() as an example). To declare methods and properties as static use the keyword static in the front of the method or property, with the method containing the keyword function as well. For example:
<?php
// declaring class properties and methods as static
class Foo
{
// static properties cannot be accessed through the object using the arrow operator ->
// declaring static properties
static $id;
static $name;
static $email;
// static properties may only be initialized using a literal or constant. For example:
static $color = 'white';
static $make = 'Honda';
static $model = 'civic';
// static constant properties are not needed -- redundant! For example: this is illegal!
static const COMMAND_EVENT_FIRE = 'command_fire';
// it is redundant! not needed!
// you can achieve the same thing by removing word 'const' and replace it with the word 'static'
// for example, this is legal!
const COMMAND_EVENT_FIRE = 'command_fire';
// this is legal!
public static function aStaticMethod()
{
// here inside a static method!
// because static methods are callable without an instance of the object created,
// the variable $this is not available inside the method declared as static.
// $this refers to an object or an instance of the current object.
// so the following is illegal!
$this->id;
// so what to do about $id?
// well, you could use 'self' instead.
// the following is legal!
self::$id;
// the following are also legal!
self::$name;
self::$email;
}
}
?>
If no visibility declaration is used (as in the above case for properties), then the properties (or methods) will be treated as if they were declared as public. Now you can access the static method (aStaticMethod()) and properties like this:
<?php
// notice the use of the "::" double colon to refer to a static property or method
// remember that you cannot use "->" as in Foo->aStaticMethod()
// you have to use the "::" double colon to refer to a static property or method
Foo::aStaticMethod();
// or you can use "self"
self::aStaticMethod();
$classname = 'Foo';
$classname::aStaticMethod();
// that was a fancy way of doing this:
Foo::aStaticMethod();
// or this using "self"
self::aStaticMethod();
?>
More About: Static Function or Static Method
Static method/function are properties of the class that can be invoked/accessed directly outside the class without needing to instantiate them first. Make note: 'invoking or accessing them directly outside the class without needing to instantiate them first.'
In the example above, you can access class Foo's property aStaticMethod() directly without having to instantiate class Foo first by using the scope resolution operator (::).
In the following example, you can access class Bar's method barStatic() directly using the scope resolution operator (::) because method barStatic() was declared as a static method.
As you can see, you do not need to instantiate class Bar first (nor can you instantiate them first) in order to be able to access method barStatic(). Simply put: you cannot access or invoke static methods via object instantiation using object reference: ->.
To invoke/access static method/function directly outside the class without needing to instantiate it first, you need to use the scope resolution operator (::). For example:
<?php
// this code is outside class Bar definition
Bar::barStatic();
?>
Let's see some more examples:
<?php
// declaring class properties and methods as static
class Foo
{
// declaring static properties with constant values
static $color = 'white';
static $make = 'Honda';
static $model = 'civic';
public static function car()
{
// inside a static method!
// remember that we cannot use "->"
// so we have to use "self" as well as scope resolution operator (::)
return self::$model;
// or if calling from another method outside of class Foo
// return Foo::$model;
}
}
// declaring class Bar properties and methods as static
class Bar extends Foo
{
public static function barStatic()
{
// inside a static method!
// remember that we cannot use "->"
// so we have to use "self" as well as scope resolution operator (::)
return parent::$color; // output: white
// we can as well refer to parent class Foo's static method: return parent::car; // output: civic
// notice that we use 'parent' to refer to parent class Foo's static property 'color'
// and as well as parent class Foo's static method 'car'
// remember that we cannot use "->"
// so we have to use "self" as well as scope resolution operator (::)
// return self::$color; // output: white
// or if calling from another method outside of class Foo
// return Foo::$color;
}
}
?>
Now we can do these:
<?php
print Foo::model() . "\n"; // output: civic
// now via an object
$foo = new Foo();
// now check this out via an object using a double colon
print $foo::$car() . "\n"; // output: civic
print $foo->model() . "\n"; // output: Undefined "Property" model
$className = 'Foo';
print $classname::$model . "\n"; // output: civic
print Bar::$color . "\n"; // output: white
print Bar::$make . "\n"; // output: Honda
print Bar::$model . "\n"; // output: civic
// now via a Bar object
$bar = new Bar();
print $bar->barStatic() . "\n"; // output: white
?>
PHP Instances: new Static() verses new Self()
For more explanation on this subject, please check out the following link:
What is the difference between new self and new static?What is the difference between new self() and new static()?
Both create an instance of a current class. Let's see an example to get a better visualization:
<?php
class Foo
{
// create an instance of class Foo
public static function getSelf()
{
// here, self() is referring to class Foo
return new self();
}
// likewise, create an instance of class Foo
public static function getStatic()
{
// here, likewise, static() is referring to class Foo
return new static();
}
}
?>
So, what is the difference between new self() and new static()?
As you can see, there is absolutely no difference at all! They both return instances of their own class, which is class Foo.
However, consider the following to see the difference between new self() and new static():
<?php
class Bar extends Foo
{
// additional class Bar code!
}
?>
Let's create another class to see the effect between new self() and new static():
<?php
class Stranger
{
/**
* return instances of class Foo
* here, we call Foo's method from outside class Foo using a class name and an "::".
* getSelf() returns its own class name Foo.
* while getStatic() also returns its own class name Foo
* so there is no difference!
*/
echo (Foo::getSelf()); // Foo
echo (Foo::getStatic()); // Foo
/**
* here, likewise, we call Bar's method from outside class Bar using a
* class name and an "::".
* but class Bar doesn't have getSelf(); however, class Bar extends from class Foo,
* and therefore, class Bar gets getSelf() from class Foo through inheritcance.
* so getSelf() returns its own class name, which is Foo.
*
* meanwhile, getStatic() also returns its own "static" class name, which is Bar.
* make note: "own" "static"--more specifically, "static". so there is a difference!
*
* notice the reference to Bar::getStatic() but class Bar doesn't have getStatic().
* however, class Bar gets getStatic() from class Foo through inheritcance.
* so Bar::getStatic() is like class Bar referring to its "own" method getStatic()
* and that's why Bar::getStatic() returns Bar.
* so it is bear repeating: there is a difference!
*/
echo (Bar::getSelf()); // Foo
echo (Bar::getStatic()); // Bar
}
?>
There you have it: the difference between new self() and new static().
Next up is the final visibility tutorial. A final visibility is similar to a static visibility programming.
PHP Visibility: final
PHP's final visibility prevents child classes from overriding a method by prefixing the definition with final. If the class itself is being defined as final then it cannot be extended.
So the keyword 'final' means that is it: no more to be had! It can't be extended. It's final!
Let's see some examples.
If a class itself is being defined as "final" then it cannot be extended:
<?php
// here, a class is being defined as "final" and therefore it cannot be extended
final class Foo
{
private function methodName1()
{
// code logic
}
// this "final" keyword declaration is not matter because the class
// "final" keyword declaration supersedes anything else
final public function methodName2()
{
// code logic
}
}
?>
Now consider this:
<?php
// declaring class properties and methods as static
class BaseFoo
{
// declaring an ordinary function without a "final" keyword
// this means that child classes can extend this BadeFoo class
public function test()
{
// echoing out the ordinary function test()
// so in effect, it calls itself (function test()). it's a recursive call.
// no "final" keyword so no problem here!
echo "BaseFoo::test() called\n";
}
// declaring a function with a "final" keyword
// watch out child classes: you can't extend this parent class!
final public function moreTesting()
{
// echoing out the "final" function moreTesting()
// again, it calls itself (function moreTesting()). it's a recursive call.
// and no problem here, either, as of now!
// later it could be a problem if child classes try to extend from this class!
echo "BaseFoo::moreTesting() called\n";
}
}
?>
Let's see some child classes examples to see if they want to cause some problems:
<?php
// declaring child class definition and extending from parent class BaseFoo
class ChildClass extends BaseFoo
{
// overriding a parent's method called moreTesting() that has a "final" keyword on it
// this will cause a problem!
// you cannot override a parent class with a method declared as "final"
public function moreTesting()
{
// again, it calls itself (function moreTesting()). it's a recursive call.
// This time, it results in a fatal error:
// Cannot override final method BaseFoo::moreTesting()
echo "ChildClass::moreTesting() called\n";
}
}
?>
It would be perfectly fine if child classes just extend from the parent class but don't override the methods with the "final" keyord on them. Just override the ones that don't have "final" keyword on them and it would be just fine.
Let's see some more examples:
<?php
// declaring a base class Foo definition
class Foo
{
// a "private" method declared as "final"
final private function Testing()
{
// again, it calls itself (function moreTesting()). it's a recursive call.
// no error!
echo "Foo::Testing() called\n";
}
}
?>
Let's see some child classes examples to see if they want to cause some problems:
<?php
// declaring child class definition and extending from parent class Foo
class Bar extends Foo
{
// overriding a parent's "private" function that has a "final" keyword on it
// this will cause a problem!
// you cannot override a parent class with a method declared as "final"
// the parent's visibility clause plays no role in this but
// a method declared as "final" is causing a major error problem
private function Testing()
{
// again, it calls itself (function Testing()). it's a recursive call.
// again, it results in a fatal error:
// Cannot override final method Foo::Testing()
echo "Bar::Testing() called\n";
}
}
?>
The right way and the wrong way:
<?php
class Foo
{
// the right way: final public/protected/private function methodName1()
// "final" keyword has to come before any clauses
final private function methodName()
{
// code logic
}
// the wrong way: public/protected/private final function methodName2()
// "final" keyword has to come before any clauses
public final function methodName()
{
// code logic
}
}
?>
So the key point to take away from this is that, a parent's visibility clause plays no role in the error problem, but a method declared as "final" plays a major in causing the code to fail.
Here is a cool way to keep evaluating something until it fails a condition.
Do you ever looking at someone else code and wondering what a block of code is trying to accomplish, or more specifically, what a block of code means?
Here is one of that block of code:
What does the following block of code mean or what does it try to accomplish?
What statement causes the loop while (true) to end?
Or more specifically, when does the loop while (true) end?
<?php
// notice that while (true) can be written as while (1) as well!
while (true)
{
if ('test')
{
// do something
}
else
{
break;
}
}
?>
The answer to the question: 'When does the loop while (true) end?' is dependent on the condition you supplied in your test.
In this case, it ends when the test fails and it goes to the else condition code block and, therefore, the break clause is executed.
When the break clause is executed, it jumps out of the while (true) loop.
Now consider this example:
<?php
public function largePrecisionPowMod($base, $power, $modulus)
{
// start with 1
$result = "1";
// notice that while (true) can be written as while (1) as well!
// loop until the exponent is reduced to zero
while (true)
{
if (bcmod($power, 2) == "1")
{
$result = bcmod(bcmul($result, $base), $modulus);
}
// when the exponent is reduced to zero, we exit the loop
// and return $result
if (($power = bcdiv($power, 2)) == "0")
{
// likewise, when the test condition is true,
// it comes here and executes the 'break' clause, which in turn,
// causes it to jump out of the while (true) loop!
break;
}
$base = bcmod(bcmul($base, $base), $modulus);
} // end while
return ($result);
}
?>
As you can see, there is nothing special about while (true) loops. They are just loops that keeps looping around and around and around indefinitely until you make it jump out of the while (true) loops.
A typical method to make it jumps out of the while (true) loops is to use a break clause.
Here is the code explanation:
<?php
/**
* consider a normal while() loop as you normally write, for example:
*/
while ($i < $n)
{
$i++;
}
/**
* now this is the usual way of doing!
* we have a while loop that contains a condition that
* will allow the loop to exit when $i is greater than $n
*
* but in the while (true) loop it will run indefinitely
* because the condition is always 'true'
*
* so to make the condition false, you have to set that
* conditon somewhere in the body of the while(true) loop
* so that it can exit the loop! very simple!
*
* a typical method to make it jumps out of the while (true) loops is to use a break clause
*/
<?php
/**
* this while (true) loop just keeps running and running and running ...
* until it encounters a 'break' clause!
*
* make note: "until it encounters a 'break' clause"
*/
$test = true;
// notice that while (true) can be written as while (1) as well!
while (true)
{
// now test to see if 'test' condition is still true
if ($test)
{
// the first time 'test' should be true
// the next subsequent iterations are dependent
// on what you set 'test' to be!
// do something that causes 'test' to be false so
// that the next iteration of this 'if' will fail!
// for this example, we'll just set 'test' to false!
$test = false;
// now assuming that 'test' is still true, the while (true)
// will continue to run and run and run ... !
// but in this case, we set 'test' to be false,
// so the next iteration of the while (true) loop will
// still be looping and proceeding to hit the 'if' condition again!
// but this time, the 'if' condition will fail and it goes to
// the 'else' condition, and it encounters a 'break' clause,
// which causes it to jump out of the while (true) loop and ends!
}
else
{
// so if you make the 'if' condition to be 'false',
// it will come here for its next iteration of while (true) loop,
// and therefore it will encounter the 'break' clause, which
// causes it to exit the iteration of while (true) loop!
break;
// notice that you have to put the 'break' clause to
// cause the while (true) loop to exit!
}
here is another example:
this time using only if statement.
so this is not about while (true) loop but it is about 'if'
let's see if you can answer these two questions.
the first 'if' statement (below), will it echo out: 'test is true'?
the second 'if' statement (below), will it echo out: 'test is false'?
so this is not about while (true) loop but it is about 'if'
$test = true;
if ($test)
{
$x = 'test is true';
}
echo $x;
if (false)
{
$x = 'test is false';
}
echo $x;
?>
What was your answer for the first 'if' condition?
How about your answer for the second 'if' condition?
Here is an explanation:
<?php
/**
* first of all, there are two cases we have to clarify:
*
* first, the 'if' condition:
*
* if (condition is true)
* // it should come here even if you don't place curly brackets {}
* after that it comes here as well even if the condition is true or false
*
* do you see the code flow of the 'if' statement?
*
* second, the use of the boolean statement: if (false)
*
* this test implies the earlier boolean condition which was set to true.
*
* in a way, this is similar to the while (true) condition shown earlier!
*
* let's see the answers:
*/
so the first 'if' statement will echo out: 'test is true'
$test = true;
if ($test)
{
$x = 'test is true';
}
notice that you can remove the curly brackets '{}' above as well
and it still functions the same.
echo $x;
now the second 'if' statement will not echo out: 'test is false'
why? do you know why?
see explanation below!
if (false)
{
$x = 'test is false';
}
notice that you can remove the curly brackets '{}' above as well
and it still functions the same.
echo $x;
if (false) implies the earlier boolean condition if it is false.
but the earlier boolean condition was true; and therefore,
the second 'if' statement is false and $x contains null
because the assignment statement to $x was not executed.
very simple!
?>
Here is another example using Python:
<?php
/**
* As you can see in the code example below the 'while True' is always true and
* the loop never exits because there isn't a 'break' clause.
*
* This is by design because the goal of this code is to dispaly an
* image on the screen and because we want to see the image indefinitely,
* and not just a few seconds, we use the 'while True' loop to loop
* indefinitely so that the image being displayed is not all of a sudden
* disappear -- we want to see the image being displayed indefinitely.
*
* This is the reason the 'while True' loop doesn't have a 'break' clause.
*
* The code below is partially listed from an actual functional code.
*/
while True:
index = int(input("Enter a number (0 - 59999): "))
img = images[index]
plt.imshow(img.reshape(28, 28), cmap="Greys")
img.shape += (1,)
# Forward propagation input -> hidden
h_pre = b_i_h + w_i_h @ img.reshape(784, 1)
h = 1 / (1 + np.exp(-h_pre))
# Forward propagation hidden -> output
o_pre = b_h_o + w_h_o @ h
o = 1 / (1 + np.exp(-o_pre))
plt.title(f"Subscribe if its a {o.argmax()} :)")
plt.show()
# The plt.show() shows the image on the screen indefinitley!
# And there is no break clause afterward to exit the loop!
?>
There you have it!
A nice way to code your while (true) loop and as well as a bonus if statement!
FYI: Here are the five active web browser rendering engines that you can use to build your own web broswer
For those of you who are interested in building your own web browsers similar to Microsoft's newest web browser called Edge, Google's Chrome, Apple's Safari, Mozilla's Firefox, and Linux's Opera, here are five active web browser rendering engines that you can use to build your own web broswer. Please Google these browser engines to learn more:
WebKit: Safari browser
WebKit is fast, open source web browser engine used by Safari, Mail, App Store, and many other apps on macOS, iOS, and Linux.
WebKit web browser engineBlink: Google Chrome and Chromium-based browsers such as Microsoft Edge browser, Opera browser, Brave browser and Vivaldi browser.
Blink is an open-source browser layout engine developed by Google as part of Chromium (and therefore part of Chrome as well). Specifically, Blink began as a fork of the WebCore library in WebKit, which handles layout, rendering, and DOM, but now stands on its own as a separate rendering engine.
Blink Rendering EngineGecko: Firefox browser
Gecko is a browser engine developed by Mozilla. It is used in the Firefox browser, the Thunderbird email client, and many other projects.
Gecko is designed to support open Internet standards, and is used by different applications to display web pages and, in some cases, an application's user interface itself (by rendering XUL). Gecko offers a rich programming API that makes it suitable for a wide variety of roles in Internet-enabled applications, such as web browsers, content presentation, and client/server.
Gecko is written in C++ and JavaScript, and, since 2016, additionally in Rust. It is free and open-source software subject to the terms of the Mozilla Public License version 2. Mozilla officially supports its use on Android, Linux, macOS, and Windows.
Gecko Home Page Gecko-based browsersGoanna: Pale Moon and Basilisk browsers.
Goanna is an open-source browser engine that is a fork of Mozilla's Gecko. It is used in the Pale Moon browser, the Basilisk browser, and other UXP-based applications. Other uses include a fork of the K-Meleon browser and the Mypal browser for Windows XP.
Goanna as an independent fork of Gecko was first released in January 2016. The project's founder and lead developer, M. C. Straver, had both technical and trademark motives to do this in the context of Pale Moon's increasing divergence from Firefox.
There are two significant aspects of Goanna's divergence: It does not have any of the Rust language components that were added to Gecko during Mozilla's Quantum project, and applications that use Goanna always run in single-process mode, whereas Firefox became a multi-process application. Please Google the term "Goanna browser engine" to learn more.
Pale Moon ProjectFlow: Flow browser
Flow is a web browser with a proprietary rendering engine that claims to "dramatically improve rendering performance." Its JavaScript engine, however, is the SpiderMonkey engine of Firefox. Flow is developed by the Ekioh company, which has made simpler browsers for set-top boxes and other embedded systems.
Flow web browser
Compiler: Backus-Naur Form
For those of you who are interested in creating your own programming language similar to PHP, Javascript, Java, C/C++, C#, Python, Delphi, etc., here is how to go about in finding resources on creating your own compiler. A term "compiler" means a programming engine that runs the program you write in plain text. Say you write your program in PHP or Java in plain text, a PHP or Java compiler will convert your plain text into a PHP or Java readable code.
Please Google the term "Backus-Naur" to learn more.
In computer science, Backus-Naur Form or Backus normal form (BNF) is a metasyntax notation for context-free grammars, often used to describe the syntax of languages used in computing, such as computer programming languages, document formats, instruction sets and communication protocols.
They are applied wherever exact descriptions of languages are needed: for instance, in official language specifications, in manuals, and in textbooks on programming language theory.
Many extensions and variants of the original Backus-Naur notation are used; some are exactly defined, including extended Backus-Naur form (EBNF) and augmented Backus-Naur form (ABNF)
In simple term, the Backus-Naur Form is used to form a flowchart for the lexical program analyzer (or a program parser) for a compiler to read and analyze the text input. For example, if you create a webpage in HTML, you would start by writing an opening <html> and then followed by an opening <head>, followed by an opening <meta>, followed by an opening <title>, followed by the actual title text description, and then followed by the closing </title>, followed by the closing </head>, followed by an opening <body>, followed by the actual content of the 'body', and then followed by the closing </body>, followed by the closing </html>. For example:
/**
* An HTML code for a lexical analyzer to read the grammar
*/
<html>
<head>
<meta .....>
<title>title text description</title>
</head>
<body>
content of the 'body'
</body>
</html>
The lexical analyzer of the compiler will read and analyze the above code using the Backus-Naur Form and then if it is conformed to the Backus-Naur Form, it will hand over to the compiler to translate the code into a machine readable code.
Backus-Naur FormThe easiest way to create your own programming language is to use tools already created by others. Two of the best tools available are called Yacc and JavaCC (or Java Compiler Compiler).
Yacc (Yet Another Compiler-Compiler) is a computer program for the Unix operating system developed by Stephen C. Johnson. It is a Look Ahead Left-to-Right (LALR) parser generator, generating a LALR parser (the part of a compiler that tries to make syntactic sense of the source code) based on a formal grammar, written in a notation similar to Backus-Naur Form (BNF).
The Lex & Yacc Home Page JavaCC: Java Compiler Compiler Lex & Yacc ResourcesYou can check the following link out as well in the topic of creating your own programming languages:
Build your own languages with JavaCCWhat is boolean?
A boolean is a logic that conveys all values are either true or false. That's what a boolean is: a logic that is either true or false.
For example, if you have two logics, one is true, and another is false, the outcome is false. See truth table later for more.
The term boolean was derived from the name of its inventor named George Boole (November 2, 1815 - December 8, 1864).
George Boole, who wrote a book called the Mathematical Analysis of Thought and An Investigation of the Laws of Thought to illustrate his logic, is recognized as the father of modern information technology, ushering the modern technology that basically effecting every facets of our lives today.
From the book, Boole's thinking has become the practical foundation of digital circuit design and the theoretical grounding of the the digital age.
His idea in the book, particlulary the boolean logic, is widely being used in all facets of modern technology, especially in electronics - and more predominantly in modern computing technology.
A contemporary of Charles Babbage, whom he briefly met, George Boole is these days credited as being the "forefather of the information age".
An Englishman by birth, in 1849, he became the first professor of mathematics in Ireland's new Queen's College (now University College) Cork.
Boolean Logic
Boolean logic is very easy to explain and to understand.
- You start off with the idea that some statement X is either true or false, it can't be anything in between (according to George Boole, this is called the law of the excluded middle).
Then you can form other statements, which are true or false, by combining these initial statements together using the fundamental logic operators: And, Or, and Not.
The way that all this works more or less fits in with the way that we used these terms in English.
For example, if X is true then Not(X) is false.
So, if "today is Monday" is true then "Not(today is Monday)" is false.
We often translate the logical expression into English as "today is Not Monday" and this makes it easier to see that it is false if today is indeed Monday.
Truth Table
The rules for combining expressions are usually written down as tables listing all of the possible outcomes. These are called truth tables, and for the three fundamental logic operators, these are:
| Truth Table |
| Input X | Input Y | Output |
| True | True | True |
| True | False | False |
| False | True | False |
| False | False | False |
As you can see from the truth table above, when the input X is true and the input Y is also true, the outcome is also true.
Likewise, when the input X is true and the input Y is false, the outcome is false.
Next, when the input X is false and the input Y is true, the outcome is false.
Likewise, when the input X is false and the input Y is true, the outcome is false.
Lastly, when the input X is false and the input Y is also false, the outcome is false.
Logical Operators: AND, OR, NOT
/**
* using AND logical operator to test two or more conditions
*/
if ((A > B) AND (B > C))
{
// in order for the condition to be true, both A and B has to be greater than C
....
}
/**
* using OR logical operator to test two or more conditions
*/
if ((A > B) OR (B < C))
{
// in order for the condition to be true, B has to be between A and C
// a simplier way of saying is that, it is true if A > B
// also, it is true as well if B < C
// note that both of the conditions need not to be true
// in order for it to be true!
// only one of the conditions needs to be true
// not necessarily that both of the conditions need not to be true
// in order for it to be true!
}
/**
* using NOT logical operator to test one or more conditions
* notice that logical operator NOT can be used to test
* a single condition as well!
*
* most programming languages use a symbol character '!' to represent 'NOT'
*
* and a lot of programming languages use both the symbol character '!' and
* the word 'NOT' to represent 'NOT'
*
* let's see some examples!
*/
if (!A > B)
{
// in order for the condition to be true, A has to be less than B
}
/**
* using NOT logical operator to test one or more conditions
*/
A = true;
// if not A, meaning if A is not equal to true
if (!A)
{
// in order for the condition to be true, A has to be false
}
/**
* using NOT logical operator to alternate between true and false
*/
alternate = true;
for (i = 0; i < 10; i++)
{
// this assignment basically alternating between true and false
alternate = !alternate;
}
/**
* using boolean logic
*/
// this can also be written as: while (1)
while (true)
{
// this condition basically is an endless while loop!
}
// while not true
// this can also be written as: while (!1)
while (!true)
{
// this condition basically is an endless while loop as well!
}
To be continued!
What is PHP cURL ?
cURL (or client URL) is a request/response model or protocal that enables to send and receive data to and from the server. In other words, you can use cURL to transfer data to the server and the server will return the data you requested back to you (or more specifically, your client application, hence the word client in cURL). It's a request/response transfer protocol or model!
To transfer data using cURL or to fetch/retrieve data using cURL, you have to write a client script using client-side scripting languages such as PHP, Javascript, ASP, etc.
In this tutorial, we'll use PHP as the client-side scripting language. Let's see some examples with explanations accompanying the illustration. Let's try to retrieve the content of a remote website: any content that appears on the remote website, it's a fair game!
All we need is the url of the remote website and we can get all of the content in the remote website.
In order to download the contents of a remote web site, we need to define the following options:
- CURLOPT_URL: Defines the remote URL.
CURLOPT_RETURNTRANSFER: Enables the assignment of the data that we download from the remote site to a variable, i.e., $result. When we print the value of the variable $result to the screen, we will see the picture/content of a web site being displayed.
The options can be written more compactly using curl_setopt_array(), which is a cURL function that convenes the options into an array.
Okay, let's putting things together. Notice that this example shows a very minimal options that are available. There are lots of options available to set, but for the sake of simplicity, we'll just use the very absolute minimum options. But first, here is a typical skeleton of the cURL script:
<?php
$url = __DIR__ . DIRECTORY_SEPARATOR . "some_remote_file.html";
/**
* initializing curl.
* this is like creating a constructor in other programming
* languages. when this line is executed it will go through a
* series of code initialization.
*/
$curl = curl_init();
/**
* after all of initialization has been done, it opens a
* connection to the url you provided in variable $url.
* the 'w' is to signify to the file protocol that we want
* to send (or 'w'rite to) the remote file (or website).
*/
$fileHandle = fopen($url, "w");
/**
* CURLOPT_URL is the option containing the remote url.
*
* CURLOPT_HEADER is the option containing the client header,
* the header that this browser sends to the remote host.
* setting it to true will send all the header information to the remote host.
* you can send specific header information for debugging purpose by
* specifiying the header property, i.e., HEADER_COOKIE to send cookie.
*
* CURLOPT_RETURNTRANSFER is the option to specify that we
* want cURL to return the requested content back to us.
* setting CURLOPT_RETURNTRANSFER to true does the job.
*
* sometimes, we just want to send the content to the
* remote host and never want to get anything back; for example,
* when you connect to a remote host to use its API services
* such using PayPal credit card payment API, Stripe credit card
* payment API or a stock trading API from some of the brokerage services,
* you don't need to receive the content back through this client
* request initiation.
*
* instead, you just want to connect to the remote host and access their
* API content that is storing in the remote host's server.
*
* in that case, set it to false because you don't want the server to
* send back the whole API content via the internet.
* besides, the remote host would not allow you to do that in the first place.
*
* CURLOPT_FILE option is to allow us to send and receive
* files. in cURL, we can send any content including
* files. using CURLOPT_FILE option allow us to send and
* receive files.
*/
curl_setopt_array($curl, [
CURLOPT_URL => $url,
CURLOPT_HEADER => true,
CURLOPT_RETURNTRANSFER => true,
CURLOPT_FILE => $fileHandle
]
);
/**
* after all of options have been set, it's time to
* send the request to cURL to do its job.
*
* now the call to curl_exec() executes the cURL engine.
*/
$result = curl_exec($curl);
// after that, we can close the cURL engine
curl_close($curl);
/**
* after the close of the cURL engine, it's time to
* get the content sent back by cURL engine.
*
* $result contains the response from the server.
*
* the response from the server contains a long string.
*
* so you would have to format how your content to be
* sent back to the client.
*
* this means that in your remote host script that does all
* of the responses to your client's requests would need to
* format the long string using delimiters, i.e., '|', '&', '#', etc.
*
* how you format your content to be sent back is up to you.
* and once you get the content, you can unravel/unformat your
* content accordingly.
*/
echo $result;
?>
As you can see, it is very easy to use cURL script to transfer data to and from the remote host.
Let's see a real example using cURL script to retrieve the content of a remote website: any content that appears on the remote website, it's a fair game, including a web site of singer Lady Gaga!
In this example, the content data of Lady Gaga's website is assigned to the variable $result. For example:
<?php
$curl = curl_init();
/**
* after all of initialization has been done, we can set
* all of the options needed inline.
*
* these options will connect our client to the remote host
*/
curl_setopt($curl, CURLOPT_URL, "https://www.ladygaga.com");
curl_setopt($curl, CURLOPT_RETURNTRANSFER, true);
curl_setopt($curl, CURLOPT_HEADER, false);
$result = curl_exec($curl);
// after that, we can close the cURL engine
curl_close($curl);
/**
* when we echo the value of the variable $result to
* the screen, we will see the picture/content of a web site
* of singer Lady Gaga.
*
* give it a try and see what happens!
*/
echo $result;
?>
cURL script is a very powerful tool for transfering data and receiving data back from the remote host. Please Google the term cURL to learn more using your favorite client-side languages of your choice.
Here is a very brief explanation of color palletes that you should encounter most often when programming web applications.
You often see people use color palletes like rgb(50, 150, 255), rgb(0, 125, 005), rgb(160, 050, 205), rgb(255, 050, 109), etc.
What do these mean?
If you answered: they're color schemes, then you're correct!
So the next question is: what is a color scheme or sometimes known as color pallete?
To answer that, let's see some basic principle behind colors.
In screen displays such as computer screen, TV screen, or any electronic display screens, they contain very tiny holes layout in the entire screen pane or screen area. These holes are called pixels.
If you were to take a screen and submerge it under water and lift the screen up water would have dripping down through the pixels or holes and drained down and no water would be able to be held on the screen pane.
So screens are designed to have holes or pixels in them so that lights can shine through them. That is how display screen works by shining lights through pixels or holes.
And that is also how colors are made by shining different light intensity into those pixels.
Each pixel is made up of three separate lights. Each of these is able to change in intensity, from none to full brightness. A signal is sent to every pixel with information about the brightness of each component part: Red, Green, and Blue.
Our eye is sensitive to different wavelengths but creates all the colors we see through three main channels: Long, Medium, and Short wavelengths. The differing quantities of Red, Green, and Blue light emitted activates these receptors to create the sense of color we perceive.
If you look at the pixels of almost any screen display close up, say with a magnifying glass, you'll find that each pixel comprises three smaller areas (called subpixels) that are red, green, and blue - the additive primary colors.
So each pixel on the screen can create the perception of any color desired (as long as that color is within the screen's color gamut) simply by combining different amounts of red, green, and blue light.
All three primaries (or subpixels) lit "full on" makes that pixel white; lighting just the green and red subpixels makes yellow, and so forth.
So every image shown on the screen is really just a set of data for each pixel, which encodes the intended brightness of each of the three subpixels at that location.
So in a simplest term, it is merely shining combinations of lights into the pixels that causes the color to appear distinct from one another; for example, if you shine certain lights on certain pixels it will cause the output of those pixels to show certain color.
So how do we shine those lights into the pixels?
Display screens use hexadecimal numbers to represent lights or colors. Hexa means 16 decimal base number. So hexadecimal number is: 0123456789ABCDEF.
But we use our natural 10 decimal base number: 0123456789.
In other words, colors can be made using hexadecimal numbers: 0123456789ABCDEF and as well as using our natural 10 decimal base numbers: 0123456789.
Knowing that we can multiply 16 X 16 = 256.
Now since the number starts with a zero: 0, the total combinations of possible pixels to shine through is 255, hence rgb(255, 255, 255).
This means that three lights containing one red (r) gamut, one green (g) gamut, and one blue (b) gamut in combinations are shining through the pixels to make the color represents that combination.
So the next question is: how do we know what combination(s) to use to achieve a specific color?
Yes, this is a very good question that no one can tell you exactly what combination(s) to specify. It is merely a case of "trial and error" by first specifying the number, i.e., rgb(115, 209, 080), and have a look at the actual result to see what that combination turns out.
So basically, you just try to put in some numbers combination and take a look at the result of that combination to see if what you're looking for in color.
This is called one combination to generate one particular color: rgb(225, 190, 211) and this is another combination to generate another distinct color (by shining all pixels to lit "full on" makes that pixel white): rgb(255, 255, 255) or this is a white color combination.
So by just turning certain pixels on and off makes the color appears on the display screen.
As stated earlier, color schemes can be made using rgb decimal 10 number format or using hexadecimal number format.
Color schemes have two format: rgb(255, 255, 255) and the hexadecimal representation: #FFFFFF -- that is six digits of hexadecimal representation which is equal to 256 combinations.
In the six digits, you can specify any combination in hexadecimal representation: 0123456789ABCDEF.
For example, to generate a white color (by shining all pixels to lit "full on" makes that pixel white): FFFFFF, turn all pixels off makes it black: 000000, aqua: 00FFFF, red: FF0000, blue: 0000FF, etc.
When using these hexadecimal representation, don't forget to place # in front of it, i.e., a white color: #FFFFFF, black: #000000, aqua: #00FFFF, red: #FF0000, blue: #0000FF, etc.
Let's see how they're being used:
<style>
body
{
background-color: rgb(255, 255, 255); /** background color of the webpage **/
width: 100%;
color: #CCCCFF /** color of the text **/
}
p.one
{
border-style: solid;
border-color: red;
}
p.two
{
border-style: solid;
border-color: green;
}
p.three
{
border-style: dotted;
border-color: blue;
}
/**
* as you can see, the hexadecimal format needs to use "#" in front of
* the hexadecimal numbers.
*
* notice that you can use actual words to specify actual colors as well.
*/
</style>
So the key to remember when specifying the combination is that to use a number between 0 and 255 in the case of RGB in 10-base decimal numbers.
And between 0 to 9 and as well as between A to F in the case of hexadecimal numbers.
So there you have it: a very brief introduction to colors.
What is hierarchical data?
Hierarchical data is a data structure that relates to a parent-child relation in the database. A simplier way of saying is that, a hierarchical data structure is simply a data structure organized as a tree, in which in a tree, there is a node or base tree (Food in the illustration below) and then the branching out of the limbs. For example, if we have some products organized as a tree of product category hierarchy from a fictional grocery store, the hierarchical data structure looks like the following:
As you can see from the illustration above, the hierarchical data structure runs top to bottom with Food as the parent (or base) node, and Fruit and Meat as the immediate children of Food.
We can say that Food is the parent of both Fruit and Meat; Fruit is the parent of Red and Yellow; Red is the parent of Cherry; Yellow is the parent of Banana.
Likewise, Meat is the parent of Beef and Pork.
See the table below which lists the parent-child relation.
The hierarchical data structure is one of the most common data structures in programming. It represents a set of data where each item (except the root) has one parent node and one or more children nodes. Web programmers use hierarchical data for a number of applications, including content management systems, forum threads, mailing lists, and e-commerce product categorization.
If you're programming social media commenting application similar to what you see in most web sites, you definitely need to use a hierarchical data structure to manage and display your users' post comments in a hierarchical data structure manner.
How do you store/retrieve such hierarchical data in a database and display it in a hierarchical data structure?
Answer: see the table below which lists the parent-child relation.
There are two hierarchical data models to manage hierarchical data structure. They are called adjacency list model and nested set model.
Adjacency List Model for Hierarchical Data
First of all, we need to create a table to store these parent-child relational data hierarchical structure.
<?php
CREATE TABLE category (
category_id INT(10) AUTO_INCREMENT PRIMARY KEY,
category_name VARCHAR(50) NOT NULL,
parent_id INT(10) DEFAULT NULL
);
?>
Now let's insert some dummy data into the above table definition. For example:
<?php
// insert data into the 'category' table
INSERT INTO category VALUES(1, 'Food', NULL), (2, 'Fruit', 1), (3, 'Red', 2),
(4, 'Cherry', 3), ( 5, 'Yellow', 2), (6, 'Banana', 5),
(7, 'Meat', 1), (8, 'Beef', 7), (9, 'Pork', 7),
(10, 'Fish', 1), (11, 'Sammon', 10), (12, 'Shrimp', 10),
(13, 'Walley', 10);
SELECT * FROM category ORDER BY category_id;
+-------------+----------------------+--------+
| category_id | name | parent |
+-------------+----------------------+--------+
| 1 | Food | NULL |
| 2 | Fruit | 1 |
| 3 | Red | 2 |
| 4 | Cherry | 3 |
| 5 | Yellow | 2 |
| 6 | Banana | 5 |
| 7 | Meat | 1 |
| 8 | Beef | 7 |
| 9 | Pork | 7 |
| 10 | Fish | 1 |
| 11 | Sammon | 10 |
| 12 | Shrimp | 10 |
| 13 | Walley | 10 |
+-------------+----------------------+--------+
10 rows in set (0.00 sec)
?>
In this tutorial, we'll be using MySQL and PHP to accomplish the task.
If you look at the table definition earlier and the output of the query order by category_id, the parent id (parent) is actually a category id (i.e., Food = 1, Fruit = 2, Meat = 7, Fish = 10) of the parent category (Food).
This listing of hierachical tree parent-child arrangment is quite simple; it is easy to see parent-child relations. Furthermore, the tree path (breadcrumb) can be generated using a simple PHP function. For example:
<?php
// you pass in a category id: fruit, meat, etc.
public function get_path($category_id)
{
// look up the parent of this node, if fruit, it is 'Food'
$result = mysql_query("SELECT c1.parent_id, c2.category_name AS parent_name FROM category AS c1
LEFT JOIN category AS c2 ON c1.parent_id = c2.category_id
WHERE c1.category_id = '$category_id' ");
$row = mysql_fetch_array($result);
// save the path in this array
$path = array();
//continue if this node is not the root node
if ($row['parent_id'] != NULL)
{
// set the last part of the path to node - point it back to node
// end() sets the internal pointer of an array to its last element
end($path);
$last_key = key($path);
$key = $last_key==0 ? 0 : $last_key+1;
$path[$key]['category_id'] = $row['parent_id'];
$path[$key]['category_name'] = $row['parent_name'];
$path = array_merge(get_path($row['parent_id']), $path);
}
return $path;
}
?>
To print the path, just do the following:
<?php
// iterate over all of the array elements
for ($i = count($path) - 1; $i == 0; $i--)
{
echo $path[$i]['category_name']. '>';
}
?>
You have seen how to find the path from a leaf (node with no children) to the root node. Let's now see how to go down through the hierarchy -- i.e., start from the root element and display all nodes according to their hierarchical relations:
<?php
// this function is a recursive function which is being called by itself below!
// depending on your application or objective, you might not need to call this function manually at all!
public function display_children($category_id, $level)
{
// retrieve all children
$sql = "SELECT * FROM category WHERE parent_id = '$category_id'";
$query = $conn->prepare($sql);
$result = $query->setFetchMode(PDO::FETCH__ASSOC);
// display each child
while ($row = $result->fetch())
{
// indent and display the title of the category_name of this child
// if you want to save the hierarchy, replace the following line with your code
echo str_repeat(' ', $level) . $row['category_name'] . "<br/>";
// call this function again to display this child's children
display_children($row['category_id'], $level + 1);
}
}
?>
The adjacency list model has its disadvantages. One of them is that, it is hard to implement it using only database queries. SQL queries require that you know at which level the node resides.
A much better and robust alternative is the nested set model for hierarchical data.
Nested Set Model for Hierarchical Data
I'm little lazy, so I'm going to refer you to some excellent tutorials on the Web, which can explain better than I can. Here they are:
Managing Hierarchical Data in MySQL Handling Hierarchical Data in MySQL and PHPDisclaimer and credit: I wrote this book right around 2004-5 when ajax was just catching fire when people were talking about ajax as if it was the second coming of the birth of the internet. Yes, it was all the rage for quite some time in those days and continued for much of the first half of the millenial decade (up to 2015).
Now into the post millenial decade (starting in 2020 and beyond) it dies down quite a bit, but ajax is still very much relevant in today's programming and will still be quite relevant to the future as well.
Also, much of the materials in this book were based on articles written by my fellow Twin Citian native Brett McLaughlin of Saint Paul, Minnesota. Without the articles it wouldn't have been possible to write this book. I wouldn't know where to start, let alone finish the entire book. Needless to say, the articles were clearly acted as road maps for this book.
Ajax, which stands for Asynchronous JavaScript and XML, isn't a single technology or a conforming programming language like Pascal, Delphi, Java, C/C++, PHP, JavaScript, etc, but it's a Web development technique that includes the following:- HTML (Hypertext Markup Language) and DHTML (Dynamic Hypertext Markup Language) for standard-based presentation of the Web.
- XHTML (Extensible Hypertext Markup Language) and CSS (Cascading Style Sheet) for specialized-based presentation of the Web.
- DOM (Document Object Model) for dynamic display and interaction of the Web.
- XML (Extensible Markup Language) and XSLT (Extensible Stylesheet Language Transportation) for data interchange and manipulation of the Web.
- Asynchronous data retrieval of the Web using XMLHttpRequest.
- JavaScript, which binds everything together to make a technology called Ajax.
Ajax is a broswer-based technology that can communicates with the server. Its libraries, compiler, components, or plug-ins (which is called Ajax engine) is already built-in into the browser and already exists in the server technologies. In other words, its libraries, compiler, components, or plug-ins are actually HTML, DHTML, JavaScript, XML, CSS, XSLT, and DOM -- and those technologies are already built-in into the browser and are already exist in the server technologies. So to program in Ajax you simply write a browser-based program using mainly a conforming JavaScript programming language. [Conforming refers to syntactically correct. For example, to conform to a Javascript language, you have to write your code according to the Javascript syntax and rule--like lettercased are sensitive and variables are typeless, etc.; to conform to a Java language, you have to write your code according to the Java syntax and rule -- e.g., you must have a main() function to execute your program and lettercased are sensitive, etc.; to conform to a Delphi language, you have to write your code according to the Delphi syntax and rule -- e.g., all imported libraries must be listed in the section called UNIT, a function structure must begin with a keyword FUNCTION, a procedure structure must begin with a keyword PROCEDURE, and lettercased are insensitive ]. Those are the syntaxes and rules you have to conform to in order to program in any of those languages. But in Ajax, you have none of those specific syntaxes or rule to conform to -- you just use other languages syntaxes and rule to achieve your programming tasks.
Before I dig into what Ajax is, though, let's spend just a few moments understanding what Ajax does. When you write an application today (and as well as in the future), you have two basic choices (well, maybe three - mobile is the other one - but the core basic technology is just two: desktop and web):
- Desktop applications
- Web applications
These are both familiar; desktop applications usually come on a CD (or sometimes are downloaded from a Web site) and install completely on your computer. They might use the Internet to download updates, but the code that runs these applications resides on your desktop. Web applications -- and there's no surprise here -- run on a Web server somewhere and you access the application with your Web browser.
More important than where the code for these applications runs, though, is how the applications behave and how you interact with them. Desktop applications are usually pretty fast (they're running on your computer; you're not waiting on an Internet connection), have great user interfaces (usually interacting with your operating system), and are incredibly dynamic. You can click, point, type, pull up menus and sub-menus, and cruise around, with almost no waiting around.
On the other hand, Web applications are usually up-to-the-second current and they provide services you could never get on your desktop (think about Amazon.com and eBay). However, with the power of the Web comes waiting -- waiting for a server to respond, waiting for a screen to refresh, waiting for a request to come back and generate a new page.
Obviously this is a bit of an oversimplification, but you get the basic idea. As you might already be suspecting, Ajax attempts to bridge the gap between the functionality and interactivity of a desktop application and the always-updated Web application. You can use dynamic user interfaces and fancier controls like you'd find on a desktop application, but it's available to you on a Web application.
Chapter 1
Ajax Basics Tutorial
- Section 1.1 - Introduction
- Section 1.2 - The XMLHttpRequest Object
- Section 1.3 - Getting a Request Object
- Section 1.4 - Request/Response in an Ajax World
- Section 1.5 - A touch of jQuery
- Section 1.6 - A touch of cURL
- Section 1.7 - A touch of Financial Information eXchange (FIX) ot FIXML
- Section 1.8 - Conclusion
Section 1.1: Introduction
Ajax, which consists of HTML, JavaScript, DHTML, CSS, XSLT, and DOM, is an outstanding approach that helps you transform clunky Web interfaces into interactive Ajax applications. This book will demonstrate how these technologies [HTML, JavaScript, DHTML, and DOM] work together -- from an overview to a detailed look -- to make extremely efficient Web development an easy reality. The book also unveil the central concepts of Ajax, including the XMLHttpRequest object.
Ajax works by combining several technologies to function in a seamlessly intuitive manner. Instead of loading a Web page at the start of a session, the browser loads an Ajax engine, written in JavaScript and usually tucked away in a hidden frame. This Ajax engine is responsible for both rendering the interface the user sees and communicating with the server on the user's behalf.
The Ajax engine allows the user's interaction with the application to happen asynchronously -- independent of communication with the server. Every user action that would normally generate an HTTP request takes the form of a JavaScript call to the Ajax engine instead. Any response to a user action that doesn't require a trip back to the server -- such as simple data validation, editing data in memory and even some navagation -- the engine handles on its own.
If the engine needs something from the server in order to respond -- if it's submitting data for processing, loading additional interface code or retrieving new data -- it makes those requests asynchronously, usually using XML, without stalling a user's interaction with the application.
Old technology, new tricks
When it comes to Ajax, the reality is that it involves a lot of technologies -- to get beyond the basics, you need to drill down into several different technologies (as outlined in the introduction at the beginning of this book). The good news is that you might already know a decent bit about many of these technologies -- and better yet, most of these individual technologies (such as HTML, XHML, JavaScript, XML, CSS, etc) are easy to learn -- certainly not as difficult as an entire programming language like Pascal, Delphi, Java, C/C++, PHP, JavaScript, Ruby, etc.
|
Here (again) are the basic technologies involved in Ajax applications:
- HTML is used to build Web forms and identify fields for use in
the rest of your application.
- JavaScript code is the core code running Ajax applications and
it helps facilitate communication with server applications.
- DHTML, or Dynamic HTML, helps you update your forms
dynamically. You'll use
div,span, and other dynamic HTML elements to mark up your HTML.
- DOM, the Document Object Model, will be used (through JavaScript code) to work with both the structure of your HTML and (in some cases) XML returned from the server.
Let's break these down and get a better idea of what each does. I'll delve into each of these more in coming sections; for now focus on becoming familiar with these components and technologies. The more familiar you are with this code, the easier it will be to move from casual knowledge about these technologies to mastering each (and really blowing the doors off of your Web application development).
Section 1.2: The XMLHttpRequest ObjectThe first object you want to understand is probably the one that's newest to you and it's the most important one as far as Ajax programming is concern -- it's called XMLHttpRequest. This is a JavaScript object and is created as simply as shown below.
Create a new XMLHttpRequest Object:
<script language="javascript" type="text/javascript">
var xmlHttp = new XMLHttpRequest();
</script>
|
Remember that Ajax is not a conforming language, meaning that it doesn't have it own syntaxes or rules to abide by. Instead, it's a technology exists inside an Ajax engine which make use of the existing languages (HTML, DHTML, JavaScript, etc) and its technologies. As you can see in the code above, the Ajax code is written in JavaScript and don't be surprise if you don't see any code written in any other languages other than JavaScript [, HTML and sometimes jQuery] -- because JavaScript is the cornerstone of Ajax technology.
The code above declares a variable named xmlHttp and gives it the instance object of XMLHttpRequest() class. This instance of the object handles all your server communication.
Before you go forward, stop and think about that -- it's the JavaScript technology through the XMLHttpRequest object that talks to the server. That's not the normal application flow and it's where Ajax gets much of its magic.
In a normal Web application, users fill out form fields and click a Submit button. Then, the entire form is sent to the server, the server passes on processing to a script (usually PHP or Java or maybe a CGI process or something similar), and when the script is done, it sends back a completely new page.
That page might be HTML with a new form with some data filled in or it might be a confirmation or perhaps a page with certain options selected based on data entered in the original form. Of course, while the script or program on the server is processing and returning a new form, users have to wait. Their screen will go blank and then be redrawn as data comes back from the server.
This is where low interactivity comes into play -- users don't get instant feedback and they certainly don't feel like they're working on a desktop application.
Ajax essentially puts JavaScript technology and the XMLHttpRequest object between your Web form and the server. When users fill out forms, that data is sent to some JavaScript code and not directly to the server. Instead, the JavaScript code grabs the form data and sends a request to the server.
While this is happening, the form on the users screen doesn't flash, blink, disappear, or stall. In other words, the JavaScript code sends the request behind the scenes; the user doesn't even realize that the request is being made. Even better, the request is sent asynchronously, which means that your JavaScript code (and the user) doesn't wait around on the server to respond. So users can continue entering data, scrolling around, and using the application.
Then, the server sends data back to your JavaScript code (still standing in for the Web form) which decides what to do with that feeling to your application -- users are getting new data without their form being submitted or refreshed. The JavaScript code could even get the data, perform some calculations, and send another request, all without user intervention! This is the power of XMLHttpRequest.
It can talk back and forth with a server all it wants, without the user ever knowing about what's really going on. The result is a dynamic, responsive, highly-interactive experience like a desktop application, but with all the power of the Internet behind it.
Adding in some JavaScript
Once you get a handle on XMLHttpRequest, the rest of your JavaScript code turns out to be pretty mundane. In fact, you'll use JavaScript code for just a few basic tasks:
- Get form data: JavaScript code makes it simple to pull data out of your HTML form and send it to the server.
- Change values on the form: It's also simple to update a form, from setting field values to replacing images on the fly.
- Parse HTML and XML: You'll use JavaScript code to manipulate the DOM and to work with the structure of your HTML form and any XML data that the server returns.
Grab and set field values with JavaScript code:
<script language="javascript" type="text/javascript">
// Get the value of the "phone" field and stuff it in a variable called phone
let phone = document.getElementById("phone").value;
// Set some values on a form using an array called response
// don't worry if you don't understand the assigning of array
// value response to variables order and address.
// It will be explained a little bit later.
// For example: response = obj.responseText;
document.getElementById("order").value = response[0];
document.getElementById("address").value = response[1];
</script>
|
There's nothing particularly remarkable here and you should start to realize that there's nothing tremendously complicated about this. Once you master XMLHttpRequest, much of the rest of your Ajax application will be simple JavaScript code like that shown above, mixed in with a bit of clever HTML. Then, every once in a while, there's a little DOM work...so let's look at that.
Finishing off with the DOM
Last but not least, there's the DOM, the Document Object Model. For some of you, hearing about the DOM is going to be a little intimidating -- it's not often used by HTML designers and is even somewhat unusual for JavaScript coders unless you're really into some high-end programming tasks. Where you will find the DOM in use a lot is in heavy-duty Java and C/C++ programs; in fact, that's probably where the DOM got a bit of its reputation for being difficult or hard to learn.
Fortunately, using the DOM in JavaScript technology is easy, and is mostly intuitive. At this point, I'd normally show you how to use the DOM or at least give you a few code examples, but even that would be misleading. You see, you can get pretty far into Ajax without having to mess with the DOM and that's the path I'm going to show you. I'll come back to the DOM later in the book, but for now, just know that it's out there. When you start to send XML back and forth between your JavaScript code and the server and really change the HTML form, you'll dig back into DOM. For now, it's easy to get some effective Ajax going without it, so put this on the back-burner for now.
Section 1.3: Getting a Request Object
With a basic overview under your belt, you're ready to look at a few specifics. Since XMLHttpRequest is central to Ajax applications -- and probably new to many of you -- I'll start there.
As of right now you know a little bit about XMLHttpRequest, and you should be able to create this object and use it with ease. But there something else you should know before proceeding to use the XMLHttpRequest object you'd just created.
Remember those high-profile pesky browser wars [in the latter half decade of the 1980's and continued endlessly] between Microsoft and Netscape where Microsoft wants to dominate the browser market by making its IE browser incompatible with Netscape Navagator and others and how nothing worked the same across browsers?
Well, believe it or not, those wars are still going on beyond the millenial decade as well, albeit on a much smaller scale. And, surprise: XMLHttpRequest is one of the victims of this war. So you'll need to do a few different things to get an XMLHttpRequest object going. I'll take your through it step by step.
Working with Microsoft browsers
Microsoft's browser, Internet Explorer, uses the MSXML parser for handling XML.
So when you write Ajax applications that need to work on Internet Explorer, you need to create the object in a particular way. However, it's not that easy. MSXML actually has two different versions floating around depending on the version of JavaScript technology installed in Internet Explorer, so you've got to write code that handles both cases.
For the code that you need to create an XMLHttpRequest on Microsoft browsers, follow the example below.
Create an XMLHttpRequest object on Microsoft browsers
<script language="javascript" type="text/javascript">
var xmlHttp = false;
try
{
xmlHttp = new ActiveXObject("Msxml2.XMLHTTP");
}
catch (e)
{
try
{
xmlHttp = new ActiveXObject("Microsoft.XMLHTTP");
}
catch (e2)
{
xmlHttp = false;
}
}
</script>
|
All of this won't make exact sense yet, but that's OK. You'll dig into JavaScript programming, error handling, conditional compilation, and more as you progress deeper and deeper into this book. For now, you want to get two core lines into your head:
xmlHttp = new ActiveXObject("Msxml2.XMLHTTP");
and
xmlHttp = new ActiveXObject("Microsoft.XMLHTTP");
As you can see, Microsoft has two versions of MSXML for whatever the reasons were: Msxml2 probably the enhanced version and Msxml probably the older version. Anyhow, this code tries to create the XMLHttpRequest object using one version of MSXML; if that fails, it then creates the XMLHttpRequest object using the other version. If neither of these work, the xmlHttp variable is set to false, to tell your code that something hasn't worked. If that's the case, you've probably got a non-Microsoft browser and need to use different code to do the job. Now we need to write code to look for non-Microsoft browsers.
Dealing with Mozilla and non-Microsoft browsers
If Microsoft's Internet Explorer isn't your browser of choice or you write code for non-Microsoft browsers, then you need different code. In fact, this is the really simple line of code you saw back in section 1.2. To refresh your memory, here is again the code:
var xmlHttp = new XMLHttpRequest();
You see how simple this one line of code is?
This much simpler line creates an XMLHttpRequest object in Mozilla, Firefox, Safari, Opera, and pretty much every other non-Microsoft browser that supports Ajax in any form or fashion.
With all possible browser compatibility is settled, it's time to put all the code together. The key is to support all browsers. Who wants to write an application that works just on Internet Explorer or an application that works just on non-Microsoft browsers? Worse yet, do you want to write your application twice? Of course not! So your code combines support for both Internet Explorer and non-Microsoft browsers. The following shows the code to do just that.
Create an XMLHttpRequest object the multi-browser way:
<script language="javascript" type="text/javascript">
/* Create a new XMLHttpRequest object to talk to the Web server */
var xmlHttp = false();
/*@cc_on @*/
/*@if (@_jscript_version >= 5)
try
{
//try to create one of Microsoft's older browser version
xmlHttp = new ActiveXObject("Msxml2.XMLHTTP");
}
catch (e)
{
try
{
//the above code fail, so try to create a new version of MS browser
xmlHttp = new ActiveXObject("Microsoft.XMLHTTP");
}
catch (e2)
{
xmlHttp = false;
}
}
@end @*/
if (!xmlHttp && typeof XMLHttpRequest != 'undefined')
{
//No MS browser found, so create a non-MS multi-browsers object
xmlHttp = new XMLHttpRequest();
}
</script>
|
For now, ignore the commenting and weird tags like @cc_on; those are special JavaScript compiler commands (called directives) which directs the flow of code to specific block. In this case, it basically says that if one of Microsoft's browser versions is found, don't execute the non-Microsoft browsers block of code. You'll learn more about compiler directives as you progress deeper into this book. For now, let's continue with our XMLHttpRequest discussion. The core of this code breaks down into three steps:
- Create a variable, xmlHttp, to reference the XMLHttpRequest object that you will create.
- Try and create the object in Microsoft browsers:
- Try and create the object using the Msxml2.XMLHTTP object.
- If that fails, try and create the object using the Microsoft.XMLHTTP object.
- Try and create the object using the Msxml2.XMLHTTP object.
- If xmlHttp still isn't set up, create the object in a non-Microsoft way.
|
Today's browsers offer users the ability to crank their security levels up, to turn off JavaScript technology, and disable any number of options in their browser. In these cases, your code probably won't work under any circumstances. For these situations, you'll have to handle problems gracefully -- that's at least one section of topic in itself, one I will tackle later in this book. For now, you're writing robust, but not perfect, code, which is great for getting a handle on Ajax. You'll come back to the finer details later. |
Here is a much cleaner and simpler code (below). This simpler version of the browser initialization works just as good as the version that just described above; as a matter of fact, nowaday no one in the right mind would still use the older versions of MS browser. Besides, today's operating systems would not even support such outdated older browser versions anyway, and that's why this simpler code below is very popular among programmers. The code above was for educational purpose only to point out all the possibilities that older browsers may exist; however, in reality, there is a very slim chance that anyone is still using older browsers. For that reason, it makes more sense to write code as cleanly as possible--and the code below does just that.
It starts off by initializing the variable xmlHttp to false (or no object or no specific browser in mind), and then it tests to see if the user's browser is a non-MS browser. If that fails, it tests to see if the user's browser is one of MS's newer versions of the browser. It assumes that older versions are outdated, which is a good assumption in today's technology evolution. Thus, the chance of creating a MS browser is very sure in this testing code block. If for some reason it fails, the code just fail silently or a message box displaying: "unknown browser."
<script language="javascript" type="text/javascript">
/* Create a new XMLHttpRequest object to talk to the Web server */
var xmlHttp = false;
if (document.window.XMLHttpRequest)
{
//creating a non-MS browser object
xmlHttp = new XMLHttpRequest();
}
else if (document.window.ActiveXObject)
{
// this is the newer MS browser object and not even
// bother to test for older versions.
// not only that Microsoft has dropped the other older
// version completely and is rallying around this new
// enhanced, up-to-date version.
// so Microsoft is maintaining this version to the
// distance future.
xmlHttp = new ActiveXObject("Microsoft.XMLHTTP");
}
else
{
document.write("unknown browser");
}
</script>
|
A good programming practice is to write code as cleanly and effeiciently as possible. So the browser initialization just described is a good candidate for outsourcing it to a different component or function or file. For example, you can write either version of the code above as a function and call it from anywhere in your program. For example:
<html>
<head>
<title>Browser Initialization</title>
<script language="JavaScript" type="text/javascript">
function getxmlHttp()
{
/* Create a new XMLHttpRequest object to talk to the Web server */
var xmlHttp = false;
if (document.window.XMLHttpRequest)
{
//creating a non-MS browser object
xmlHttp = new XMLHttpRequest();
}
else if (document.window.ActiveXObject)
{
// this is the newer MS browser object and not even
// bother to test for older versions
xmlHttp = new ActiveXObject("Microsoft.XMLHTTP");
}
else
{
document.write("unknown browser");
}
}
// Now, you can call this function just once in every program to create an
// object. Ignore some of the ready states for now; it will be discussed shortly.
// Notice also the var declaration to signify as a global variable.
var obj = getxmlHttp(); // create an object defined above
// Create the callback:
obj.onreadystatechange = function()
{
if (obj.readyState != 4)
{
return; // Nothing is returned ... not ready state yet
}
if (obj.status != 200)
{
// Returns nothing ... handle request failure here...
return;
}
// Request successful, read the response
var response = obj.responseText;
// Here you do whatever you need to do with response variable ...
}
</script>
</head>
</html>
|
Here is another example that works as well as the above code:
<html>
<head>
<title>Browser Initialization</title>
<script language="JavaScript" type="text/javascript">
function getxmlHttp()
{
/* Create a new XMLHttpRequest object to talk to the Web server */
var xmlHttp = false;
if (document.window.XMLHttpRequest)
{
//creating a Firefox, Safari, and other non-MS browser objects
xmlHttp = new XMLHttpRequest();
}
else if (document.window.ActiveXObject)
{
// this is the newer MS browser object and not even
// bother to test for older versions
xmlHttp = new ActiveXObject("Microsoft.XMLHTTP");
}
else
{
document.write("unknown browser");
}
return xmlHttp;
}
// Now, you can call this function just once in every program to create an
// object. Ignore some of the ready states for now; it will be discussed shortly:
var obj = getxmlHttp(); // create an object defined above
// Create the callback:
obj.onreadystatechange = function()
{
if (obj.readyState != 4)
{
return; // Nothing is returned ... not ready state yet
}
if (obj.status != 200)
{
// Returns nothing ... handle request failure here...
return;
}
// Request successful, read the response
var response = obj.responseText;
// Here you do whatever you need to do with response variable ...
}
</script>
</head>
</html>
|
Section 1.4: Request/Response in an Ajax World
The following illustration shows the process flow in a typical Ajax application flow:
The main premise about Ajax that you have to understand and keep in mind as you go on for the remaining of this book is that it's about Request/Response. Every time you write an Ajax application, you'll have to deal with Request/Response model and you should seperate those two (Request and Response) in your mind as you work through your application. Think of it as a Client-Server model where you use client programming languages (mainly HTML and Javascript) to make request, and use server-side programming languages (like PHP, ASP, Perl, Python, Ruby on the Rail, etc.) to response to the client's request.
So you now understand Ajax and have a basic idea about the XMLHttpRequest object and how to create it. If you've read closely, you even realize that it's the JavaScript technology that talks to any Web application on the server rather than your HTML form being submitted to that application directly.
What's the missing piece?
How to actually use XMLHttpRequest. Since this is critical code that you'll use in some form in every Ajax application you write, take a quick tour through what a basic request/response model with Ajax looks like.
Making a request
You have your shiny new XMLHttpRequest object; now take it for a spin. First, you need a JavaScript method that your Web page can call (like when a user types in text or selects an option from a menu). Then, you'll follow the same basic outline in almost all of your Ajax applications and it follows in the following order:
- Get whatever data you need from the Web form.
- Build the URL to connect to.
- Open a connection to the server.
- Set up a function for the server to run when it's done.
- Send the request.
Make a request with Ajax.
<script language="javascript" type="text/javascript">
function callServer()
{
let xmlHttp = new XMLHttpRequest();
// Get the city and state from the web form
let city = document.getElementById("city").value;
let state = document.getElementById("state").value;
// Only go on if there are values for both fields
if ((city == null) || (city == ""))
return;
if ((state == null) || (state == ""))
return;
// Build the URL to connect to
let url = "/script/getZipCode.php?city=" + escape(city) +
"&state=" + escape(state);
// Open a connection to the server
xmlHttp.open("GET", url, true);
// Setup a function for the server to run when it's done
xmlHttp.onreadystatechange = updatePage;
// Send the request
xmlHttp.send(null);
}
</script>
|
A lot of this is self-explanatory. The first bit of the code uses basic JavaScript code to grab the values of a few form fields. getElementById() is a JavaScript method that stores/returns a form field. In PHP, this (getElementById()) method is equivalent to the global variable _POST[], _GET[], or _REQUEST, which grabs the values of a few form fields. Next, it constructs a url to connect to the server.
Please note that you need to use a complete url of the remote host you're trying to connect to, such as http://www.remotehostexample.com/. And as well as any folder/directory names followed by the script name. For example, http://www.remotehostexample.com/local_folder/scriptname.php. The example url's shown in this book omit the full and proper url details. Self-explanatory!
More about the JavaScript getElementById() method. The variable name inside the double quotes ("....") is the field name of the input field. For example, the city, state, phone, email, username fields are listed in the input fields of the form as follows:<FORM name="example" method="POST" action="local-folder/script.php">
<INPUT type="text" name="city" value="" size="25">
For state:
<INPUT type="text" name="state" value="" size="25">
For phone:
<INPUT type="text" name="phone" value="" size="10">
For email:
<INPUT type="text" name="email" value="" size="25">
For username:
<INPUT type="text" name="username" value="" size="25">
</FORM>
The code tests to if the fields don't exist or are empty. If any of the field doesn't exist or is empty (in the case of a user forgot to enter something), the code exits quietly. But if the all the fields exist and contain values (in the case of a user entered something in all the fields), the code proceeds to grab the values of a few form fields, and then sets up a PHP script as the destination to connect to.
Notice how the URL of the script is specified and then the city and state (from the form) are appended to this using simple GET parameters. Next, a connection is opened; here's the first place you see XMLHttpRequest in action again. The method of connection is indicated (GET), as well as the URL to connect to. The final parameter, when set to true, requests a asynchronous connection (thus making this Ajax). If you used false, the code would wait around on the server when the request was made and not continue until a response was received.
By setting this to true, your users can still use the form (and even call other JavaScript methods) while the server is processing this request in the background. The onreadystatechange property of xmlHttp (remember, that's your instance of the XMLHttpRequest object) allows you to tell the server what to do when it does finish running (which could be in five minutes or five hours).
Since the code isn't going to wait around for the server, you'll need to let the server know what to do so you can respond to it. In this case, a specific method -- called updatePage() -- will be triggered when the server is finished processing your request. Finally, send() is called with a value of null. Since you've added the data to send to the server (the city and state) in the request URL, you don't need to send anything in the request. So this fires off your request and the server can do what you asked it to do. More about send() later, but briefly, send() can send files as well attached as an argument inside send().
Notice how straightforward and simple this is! Other than getting the asynchronous nature of Ajax into your head, this is relatively simple stuff. You'll appreciate how it frees you up to concentrate on cool applications and interfaces rather than complicated HTTP request/response code.
The code you just saw is about as easy as it gets. The data is simple text and can be included as part of the request URL. GET sends the request rather than the more complicated POST. You'll learn how to send a request to server via POST array later in this book. For now, as you can see, there's no XML or content headers to add, no data to send in the body of the request -- this is Ajax Utopia, in other words.
Things will become more complicated as we progress deeper in this book. Just make sure that you understand what's already discussed, because you'll need the knowledge you'd learned thus far for the rest of this book. You'll learn how to send POST requests, how to set request headers and content types, how to encode XML in your message, how to add security to your request -- the list is pretty long!
Handling the Response
Now you need to actually deal with the server's response. You really only need to know two things at this point:
- Don't do anything until the xmlHttp.readyState property is equal to 4.
- The server will stuff it's response into the xmlHttp.responseText property.
The second item -- using the xmlHttp.responseText property to get the server's response -- is very easy. The server will stuff it's response values (city/state) into the xmlHttp.responseText property when it finishes processing. The following example shows an example of a method that the server can call based on the values sent in (or typed in form fields by users).
In other words, this method (updatePage()) gets called when certain values are entered in the form fields (effectively sent in to the server), because this method (updatePage()) is set up to get called when the server finished processing data:
xmlHttp.onreadystatechange = updatePage;
Handle the Server's Response
<script language="javascript" type="text/javascript">
function updatePage()
{
if (xmlHttp.readyState == 4)
{
let response = xmlHttp.responseText;
document.getElementById("zipCode").value = response;
}
}
</script>
|
Again, this code isn't so difficult or complicated. It waits for the server to call it with the right ready state and then uses the value that the server returns (in this case, the user-entered city and state) to set the value of another form field called zipCode field. You might ask: why set a user-entered field value into another user-entered text field?
The answer is that: there is no particular reason for doing so other than to demonstrate the responsiveness of Ajax technology at work. I could have stuffed those user-entered values into a database, a file, or simply displaying them to the outside world if I chose to. I intentionally chose to do what I did for two reasons: to keep things in the example simple and to show you that sometimes you want users to be able to override what a server says. Keep both in mind; they're important in good user-interface design.
In the example once the server returns the values of city/state as a result of the users entered into the fields ("city" and "state"), the updatePage() method sets that field (zipCode) value with the value of city/state that it got from the users, resulting the zipCode field suddenly appears with the new value instantly without the user ever having to click a button!. That's the Ajax form of technology and the desktop application feel I talked about earlier. The instance response of the interactivity.
Observant readers might notice that the zipCode field is a normal text field in which no event triggering method attached to it and no button for users to press. You could obviously add a button to your HTML form, but that's pretty 2001 (pre-Ajax, old programming technique), don't you think? Here it is what I'm talking about:
<HTML>
<form>
<p>City: <input type="text" name="city" id="city" size="25"
onChange="callServer();" /></p>
<p>State: <input type="text" name="state" id="state" size="25"
onChange="callServer();" /></p>
<p>Zip Code: <input type="text" name="zipCode" id="zipCode" size="5" /></p>
</form>
</HTML>
|
What's so special about the form above?
Actually, not much -- it's just a typical HTML form with event handler attached to the fields -- that's all. But behind the scene there is a lot going on -- an Ajax engine at work. Behind the scene there is an Ajax engine telling a JavaScript method to grab information that the user put into a form, sends it to the server, provides another JavaScript method to listen for and handle a response, and even sets the value of a field when that response comes back.
If this feels like yet one more piece of fairly routine code, then you're right -- it is! There is nothing special about the code shown thus far. When a user puts in a new value for either the city or state field, the callServer() method fires off and the Ajax engine begins.
Notice also that the form doesn't contain the usual 'method' attribute, which is for specifying either a GET or a POST request. And the form doesn't even contain the important attribute called action for specifying the url to send the form to for processing. What is going on?
Well, the form doesn't need any of those two attributes in an Ajax world because all of the required attributes are being done in the callServer() method. And as stated above, the form doesn't contain a submit button to press to send the form to the server either.
If you look back at the beginning of this section 1.4, you'll see this callServer() method does all the work of specifying the two attributes and everything else that needed to be done. This is the heart and soul of Ajax.
Section 1.5: A touch of jQueryA request/response model can be accomplished using jQuery and cURL as well. We'll tackle a request/response model using cURL in the next section. But first, in this section, we'll illustrate the request/response model using jQuery.
Please check out the complete guide at the site: jQuery Ajax
The following is just a brief tutorial on the subject of jQuery Ajax.
<?php
/**
* here, it starts with '$' -- the jquery variable
* next, it calls the jquery function: ajax()
* this is the main jquery function similar to XMLHttpRequest() in Ajax
*
* just like any other programming languages, jquery has many functions at
* its disposable. please check out the guide mention above to learn more.
*
* just like XMLHttpRequest() in Ajax, jquery's ajax() function gets used on
* virtually every script you write. it's the core central function of jquery.
*
* if you look in the example below, you'll see two funtions: ajax() and done()
*
* all jquery scripts must start with ajax() function and if you have more
* functions they have to be chained to the ajax() function one after another.
*
* as you can see below, function done() is chained to function ajax() using
* the dot '.' notation.
* inside the function ajax() is where you do all of the request/response model.
*
* likewise, inside function done() is where you do all of your finishing code.
*
* inside any function contains an array denoted by {}, similar to json array: {}
*
* casual observer would notice that curly brackets are being used as an array and
* as a body of the function as well.
*
* if you look inside ajax() it contains blocks of code surrounded by the array {}
* this is the array using curly brackets {} similar to json array: {}
*
* on the other hand, a function, including ajax(), can contain other (anonymous)
* functions as well.
*
* you already know that any function, including anonymous functions, must contain
* a body of a function, which is denoted by {} brackets.
*
* this is shouldn't be a surprise to any of you.
*
* inside ajax() it contains blocks of code surrounded by the array {} but with
* some exceptions. for example, url and content are two examples of exceptions,
* in this case.
*
* url is the url of the remote host that you want to connect to.
* beforeSend is the code block you do before you send it to the server, such as
* code initialization of the header.
*
* content block contains the content that you want to send to the server.
* please check out the guide to learn more about these and others as well.
*/
$.ajax(
{
/* notice that {} denote as an array */
/* actually jquery adopts a json programming construct using curly */
/* brackets {} to denote as an array construct */
/* basically, ajax() function contains an array, for example: ajax({}) */
/* the curly brackets {} denote as an array construct */
/* if look closely inside the {}, you'll see key/value pairs which constitute */
/* as an array construct and sometimes multi-dimension array construct. */
/* as you can see, 'url' is the array key and the right side of ":" is the value. */
/* likewise, 'beforeSend' is the key and the anonymous function is the value */
/* did I mention somewhere this website that Javascript language is the */
/* most difficult to learn? */
/* all of these code are Javascript code. Jquery is a descendant of Javascript. */
/* okay, try to make sense of the code in the ajax() function on your own: */
url: "https://www.example.com/test.php",
/* no curly brackets {} except for the function beforeSend */
beforeSend: function( xhr )
{
xhr.overrideMimeType( "text/plain; charset=x-user-defined" );
},
/* notice that you can omit the curly brackets {} as well */
/* well, think of it this way: it's a key/value pair */
context: document.body,
/* no curly brackets {} except for the function success */
/* well, think of it this way: it's a key/value pair */
success: function (data, status, xhr)
{
// success callback function being displayed to the paragraph tag <p>
$('p').append(data);
},
/* no curly brackets {} except for the function error */
/* well, think of it this way: it's a key/value pair */
error: function (jqXhr, textStatus, errorMessage)
{
// error callback being displayed to the paragraph tag <p>
$('p').append('Error: ' + errorMessage);
},
/* notice the curly brackets {} are being used */
/* well, think of it this way: it's a key/value pair */
statusCode:
{
404: function()
{
alert( "page not found" );
}
}
).done(function()
{
$( this ).addClass( "done" );
}
);
// Or it can be written as the following.
// Notice that both ajax() and done() are aligned at the same indentation.
// I prefer this style better moving the chain dot '.' to the beginning line.
// It's much mor cleaner when code gets lengthy and complex!
$.ajax(
{
url: "test.html",
context: document.body
}
)
.done(function()
{
$( this ).addClass( "done" );
}
);
// notice that done() function is chained to the ajax() function and
// if you have more functions, they have to be chained one after another
// following ajax() function.
?>
Again, this is just a brief overview of the request/response model using jQuery. For more check out the guide mentioned earlier.
Section 1.6: A touch of cURLIn the previous sections we saw a request/response model using Ajax and jQuery; and in this section, we'll see how cURL can be used as a request/response model to transfer data just like Ajax and jQuery.
Please note that this is just a brief overview of the request/response model using cURL. For more, please check out my tutorial called an introduction to cURL and as well as the guides/tutorials on the web.
cURL (or client URL) is a request/response model or protocal that enables to send and receive data to and from the server. In other words, you can use cURL to transfer data to the server and the server will return the data you requested back to you (or more specifically, your client application, hence the word client in cURL). It's a request/response transfer protocol or model!
Typically, you made a request to the server using a client-side programming language like Javascript and then you need a server-side script like PHP to response to it and parse it and process it and then send back the response to the client.
But in a cURL script, it is a server-side language PHP acting as a client-side script using cURL to make a request to the server-side language like PHP. Make note: PHP is making a request to a server-side language PHP.
So PHP is sort of both a server-side and a client-side language -- making use CURL, which stands for "Client URL", as a client-side language.
Now the whole examples below are making some requests to server scripts (in the below cases: some_remote_file.html and www.ladygaga.com).
These two files (some_remote_file.html and www.ladygaga.com) are server-side scripts that reside in the servers somewhere. You could rename this some_remote_file.html to some_remote_file.php and it will work just fine. And you could add a server-side script to this file www.ladygaga.com as www.ladaygaga.com/myscript.php and it will executes myscript.php and it will work just fine.
So the point is: PHP is sort of both a server-side and a client-side language -- making use cURL to enable as a client-side language.
You will encounter that cURL is a very popular usage among financial transactions (such as credit card transactions) used by payment processing companies like Visa, Mastercard, PayPal, Stripe, and Authorize.NET, etc.
To transfer data using cURL or to fetch/retrieve data using cURL, you have to write a client script using client-side script called cURL and a server-side language like PHP to response to the client-side language.
In other words, to make a request to the server you use PHP script that makes use cURL, and to response to cURL script, you use PHP script (which is a server-side script) to send back the content requested by the client script.
Do you see what's going on here?
PHP is sort of both a server-side and a client-side language -- making use cURL to enable as a client-side language.
In this tutorial, we'll use PHP as the server-side scripting language to response to the client-side language cURL.
Let's see some examples with explanations accompanying the illustration. Let's try to retrieve the content of a remote website: any content that appears on the remote website, it's a fair game!
All we need is the url of the remote website and we can get all of the content in the remote website.
In order to download the contents of a remote web site, we need to define the following options:
- CURLOPT_URL: Defines the remote URL.
CURLOPT_RETURNTRANSFER: Enables the assignment of the data that we download from the remote site to a variable, i.e., $result. When we print the value of the variable $result to the screen, we will see the picture/content of a web site being displayed.
The options can be written more compactly using curl_setopt_array(), which is a cURL function that convenes the options into an array.
Okay, let's putting things together. Notice that this example shows a very minimal options that are available. There are lots of options available to set, but for the sake of simplicity, we'll just use the very absolute minimum options. But first, here is a typical skeleton of the cURL script:
<?php
$url = __DIR__ . DIRECTORY_SEPARATOR . "some_remote_file.html";
/**
* initializing curl.
* this is like creating a constructor in other programming
* languages. when this line is executed it will go through a
* series of code initialization.
*
* remember a constructor in other programming languages is an "empty"
* function that contains nothing! no code! nothing!
* as you can see below, it contains nothing!
* this is by design so that you can put initialization code inside it so
* it can execute your code to initialize it! simple enough!
*
* if you look closely below, you'll see code like this: curl_setopt_array($curl, [])
* you provide the code to initialize contains in the array construct []
* curl_setopt_array() is an array and it will pair the two arguments and goes to work
* to initialize the code you provide in the array construct []
*/
$curl = curl_init();
/**
* after all of initialization has been done, it opens a
* connection to the url you provided in variable $url.
* the 'w' is to signify to the file protocol that we want
* to send (or 'w'rite to) the remote file (or website).
*/
$fileHandle = fopen($url, "w");
/**
* CURLOPT_URL is the option containing the remote url.
*
* CURLOPT_HEADER is the option containing the client header,
* the header that this browser sends to the remote host.
*
* CURLOPT_RETURNTRANSFER is the option to specify that we
* want cURL to return the requested content back to us.
* setting CURLOPT_RETURNTRANSFER to true does the job.
*
* sometimes, we just want to send the content to the
* remote host and never want to get anything back; for example,
* when you connect to a remote host to use its API services
* such as using PayPal credit card payment API, Stripe credit card
* payment API or a stock trading API from some of the brokerage services,
* you don't need to receive the content back through this client
* request initiation.
*
* instead, you just want to connect to the remote host and access their
* API content that is storing in the remote host's server.
*
* in that case, set it to false because you don't want the server to
* send back the whole API content via the internet.
* besides, the remote host would not allow you to do that in the first place.
*
* CURLOPT_FILE option is to allow us to send and receive
* files. in cURL, we can send any content including
* files. using CURLOPT_FILE option allow us to send and
* receive files.
*/
curl_setopt_array($curl, [
CURLOPT_URL => $url,
CURLOPT_HEADER => true,
CURLOPT_RETURNTRANSFER => true,
CURLOPT_FILE => $fileHandle
]
);
/**
* after all of options have been set, it's time to
* send the request to cURL to do its job.
*
* if you think of it, cURL is like other languages where they have classes.
* classes have three attributes: 1st, 2nd, 3rd, but cURL has two attributes:
* 1st attribute is the initialization and the 2nd attribute is the function curl_exec()
*
* the purpose of the 1st attribute is to initialize the code and the purpose of the 2nd
* attribute is to calculate and manipulate the 1st attribute.
*
* simple enough?
*
* now the call to curl_exec() executes the cURL engine.
*/
$result = curl_exec($curl);
// after that, we can close the cURL engine
curl_close($curl);
/**
* after the close of the cURL engine, it's time to
* get the content sent back by cURL engine.
*
* $result contains the response from the server.
*
* the response from the server contains a long string.
*
* so you would have to format how your content to be
* sent back to the client.
*
* this means that in your remote host script that does all
* of the responses to your client's requests would need to
* format the long string using delimiters, i.e., '|', '&', '#', etc.
*
* how you format your content to be sent back is up to you.
* and once you get the content, you can unravel/unformat your
* content accordingly.
*/
echo $result;
?>
As you can see, it is very easy to use cURL script to transfer data to and from the remote host.
Let's see a real example using cURL script to retrieve the content of a remote website: any content that appears on the remote website, it's a fair game, including a web site of singer Lady Gaga!
In this example, the content data of Lady Gaga's website is assigned to the variable $result. For example:
<?php
$curl = curl_init();
/**
* after all of initialization has been done, we can set
* all of the options needed inline.
*
* these options will connect our client to the remote host
*/
curl_setopt($curl, CURLOPT_URL, "https://www.ladygaga.com");
curl_setopt($curl, CURLOPT_RETURNTRANSFER, true);
curl_setopt($curl, CURLOPT_HEADER, false);
$result = curl_exec($curl);
// after that, we can close the cURL engine
curl_close($curl);
/**
* when we echo the value of the variable $result to
* the screen, we will see the picture/content of a web site
* of singer Lady Gaga.
*
* give it a try and see what happens!
*/
echo $result;
?>
cURL script is a very powerful tool for transfering data and receiving data back from the remote host. Please Google the term cURL to learn more using your favorite client-side languages of your choice.
Again, this is just a brief overview of the request/response model using cURL. For more check out the guides/tutorials mentioned earlier.
Now you have choices to transfer data using a request/response model. The above examples can be achieved using Ajax like shown in the following:
<script language="javascript" type="text/javascript">
/** this section part of the code is for browser initialization **/
/* Create a new XMLHttpRequest object to talk to the Web server */
var xmlHttp = false;
if (document.window.XMLHttpRequest)
{
//creating a non-MS browser object
xmlHttp = new XMLHttpRequest();
}
else if (document.window.ActiveXObject)
{
// this is the newer MS browser object and not even
// bother to test for older versions
xmlHttp = new ActiveXObject("Microsoft.XMLHTTP");
}
else
{
document.write("unknown browser");
}
if (!xmlHttp)
{
alert("Error initializing XMLHttpRequest!");
}
/** this section part of the code is the response from the server **/
xmlhttp.onreadystatechange = function()
{
// object variable 'this' refers to an xmlHttpRequest object
// you could also just use the already initialized variable 'xmlhttp' object
if (this.readyState == 4 && this.status == 200)
{
var myObj = JSON.parse(this.responseText);
/**
* now variable myObj contains the decoded Javascript data object that looks
* like this:
*
* {"name" : "John Doe", "email" : "john@doe.com", "occupation" : "Programmer"}
*
* now that looks just like the encoded JSON data structure.
* yes, that is Javascript object.
*
* now you can access the decoded Javascript data object by referring to its
* object keys.
* for example: myObj.name, myObj.email, myObj.occupation, etc.
*
* below, assuming you have an HTML element that has an id attribute called "test",
* you can populate data like the following:
*/
document.getElementById("test").innerHTML = myObj.name;
}
};
/** this section part of the code is for pre-sending initialization **/
// right here, we are requesting server-side script: test.php
// notice also that we're using GET instead of POST
// we're not sending anything to the server -- we're only requesting from the server
// if you want to use POST instead of GET it is very easy to modify.
// see examples shown later and as well as examples in chapters 10 and 11
// of course, for the url, you need to specify a complete url path:
// http://www.example.com/local/directory/folder/test.php
xmlhttp.open("GET", "test.php", true);
/** this section part of the code is for the actual sending the request **/
// after that, we can just go ahead and send the request to the server
xmlhttp.send();
</script>
A very simple CURL script to send data to the server endpoint to charge the credit card.
<?php
// get the customer's credit card info from HTML form that the customer filled out in the form fields
$firstName = $_POST['firstname'];
$lastName = $_POST['lastname'];
$address = $_POST['address'];
$city = $_POST['city'];
$state = $_POST['state'];
$zip = $_POST['zip'];
$ccNumber = $_POST['ccNum'];
$month = $_POST['expiryMonth'];
$year = $_POST['expiryYear'];
$CVNnum = $_POST['CVNnumber'];
$amount = '129.95';
$nv_field = [
"customer_card_num" => $ccNumber,
"card_exp_month" => $month,
"card_exp_year" => $year,
"card_cvv" => $CVNNum,
"charge_amount" => $amount,
"customer_first_name" => $firstName,
"customer_last_name" => $lastName,
"customer_address" => $address,
"customer_city" => $city,
"customer_state" => $state,
"zip_code" => $zip,
];
$field = array();
foreach ($nv_field as $key => $value)
{
$field .= "$key=" . urlencode( $value ) . "&";
}
// CURLOPT_POST which turns HTTP POST on,
// and CURLOPT_POSTFIELDS which contains an array of our post data to submit.
// this array data can be used to submit data ($field) to the endpoint payment processor.
# this is the endpoint url to send this credit card info to get charged
$enpoint_payment_processor_url = "http://www.enpoint_payment_processor.com/payment/processor.php";
// you might find a more elegance way of preparing these credit card items for sending to
// the payment processor than it is shown in here!!!
// to start, open the url to connect to payment processor endpoint
$init = curl_init($enpoint_payment_processor_url);
/** setting some options **/
// set to 0 to eliminate header info from response
curl_setopt($init, CURLOPT_HEADER, 0);
// set it to true to turn the HTTP POST REQUEST protocol "ON"
curl_setopt($init, CURLOPT_POST, true);
// set CURLOPT_RETURNTRANSFER to true (or 1) to get CURL to send back the response
curl_setopt($init, CURLOPT_RETURNTRANSFER, true);
// use HTTP POST to send form data contains in $field
curl_setopt($init, CURLOPT_POSTFIELDS, $field); // http_build_query($field)
/** you can set some more options if you need to **/
// now execute post, and at this point, the server (endpoint) should be ready to response
$response = curl_exec($init);
// now we're done with the request and close the url endpoint connection
curl_close ($init);
// now you can parse the server (endpoint) response $response
// how you parse it depends on how you format your response in the server code.
// if your server response to you using json string then you need to parse it using
// json method: json_decode()
// if a server responses back using an array name/value pairs, then you need to parse it accordingly.
// if it is from the credit card payment processing companies, read their documentation.
// also, for credit card processing API, they probably require you to include some type of
// id, authentication, or reference, or account number to be sent to the endpoint so that they
// can identify who you are requesting their resources/services from their endpoint.
// as stated earlier, this is just a very simple and minimal code illustration.
// to do credit card processing request, you probably would need to set some more options and do
// some error handling as well.
?>
There you have it!!!
Make note: CURL is a very popular and powerful language/plugin tool to use in payment processing tasks (or API)!!!
Section 1.7: A touch of Financial Information eXchange (FIX) or FIXMLIn the previous sections you saw a request/response model using Ajax, jQuery, cURL; and in this section, we'll see how FIXML can be used as a request/response model to transfer data just like Ajax and jQuery.
Please note that this is just a brief overview of the request/response model using FIXML. For more, please check out the official website that contains everything about FIXML
The Financial Information eXchange ("FIX") Protocol is a series of messaging specifications for the electronic communication of trade-related messages, particularly, stocks and options trading. It has been developed through the collaboration of banks, broker-dealers, exchanges, industry utilities and associations, institutional investors, and information technology providers from around the world.
These market participants share a vision of a common, global language for the automated trading of financial instruments. In other words, you can use FIXML to transfer data to the server and the server will return the data you requested back to you (or more specifically, to your client application). It's a request/response transfer protocol for the financial industry.
To transfer data using FIXML or to fetch/retrieve data from the server using FIXML, you have to write a client script using client-side scripting languages such as Javascript, ASP, etc to push FIXML data format to the server and the server will response once it sees the FIXML data formatted request.
Let's see the FIXML data format to request to the server. As may have already guessed: FIXML is an electronic communication for the financial industry, particularly, stocks and options trading-related actions.
Let's see how to request a stock order to buy a stock (or options for that matter).
# Buy Order
<FIXML xmlns="http://www.fixprotocol.org/FIXML-5-0-SP2">
<Order TmInForce="0" Typ="1" Side="1" Acct="12345678">
<Instrmt SecTyp="CS" Sym="F"/>
<OrdQty Qty="1"/>
</Order>
</FIXML>
As you can see above, we placed a day order to buy 1 share of F (Ford Company) at market price on account 12345678. typ="1" means ???. Make note that the words typ and SecTyp. Those are not mis-typed -- they're the FIXML's real protocol keywords. I don't know about you -- I'm so annoyed about this spelling without the 'e'. I don't know what the reason is to omit the 'e'. But I'm so annoyed having to type without the 'e'.
# Buy to Cover (closing a short position)
<FIXML xmlns="http://www.fixprotocol.org/FIXML-5-0-SP2">
<Order TmInForce="0" Typ="2" Side="1" AcctTyp="5" Px="13" Acct="12345678">
<Instrmt SecTyp="CS" Sym="F"/>
<OrdQty Qty="1"/>
</Order>
</FIXML>
As you can see above, we placed a day order to buy to cover 1 share of F at $13 on account 12345678. typ="2" means ????
#
<FIXML xmlns="http://www.fixprotocol.org/FIXML-5-0-SP2">
<OrdCxlRplcReq TmInForce="0" Typ="2" Side="1" Px="15" Acct="12345678" OrigID="SVI-12345678">
<Instrmt SecTyp="CS" Sym="F"/>
<OrdQty Qty="1"/>
</OrdCxlRplcReq>
</FIXML>
To be continued!!!
#
To be continued!!!
#
As you can see, you have several options in requesting data from the server and getting the response from the server.
Section 1.8: ConclusionAt this point, you're probably not ready to go out and write your first Ajax application. However, you can start to get the basic idea of how these applications work and a basic understanding of the XMLHttpRequest object. In the chapters to come, you'll learn to master this object, how to handle JavaScript-to-server communication, how to work with HTML forms, and even get a handle on the DOM.
For now, though, spend some time thinking about just how powerful Ajax applications can be. Imagine a Web form that responds to you not just when you click a button, but when you type into a field, when you select an option from a combo box...even when you drag your mouse around the screen. Think about exactly what asynchronous means; think about JavaScript code running and not waiting on the server to respond to its requests. What sorts of problems can you run into? What areas do you watch out for? And how will the design of your forms change to account for this new approach in programming?
If you spend some real time with these issues, you'll be better served than just having some code you can cut-and-paste and throw into an application that you really don't understand. In the next chapter, you'll put these ideas into practice and I'll give you the details on the code you need to really make applications like this work. So, until then, enjoy the possibilities of Ajax.
Chapter 2
- Section 2.1 - Introduction
- Section 2.2 - Web 2.0 at a glance
- Section 2.3 - Introducing XMLHttpRequest
- Section 2.4 - Dealing with Microsoft
- Section 2.5 - Static versus dynamic
- Section 2.6 - Sending requests with XMLHttpRequest
- Section 2.7 - Opening the request
- Section 2.8 - Sending the request
- Section 2.9 - Specifying a callback method
- Section 2.10 - Handling server responses
- Section 2.11 - HTTP ready states
- Section 2.12 - Reading the response text
- Section 2.13 - Conclusion
Section 2.1: Introduction
Most Web applications use a request/response model that gets an entire HTML page from the server. The result is a back-and-forth that usually involves clicking a button, waiting for the server, clicking another button, and then waiting some more. With Ajax and the XMLHttpRequest object, you can use a request/response model that never leaves users waiting for a server to respond. In this chapter, I will show you how to create XMLHttpRequest instances in a cross-browser way, construct and send requests, and respond to the server.
In the last chapter of this book, you were introduced to the Ajax applications and looked at some of the basic concepts that drive Ajax applications. At the center of this was a lot of technology that you probably already know about: JavaScript, HTML and XHTML, a bit of dynamic HTML, and even some DOM (the Document Object Model). In this chapter, I will zoom in from that 10,000-foot view and focus on specific Ajax details.
In this chapter, you'll begin with the most fundamental and basic of all Ajax-related objects and programming approaches: The XMLHttpRequest object. This object is really the only common thread across all Ajax applications and -- as you might expect -- you will want to understand it thoroughly to take your programming to the limits of what's possible. In fact, you'll find out that sometimes, to use XMLHttpRequest properly, you explicitly won't use XMLHttpRequest.
What in the world is that all about?
Section 2.2: Web 2.0 at a glance
First, take this last bit of overview before you dive into code -- make sure you're crystal clear on this idea of the Web 2.0. When you hear the term Web 2.0, you should first ask, "What's Web 1.0?" Although you'll rarely hear Web 1.0, it is meant to refer to the traditional Web where you have a very distinct request and response model. For example, go to Amazon.com and click a button or enter a search term. A request is made to a server and then a response comes back to your browser. That request has a lot more than just a list of books and titles, though; it's actually another complete HTML page. As a result, you probably get some flashing or flickering as your Web browser's screen is redrawn with this new HTML page. In fact, you can clearly see the request and response, delineated by each new page you see.
The Web 2.0 dispenses with this very visible back-and-forth (to a large degree). As an example, visit a site like Google Maps or Flickr. On Google Maps, for example, you can drag the map around and zoom in and zoom out with very little redrawing. Of course, requests and responses do go on here, but all behind the scenes. As a user, the experience is much more pleasant and feels a lot like a desktop application. This new feel and paradigm is what you see when someone refers to Web 2.0.
What you should care about then is how to make these new interactions possible. Obviously, you've still got to make requests and field responses, but it's the redrawing of the HTML for every request/response interaction that gives the perception of a slow, clunky Web interface. So clearly you need an approach that allows you to make requests and receive responses that include only the data you need, rather than an entire HTML page as well. The only time you want to get a whole new HTML page is when ... well ... when you want the user to see a new page.
But most interactions add details or change body text or overlay data on the existing pages. In all of these cases, Ajax and a Web 2.0 approach make it possible to send and receive data without updating an entire HTML page. And to any frequent Web surfer, this ability will make your application feel faster, more responsive, and bring them back over and over again.
Section 2.3: Introducing XMLHttpRequest
To make all this flash and wonder actually happen, you need to become intimately familiar with a JavaScript object called XMLHttpRequest. This little object -- which has actually been around in several browsers for quite a while -- is the key to Web 2.0, Ajax, and pretty much everything else you learn about in this book. To give you a really quick overview, these are just a few of the methods and properties you'll use on this object:
1. open(): Sets up a new request to a server.
2. send(): Sends a request to a server.
3. abort(): Bails out of the current request.
4. readyState: Provides the current HTML ready state.
5. responseText: The text that the server sends back to the client in response to a request.
Don't worry if you don't understand all of this (or any of this for that matter) -- you'll learn about each method and property in the next several chapters. What you should get out of this, though, is a good idea of what to do with XMLHttpRequest. Notice that each of these methods and properties relate to sending a request and dealing with a response. In fact, if you saw every method and property of XMLHttpRequest, they would all relate to that very simple request/response model. So clearly, you won't learn about an amazing new GUI object or some sort of super-secret approach to creating user interaction; you will work with simple requests and simple responses. It might not sound exciting, but careful use of this one object can totally change your applications.
The simplicity of new
First, you need to create a new variable and assign it to an instance of the XMLHttpRequest object. That's pretty simple in JavaScript; you just use the new keyword with the object name, like you see in Listing 1.
Listing 1. Create a new XMLHttpRequest object
<script language="javascript" type="text/javascript">
var request = new XMLHttpRequest();
</script>
|
That's not too hard, is it? Remember, JavaScript doesn't require typing on its variable, so you don't need anything like you see in Listing 2 (which might be how you'd create this object in Java).
Listing 2. Java pseudo-code for creating XMLHttpRequest
XMLHttpRequest request = new XMLHttpRequest();
So you create a variable in JavaScript with either 'let' (ES2015-compliant variable block scope) or 'var' for global scope. Variables declared with the 'var' keyword can have Global Scope, give it a name (like "request"), and then assign it to a new instance of XMLHttpRequest. At that point, you're ready to use the object in your functions.
Before I move on, I want to clarify this one nagging issue that seems to get a lot of people confused, and that is, the use of 'var' and 'let' keywords.
The var keyword signifies the variables being declared as global variables in a global scope; while on the other hand, let keyword signifies the variables being declared as local variables in a local block scope.
let allows you to declare variables that are limited in scope to (local) block or statement of expression: the opposite of var.
var is a keyword that allows you to define a variable globally in a global context regardless of block scope.
For example:
for() loop using let variable:
for (let i = 0; i < 10; i++)
{
// i is visible in a local block thus is logged in the console as 0, 1, 2,...., 9
console.log(i);
}
// throws an error as "i is not defined" because i is not visible outside for() loop
console.log(i);
for() loop using var variable:
for (var i = 0; i < 10; i++)
{
// i is visible in a local block thus is logged in the console as 0, 1, 2,...., 9
console.log(i);
}
// i is visible here too (outside) in a global scope. thus is logged as 10.
console.log(i);
|
Scoping rules
Variables declared by let have their scope in the block for which they are defined, as well as in any contained sub-blocks. In this way, let works very much like var. The main difference is that the scope of a var variable is the entire enclosing function. For example:
letTest() function using let variable:
function letTest()
{
/**
* this is a local scope in a function.
*
* in a 'function' let works very much like var.
*
* remember the rule above:
*
* let have their scope
* in the block for which they are defined,
* as well as in any contained sub-blocks.
*
* the key phrase is: 'block for which they are defined'
*/
// declaring x as a local scope variable
let x = 1;
{
// this is a local scope sub-block
// declaring x as a local scope sub-block variable
let x = 2; // different variable - a local sub-block variable!
console.log(x); // 2
/**
* ok, let's comment out this: let x = 2 and see what happens!
* this inner console.log(x) above will still output a 1. why?
*
* pay special attention to these phrases:
*
* in the block for which they are defined,
* as well as in any contained sub-blocks.
*
* in this case, the latter phrase is more applicable, meaning it is
* visible in the current block as well as in the sub-block.
*
* ok, now consider this: comment out: let x = 1 and
* don't forget to uncomment: let x = 2 and see what happens!
*
* console.log(x) above will still output a 2 because it is in a local block.
*
* however, the console.log(x) below outside of this local block will output
* an "undefined". why?
*
* because console.log(x) is outside of the block in which x was defined,
* and therefore, not visible to the outer global block, which console.log(x)
* below is in.
*/
}
console.log(x); // 1
}
varTest() function using var variable:
function varTest()
{
// this is a global scope
// declaring x as a global scope variable
var x = 1;
{
// declaring x as a local scope variable but has a global scope as well.
// actually, x points to the same memory location as the one above!
var x = 2; // same variable but in a sub-block in the same memory location!
console.log(x); // 2
}
// as you can see in a global scope, all variables with the same name
// point to the same memory location, and thus assigning 2 to x
// places 2 to the same memory location occupied by x = 1
console.log(x); // 2
/**
* think of it this way:
*
* in a global scope, you have one memory location for each variable.
* for example, you declare a variable x and this x occupies one memory location.
* along the course of your programming you assign a value to this variable
* and that value stays there for a while.
*
* now somewhere in the blocks, whether in sub-blocks or what have you,
* you change that variable value to a different value, i.e., x = 10.
* now 10 is placed in the memory location previously occupied by an old value
* that you gave it to x; and therefore, wiping out that old value entirely.
*
* now this occurs only if you haven't declare the same x variable in that
* particular block. if you have, then that 10 is assigned to that local x variable;
* whereby leaving the x variable in the global scope uneffected by this assignment.
*
* this occurs only if you haven't declare the same x variable in that particular
* local block scope.
*/
}
|
So use let and var appropriately!
Now Back to Ajax!
Error handlingIn real life, things can go wrong and this code doesn't provide any error-handling. A slightly better approach is to create this object and have it gracefully fail if something goes wrong. For example, many older browsers (believe it or not, people are still using old versions of Netscape Navigator) don't support XMLHttpRequest and you need to let those users know that something has gone wrong. Listing 3 shows how you might create this object so if something fails, it throws out a JavaScript alert.
Listing 3. Create XMLHttpRequest with some error-handling abilities
<script language="javascript" type="text/javascript">
var request = false;
try
{
request = new XMLHttpRequest();
}
catch (failed)
{
request = false;
}
if (!request)
{
alert("Error initializing XMLHttpRequest!");
}
</script>
|
Make sure you understand each of these steps:
1. Create a new variable called request and assign it a false value. You'll use false as a condition that means the XMLHttpRequest object hasn't been created yet.
2. Add in a try/catch block:
3. Try and create the XMLHttpRequest object.
4. If that fails (catch (failed)), ensure that request is still set to false.
5. Check and see if request is still false (if things are going okay, it won't be false - request is true). If there was a problem (and request is false), use a JavaScript alert to tell users there was a problem.
This is pretty simple; it takes longer to read and write about than it does to actually understand for most JavaScript and Web developers. Now you've got an error-proof piece of code that creates an XMLHttpRequest object and even lets you know if something went wrong.
Section 2.4: Dealing with Microsoft
This all looks pretty good ... at least until you try this code in Internet Explorer. If you do, you're going to get some awful errors telling you that your browser is out-of-date or something of that nature.
Microsoft playing nice?
Much has been written about Ajax and Microsoft's increasing interest and presence in that space. In fact, Microsoft's newest version of Internet Explorer -- version 7.0 (as of this writing), set to come out late in 2006 -- is supposed to move to supporting XMLHttpRequest directly, allowing you to use the new keyword instead of all the Msxml2.XMLHTTP creation code.
Don't get too excited, though; you'll still need to support old browsers, so that cross-browser code isn't going away anytime soon. Clearly, something isn't working; Internet Explorer is hardly an out-of-date browser and about 70 percent of the world uses Internet Explorer. In other words, you won't do well in the Web world if you don't support Microsoft and Internet Explorer! So, you need a different approach to deal with Microsoft's browsers.
It turns out that Microsoft supports Ajax, but calls its version of XMLHttpRequest something different. In fact, it calls it several different things. If you're using a newer version of Internet Explorer, you need to use an object called Msxml2.XMLHTTP; some older versions of Internet Explorer use Microsoft.XMLHTTP. You need to support these two object types (without losing the support you already have for non-Microsoft browsers). Check out Listing 4 which adds Microsoft support to the code you've already seen.
Listing 4. Add support for Microsoft browsers
<script language="javascript" type="text/javascript">
var request = false;
try
{
request = new XMLHttpRequest(); //creating object for non-Microsoft browsers
}
catch (trymicrosoft)
{
try
{
// creating object for Microsoft browser newer version: Msxml2
request = new ActiveXObject("Msxml2.XMLHTTP");
}
catch (othermicrosoft)
{
try
{
//creating object for Microsoft browser older version
request = new ActiveXObject("Microsoft.XMLHTTP");
}
catch (failed)
{
request = false;
}
} // end othermicrosoft
} // end trymicrosoft
if (!request)
{
alert("Error initializing XMLHttpRequest!");
}
</script>
|
As you can see, Microsoft has two versions of MSXML for whatever the reasons were: Msxml2 probably the enhanced version and Msxml probably the older version. Anyhow, this code tries to create the XMLHttpRequest object using one version of MSXML; if that fails, it then creates the XMLHttpRequest object using the other version. If neither of these work, the request variable is set to false, to tell your code that something hasn't worked. If that's the case, you've probably got a non-Microsoft browser and need to use different code to do the job.
It's easy to get lost in the curly braces, so I'll walk you through this one step at a time:1. Create a new variable called request and assign it a false value. Use false as a condition that means the XMLHttpRequest object isn't created yet.
2. Add in a try/catch block:
3. Try and create the XMLHttpRequest object.
4. If that fails (catch (trymicrosoft)):
5. Try and create a Microsoft-compatible object using the newer versions of Microsoft (Msxml2.XMLHTTP).
6. If that fails (catch (othermicrosoft)), try and create a Microsoft-compatible object using the older versions of Microsoft (Microsoft.XMLHTTP).
7. If that fails (catch (failed)), ensure that request is still set to false.
8. Check and see if request is still false (if things are okay, it won't be).
9. If there was a problem (and request is false), use a JavaScript alert to tell users there was a problem.
Make these changes to your code and try things out in Internet Explorer again; you should see the form you created (without an error message).
Okay, all that talk about two versions of Microsoft browsers was for educational and informational purpose only, but in realitity, you don't need to write two conditions to test for both Microsoft browser versions as shown above.
A good programming practice is to write code as cleanly and effeiciently as possible without compromising quality or robustness. This means you can use a much cleaner version of the browser code illustrated above.
Here is a much cleaner and simpler browser code initialization that works even better than the version that just described above. As a matter of fact, nowaday no one in the right mind would still use the older versions of MS browsers.
Besides, today's operating systems would not even support such outdated older browser versions anyway, and that's why this simpler code below is very popular among programmers because Microsoft has enhanced older version called Microsoft.XMLHTTP to make it more robust and up to date.
In other words, the much older version Microsoft.XMLHTTP has been enhanced (including its class ActiveXObject) to make it more robust and up to date. It also dropped the other older version called Msxml2.XMLHTTP completely.
Now it is rallying around behind their newest enhanced version Microsoft.XMLHTTP and Microsoft will continue to update and enhance its flagship class ActiveXObject to the distance future as well.
Here is a much cleaner, simpler, and robust browser code:
<script language="javascript" type="text/javascript">
/* Create a new XMLHttpRequest object to talk to the Web server */
var xmlHttp = false;
if (document.window.XMLHttpRequest) // notice that the XMLHttpRequest without the "()"
{
//creating a non-MS browser object
xmlHttp = new XMLHttpRequest(); // notice that the XMLHttpRequest with the "()"
}
else if (document.window.ActiveXObject) // notice that the ActiveXObject without the "()"
{
// this is the newer MS browser object and not even
// bother to test for older versions
xmlHttp = new ActiveXObject("Microsoft.XMLHTTP"); // notice that the ActiveXObject with the "()"
}
else
{
document.write("unknown browser");
}
if (!xmlHttp)
{
alert("Error initializing xmlHttp browser object!");
}
</script>
|
Section 2.5: Static versus dynamic
Take a look back at Listings 1, 3, and 4 and notice that all of this code is nested directly within script tags. When JavaScript is coded like that and not put within a method or function body, it's called static JavaScript. This means that the code is run sometime before the page is displayed to the user. (It's not 100 percent clear from the specification precisely when this code runs and browsers do things differently; still, you're guaranteed that the code is run before users can interact with your page.) That's usually how most Ajax programmers create the XMLHttpRequest object.
That said, you certainly can put this code into a method as shown in Listing 5.
Listing 5. Move XMLHttpRequest creation code into a method
<script language="javascript" type="text/javascript">
/* Create a new XMLHttpRequest object to talk to the Web server */
/* Notice the use of the keyword 'var' to declare a global scope */
var request = false;
public function createRequest()
{
if (document.window.XMLHttpRequest)
{
//creating a non-MS browser object
request = new XMLHttpRequest();
}
else if (document.window.ActiveXObject)
{
// this is the newer MS browser object and not even
// bother to test for older versions
request = new ActiveXObject("Microsoft.XMLHTTP");
}
else
{
document.write("unknown browser");
}
if (!request)
{
alert("Error initializing XMLHttpRequest!");
}
} //end createRequest()
</script>
|
Or for the old outdated Microsoft browser code:
<script language="javascript" type="text/javascript">
/* Create a new XMLHttpRequest object to talk to the Web server */
/* Notice the use of the keyword 'var' to declare a global scope */
var request = false;
public function createRequest()
{
try
{
request = new XMLHttpRequest();
}
catch ()
{
// no need to output the error. we'll go directly to try:
try
{
// this is the newer MS browser object and not even
// bother to test for older versions
request = new Microsoft.XMLHTTP();
}
catch (err)
{
// you can print out the error using message property:
// err.message
// however, the test below does the job for us already!
request = false;
}
}
if (!request)
{
alert("Error initializing XMLHttpRequest!");
}
} //end createRequest()
</script>
|
With code setup like this, you'll need to call this method before you do any Ajax work. So you might have something like Listing 6.
Listing 6. Use an XMLHttpRequest creation method
<script language="javascript" type="text/javascript">
/* Create a new XMLHttpRequest object to talk to the Web server */
/* Notice the use of the keyword 'var' to declare a global scope */
var request = false;
public function createRequest()
{
if (document.window.XMLHttpRequest)
{
//creating a non-MS browser object
request = new XMLHttpRequest();
}
else if (document.window.ActiveXObject)
{
// this is the newer MS browser object and not even
// bother to test for older versions
request = new ActiveXObject("Microsoft.XMLHTTP");
}
else
{
document.write("unknown browser");
}
if (!request)
{
alert("Error initializing XMLHttpRequest!");
}
} //end createRequest()
public function getCustomerInfo()
{
request = createRequest();
// Right here where you do any Ajax work!
// For example, do something with the request variable
// See the following:
// Build the URL to connect to the server. See listing 8
let url = "/script/getZipCode.php?city=" + escape(city) +
"&state=" + escape(state);
// Open a connection to the server
request.open("GET", url, true);
// Setup a function for the server to run when it's done
request.onreadystatechange = updatePage;
// Send the request
request.send(null);
}
</script>
|
The only concern with this code -- and the reason most Ajax programmers don't use this approach -- is that it delays error notification, meaning that when a user enters data into the input box, Ajax engine doesn't fire off the response until the XMLHttpRequest object has been created, which in this case, getCustomerInfo() had to be called first and then the XMLHttpRequest object is created. Whereas in the static JavaScript code illustrated in the previous example above, the XMLHttpRequest object is created (and stored in the RAM) even before the user ever got to see the full page being completely displayed.
Suppose you have a complex form with 10 or 15 fields, selection boxes, and the like, and you fire off some Ajax code when the user enters text in field 14 (way down the form).
At that point, getCustomerInfo() runs, tries to create an XMLHttpRequest object, and fails. Then an alert is spit out to the user, telling them (in so many words) that they can't use this application. But the user has already spent time entering data in the form! That's pretty annoying and annoyance is not something that typically entices users back to your site.
In the case where you use static JavaScript, the user is going to get an error as soon as they hit your page. Is that also annoying? Perhaps; it could make users mad that your Web application won't run on their browser. However, it's certainly better than spitting out that same error after they've spent 10 minutes entering information.
For that reason alone, I encourage you to set up your code statically (using static JavaScript illustrated in the previous above) and your users know early on about possible problems.
Section 2.6: Sending requests with XMLHttpRequestOnce you have your request object (as in Listing 6), you can begin the request/response cycle. Remember, XMLHttpRequest's only purpose is to allow you to make requests and receive responses. Everything else -- changing the user interface, swapping out images, even interpreting the data that the server sends back -- is the job of JavaScript, CSS, or other code in your pages. With XMLHttpRequest ready for use, now you can make a request to a server.
Setting the server URL
In order to send a request to the server, you need a URL to connect to. So the first thing you need to determine is to set or construct the URL of the server to connect to. This isn't specific to Ajax -- obviously you should know how to construct a URL by now -- but is still essential to making a connection.
In most applications, you'll construct this URL from some set of static data combined with data from the form your users work with. Static data is the data contained in the current script like in some variables, i.e., data contains in variable url. For example, Listing 7 shows some JavaScript that grabs the (non-static) value of the phone number field that the user enters in the input box of the form and then constructs a URL using that data.
Listing 7. Build a request URL
<script language="javascript" type="text/javascript">
/* Create a new XMLHttpRequest object to talk to the Web server */
var request = false;
if (document.window.XMLHttpRequest)
{
//creating a non-MS browser object
request = new XMLHttpRequest();
}
else if (document.window.ActiveXObject)
{
// this is the newer MS browser object and not even
// bother to test for older versions
request = new ActiveXObject("Microsoft.XMLHTTP");
}
else
{
document.write("unknown browser");
}
if (!request)
{
alert("Error initializing XMLHttpRequest!");
}
public function getCustomerInfo()
{
// grab the phone # from the input box the user enters in
// the form in Listing 8.
// phone contains a non-static data from the form
let phone = document.getElementById("phone").value;
// Do something with the request variable (or phone number) ....
// In this case, we'll set it up and prepare to send it to
// the server for processing
// url contains both static (the host) and non-static (phone)
let url = "http://www.example.com/cgi-local/lookupCustomer.php?phone=" +
escape(phone);
}
</script>
|
Here is the same code above but uses the old Microsoft browser version in case anyone is still using legacy code.
Listing 7a. Build a request URL
<script language="javascript" type="text/javascript">
/* Create a new XMLHttpRequest object to talk to the Web server */
var request = false;
try
{
request = new XMLHttpRequest();
}
catch ()
{
// no need to output the error. we'll go directly to try:
try
{
// this is the newer MS browser object and not even
// bother to test for older versions
request = new Microsoft.XMLHTTP();
}
catch (err)
{
// you can print out the error using message property:
// err.message
// however, the test below does the job for us already!
request = false;
}
}
if (!request)
{
alert("Error initializing XMLHttpRequest!");
}
public function getCustomerInfo()
{
// grab the phone # from the input box the user enters in
// the form in Listing 8.
// phone contains a non-static data from the form
let phone = document.getElementById("phone").value;
// Do something with the request variable (or phone number) ....
// In this case, we'll set it up and prepare to send it to
// the server for processing
// url contains both static (the host) and non-static (phone)
let url = "http://www.example.com/cgi-local/lookupCustomer.php?phone=" +
escape(phone);
}
</script>
|
Nothing here should trip you up. First, the code creates a new variable named phone and assigns the value of the form field with an ID of "phone." Listing 8 shows the XHTML for this particular form in which you can see the phone field and its id attribute.
The purpose of constructing a URL is to perform some sort of task(s) on the server-side end. So what you need to do is constructing a URL that connects to a particular script so that your function fires off that script into action. In this case, it (getCustomerInfo()) fires off a PHP script named lookCustomer.php (which is locating inside a server somewhere far away) to get this script to look up a phone number, maybe, in a database and returns that phone number back to Javascript via XMLHttpRequest object property "responseText".
Listing 8. The HTML form
<body>
<p>This is just an ordinary HTML form!</p>
<form action="POST">
<p>Enter your phone number:
<input type="text" size="14" name="phone" id="phone"
onChange()="getCustomerInfo();" />
</p>
<p>Your order will be delivered to:</p>
<div id="address">
<p>Type your order in here:</p>
<p><textarea name="order" rows="6" cols="50" id="order"></textarea></p>
<p><input type="submit" value="Order Pizza" id="submit" /></p>
</form>
</body
|
Also notice that when users enter their phone number or change the number, it fires off the getCustomerInfo() method shown in Listing 8. That method then grabs the number and uses it to construct a URL string stored in the url variable.
In this example, the script folder name/filename is /cgi-local/lookupCustomer.php. Finally, the phone number is appended to this script as a GET parameter: "phone=" + escape(phone).
If you've never seen the escape() method before, it's used to escape any characters that can't be sent as clear text correctly. For example, any spaces in the phone number are converted to %20 characters, making it possible to pass the characters along in the URL.
You can add as many parameters as you need. For example, if you wanted to add another parameter, just append it onto the URL and separate parameters with the ampersand (&) character [the first parameter is separated from the script name with a question mark (?)]. For example, if you're sending phone, email, address, city, and zipcode to the server, you can construct a URL like this:
let url = "/cgi-local/lookupInfo.php?phone=" + escape(phone) + "&email=" + escape(email) + "&address=" + escape(address) + "&city=" + escape(city) + "&zipcode=" + escape(zipcode);
Please note that you need to use a complete url of the remote host you're trying to connect to, such as http://www.remotehostexample.com/. And as well as any folder/directory names followed by the script name. For example, http://www.remotehostexample.com/local_folder/scriptname.php. The example url's shown in this book omit the full and proper url details. Self-explanatory!
Section 2.7: Opening the requestDoes open() open?
Internet developers disagree about what exactly the open() method does. What it does not do is actually open a request. If you were to monitor the network and data transfer between your XHTML/Ajax page and the script that it connects to, you wouldn't see any traffic when the open() method is called. It's unclear why the name was chosen, but it clearly wasn't a great choice. Calling it
initialize() (or some other names) would have been appropriate since it initializes and prepare the URL to get it ready to be sent to the server.With a URL to connect to, you can configure the request. You'll accomplish this using the open() method on your XMLHttpRequest object. This method takes as many as five parameters:
1. request-type: The type of request to send. Typical values are GET or POST, but you can also send header requests using a value: HEAD.
2. url: The URL to connect to.
3. asynch: True if you want the request to be asynchronous and false if it should be a synchronous request. This parameter is optional and defaults to true.
4. username: If authentication is required, you can specify the username here. This is an optional parameter and has no default value.
5. password: If authentication is required, you can specify the password here. This is an optional parameter and has no default value.
Typically, you'll use the first three of these. In fact, even when you want an asynchronous request, you should specify "true" as the third parameter. That's the default setting, but it's a nice bit of self-documentation to always indicate if the request is asynchronous or not.
Put it all together and you usually end up with a line that looks a lot like Listing 9.
Listing 9. Open the request
function getCustomerInfo()
{
let phone = document.getElementById("phone").value;
let url = "/cgi-local/lookupCustomer.php?phone=" + escape(phone);
request.open("GET", url, true);
}
|
Once you have the URL figured out, then this is pretty trivial. For most requests, using GET is sufficient, along with the URL, is all you need to use open(). If you ever wanted to use POST instead of GET, you need to write a slightly different code using the function send(). Function send() hasn't been covered yet until the later chapters; and therefore, you'll have to wait until then to fully understand the significance of send(). But here's a brief example just to show you that you can use send() to POST a request to the server right now instead of GET request you'd seen earlier.
<script language="javascript" type="text/javascript">
/* Create a new XMLHttpRequest object to talk to the Web server */
var request = false;
if (document.window.XMLHttpRequest)
{
//creating a non-MS browser object
request = new XMLHttpRequest();
}
else if (document.window.ActiveXObject)
{
// this is the newer MS browser object and not even
// bother to test for older versions
request = new ActiveXObject("Microsoft.XMLHTTP");
}
else
{
document.write("unknown browser");
}
if (!request)
{
alert("Error initializing XMLHttpRequest!");
}
/* declare and initialize some object variables */
//I add this line to make it more interesting
let name = document.getElementById("name").value;
//I add this line to make it more interesting
let address = document.getElementById("address").value;
let phone = document.getElementById("phone").value;
//I add this line to make it more interesting
let order = document.getElementById("order").value;
// right here where it waits for the server to response.
// when the server responses it sets this "onreadystatechange" property with codes.
request.onreadystatechange = function()
{
// object variable 'this' refers to an xmlHttpRequest object
// you could also just use the already initialized variable 'request' object
if (this.readyState == 4 && this.status == 200)
{
/**
* at this point, the server has finished sending back its response.
* now we can get that response in the property variable responseText.
*/
response = JSON.parse(this.responseText);
/**
* now we can use the data contains in variable response in the form
* of a Javascript array object that parse() parses it into a
* Javascript array object.
*
* the server-side script just sent a response to this client by just
* sending back name, address, phone, order.
* you might want to response to the client with a more meaningful response
* than just sending back name, address, phone, order.
*/
name = response.name;
document.write(name + "<br>");
address = response.address;
document.write(address + "<br>");
phone = response.phone;
document.write(phone + "<br>");
order = response.order;
document.write(order + "<br>");
}
/* now we need to prepare the url and do some initilization */
/**
* notice that the URL has the current time appended to it.
* That ensures that the request isn't cached after it's sent
* the first time but is recreated and resent each time this
* method is called; the URL will be subtly different because of
* the changing time stamp.
*
* This is a common trick to ensure that POSTing to a script actually
* repeatedly generates a new request each time, and the Web browser
* doesn't try and cache responses from the server.
*
* so don't forget to use this neat trick when send through POST.
*
* notice also that the name/value pairs are not appended to the url like GET.
*
* instead it will be sent as the argument of send()
*/
let url = "/cgi-local/lookupCustomer.php?timeStamp=" + new Date().getTime();
// we need to prepare the header properly before sending a POST
request.setRequestHeader("Content-type", "application/x-www-form-urlencoded");
request.open("POST", url, true); //<--- here is the POST request
// Below: notice the use of send() and appending all name/value pair
// variables as one long string
// this sends the long string to a server-side script named:
// lookupCustomer.php
request.send("name=" + escape(name) + "&address=" + escape(address) +
"&phone=" + escape(phone) + "&order=" + escape(order));
}
</script>
|
Or, you could do like this to make your code a little cleaner and easier to read:
<script language="javascript" type="text/javascript">
/* Create a new XMLHttpRequest object to talk to the Web server */
var request = false;
if (document.window.XMLHttpRequest)
{
//creating a non-MS browser object
request = new XMLHttpRequest();
}
else if (document.window.ActiveXObject)
{
// this is the newer MS browser object and not even
// bother to test for older versions
request = new ActiveXObject("Microsoft.XMLHTTP");
}
else
{
document.write("unknown browser");
}
if (!request)
{
alert("Error initializing XMLHttpRequest!");
}
/* declare and initialize some object variables */
//I add this line to make it more interesting
let name = document.getElementById("name").value;
//I add this line to make it more interesting
let address = document.getElementById("address").value;
let phone = document.getElementById("phone").value;
//I add this line to make it more interesting
let order = document.getElementById("order").value;
// concatenate the name/value pairs and assign a variable (post_string) to it
let post_string = escape(name) + "&" + escape(address) +
"&" + escape(phone) + "&" + escape(order);
// concatenate the name/value pairs and assign a variable (post_string) to it
// you can do like this as well:
// let post_string = "name=" + escape(name) + "&address=" + escape(address) +
// "&phone=" + escape(phone) + "&order=" + escape(order);
/* now we need to prepare the url and do some initilization */
/**
* notice that the URL has the current time appended to it.
* That ensures that the request isn't cached after it's sent
* the first time but is recreated and resent each time this
* method is called; the URL will be subtly different because of
* the changing time stamp.
*
* This is a common trick to ensure that POSTing to a script actually
* repeatedly generates a new request each time, and the Web browser
* doesn't try and cache responses from the server.
*
* so don't forget to use this neat trick when send through POST.
*
* notice also that the name/value pairs are not appended to the url like GET.
*
* instead it will be sent as the argument of send()
*/
let url = "/cgi-local/lookupCustomer.php?timeStamp=" + new Date().getTime();
// we need to prepare the header properly before sending a POST
request.setRequestHeader("Content-type", "application/x-www-form-urlencoded");
request.open("POST", url, true); //<--- here is the POST request
// we can just send the request to the server. notice that instead of 'null', we are
// posting the long string to the server with a key/value pair, with key is the key.
request.send("key=" + post_string); // notice the key/value pair "key="post_string
// you can do like this as well:
// request.send(post_string); // POST the name/value pairs to server
// right here where it waits for the server to response.
// when the server responses it sets this "onreadystatechange" property with codes.
request.onreadystatechange = function()
{
// object variable 'this' refers to an xmlHttpRequest object
// you could also just use the already initialized variable 'request' object
if (this.readyState == 4 && this.status == 200)
{
/**
* at this point, the server has finished sending back its response.
* now we can get that response in the property variable responseText.
*/
response = JSON.parse(this.responseText);
/**
* now we can use the data contains in variable response in the form
* of a Javascript array object that parse() parses it into a
* Javascript array object.
*
* the server-side script just sent a response to this client by just
* sending back name, address, phone, order.
* you might want to response to the client with a more meaningful response
* than just sending back name, address, phone, order.
*/
name = response.name;
document.write(name + "<br>");
address = response.address;
document.write(address + "<br>");
phone = response.phone;
document.write(phone + "<br>");
order = response.order;
document.write(order + "<br>");
}
}
</script>
now in the server-side PHP script called lookupCustomer.php, you can response
to the client. for the first version, you can response to the client using code
similar to the following server-side PHP code. self-explantory!
<?php
// but first, we can grab the data sent by the client using $_POST
// if (isset($_POST["name"]))
// {
// $name = $_POST["name"];
// }
// if (isset($_POST["address"]))
// {
// $address = $_POST["address"];
// }
// if (isset($_POST["phone"]))
// {
// $phone = $_POST["phone"];
// }
// if (isset($_POST["order"]))
// {
// $order = $_POST["order"];
// }
// now retrieve an HTTP request using $_POST containing a key/value
if (isset($_POST["key"]))
{
$string = $_POST["key"];
}
else
{
exit();
}
// at this point we got the message/request from the client
// from here and onward, we will need to response to the client.
// see a brute force response in a little bit
// now $string contains this data: "name=John Doe&address=123 main st&phone=6123& ..."
// of course, while sending this long string, the browser will replace any space with
// these characters: %20, for example, John%20Doe&address123%20& .....
// now you have a POST data and you can do whatever you want, such as storing it in
// db and as well as responding to the client.
$data = exlode("&", $string);
// now $data contains an array data: [
// "name" => "John Doe", "address" => "123 main st",
// "phone" => "6123334444", "order" => "...."
// ]
// then tell the client we're sending a name/value pair JSON text data format
header("Content-Type: application/json; charset=UTF-8");
// right here where we will brute force sending a response to the client.
// but before sending it to the client, we need to format the array object $data and
// send it to the client as a JSON data format.
// see chapter 10 and 11 for more on JSON.
// sending name, address, phone, order to the client?
// well, you can find a more useful data to send to the client than this.
echo json_encode($data);
/* after responding to the client, store data in the database */
try
{
// of course, you need to provide proper connection parameters such as
// $hostingServer, $databaseName, $username, $password
$conn = new PDO("mysql:host=$hostingServer;dbname=$databaseName",
$username, $password);
}
catch (PDOException $e)
{
echo 'ERROR: Cannot connect to the server: ' . $e->getMessage();
}
try
{
$stmt = $conn->prepare("INSERT INTO customer (name, address, phone)
VALUES (?, ?, ?) ");
/**
* $data contains four items: name, address, phone, order.
* but the table only contains three fields, so execute() method only
* inserts the first three items into the first three fields in the table,
* leaving the extra item: order unused.
*
* if your code doesn't seem to show any data inserted in the table is because
* of this discrepancy of the data and the field table.
*
* if that is the case, you might need to format your $data to contain the
* same number of items as the number of the table fields.
*/
$stmt->execute($data);
}
catch (PDOException $e)
{
echo 'ERROR: Cannot insert data into the database: ' . $e->getMessage();
}
?>
|
That is it!!! You see how simple it is to send a request to the server using POST?
You'll see a more in-depth discussion about the situations in which you might want to use POST in later sections and chapters -- starting in section 7.4.
Before I move on, I want to show one more example so that I won't hang you to dry. When you send a request to the server, you need to handle the request using the server-side scripting language, such as PHP, PERL, Python, ASP, etc.
Here is an old code, which was written sometime in 2004-5, using PHP's outdated mysql_ database engine. For an up-to-date code, see the previous PDO database engine example; or you can find some more PDO database engine examples later on, particularly in chapter 11.
In this example, I'm going to use PHP to handle the request and here is the example server-side script named:lookupCustomer.php.
<?php
//handling a request from the client script
if isset($_POST['name'])
$name = $_POST['name'];
if isset($_POST['address'])
$address = $_POST['address'];
if isset($_POST['phone'])
$phone = $_POST['phone'];
if isset($_POST['order'])
$order = $_POST['order'];
//now that we got all the info sent by the client, we can look up the customer's phone #
//Making connection to MySQL database server
$Conn = mysql_connect($localhost, $username, $password);
if (!$Conn)
{
die('Could not connect: ' . mysql_error());
}
@mysql_select_db($database) or die( "Unable to select database");
// Get customer's phone number from the database
$select = 'SELECT Phone, Name, Address;
$from = ' FROM Customer_Table';
$where = " `Phone` = '$phone' ";
$query = @mysql_query($select . $from . $where) or mysql_error();
if (mysql_num_rows($query) == 0)
{
echo ("Oop!! we have a new customer ... no phone # on our record.');
//so grab customer's info from the client form obtained earlier and .....
//save it in your database
$query = "INSERT INTO `Customer_Table`
(
`Name`, `Address`, `Phone`, `Order`
)
VALUES
(
'$name', '$address', '$phone', '$order'
)";
mysql_query($query) or mysql_error();
//Send customer data back to the client
//Let the client know we're sending back plain text data (not XML)
header("Content-Type: text/plain");
echo $name . '|' . $address . '|' . $phone . '|' . $order;
}
else
{
//Yeah!! we have a repeat customer ... welcome back!
//Let the client know we're sending back plain text data (not XML)
header("Content-Type: text/plain");
while ($row = mysql_fetch_array(query))
{
//Pick out data from resultset
$name = $row['Name'];
$address = $row['Address'];
$phone = $row['Phone'];
$order = $row['Order'];
//Send customer data back to the client
echo $name . '|' . $address . '|' . $phone . '|' . $order;
}//end while
}//end else
mysql_close($conn);
?>
|
There you have it!!!
[Moving On]
A teaser on asynchronicity
Later in this book, I'll spend significant time on writing and using asynchronous code, but you should get an idea of why that last parameter in open() is so important. In a normal request/response model -- think Web 1.0 here -- the client (your browser or the code running on your local machine) makes a request to the server. That request is synchronous; in other words, the client waits for a response from the server. While the client is waiting, you usually get at least one of several forms of notification that you're waiting:
1. An hourglass (especially on Windows).
2. A spinning beachball (usually on Mac machines).
The application essentially freezes and sometimes the cursor changes. This is what makes Web applications in particular feel clunky or slow -- the lack of real interactivity. When you push a button, your application essentially becomes unusable until the request you just triggered is responded to. If you've made a request that requires extensive server processing, that wait might be significant (at least for today's multi-processor, DSL, no-waiting world).
An asynchronous request though, does not wait for the server to respond. You send a request and then your application continues on. Users can still enter data in a Web form, click other buttons, even leave the form. There's no spinning beachball or whirling hourglass and no big application freeze. The server quietly responds to the request and when it's finished, it let's the original requestor know that it's done (in ways you'll see in just a moment). The end result is an application that doesn't feel clunky or slow, but instead is responsive, interactive, and feels faster. This is just one component of Web 2.0, but it's a very important one. All the slick GUI components and Web design paradigms can't overcome a slow, synchronous request/response model.
Section 2.8: Sending the request
Once you configure the request with open(), you're ready to send the request. Fortunately, the method for sending a request is named more properly than open().
send() takes only a single parameter, the content to send. But before you think too much on that, recall that you are already sending data through the URL itself like so:
let url = "/cgi-local/lookupCustomer.php?phone=" + escape(phone);
Although you can send data using send(), you can also send data through the URL itself like above. In fact, in GET requests (which will constitute as much as 80 percent of your typical Ajax usage), it's much easier to send data in the URL. But also, it's not too difficult to send data through send() using POSt request [as you'd seen brief examples earlier]. When you start to send secure information or XML, then you want to look at sending content through send() (I'll discuss both secure data and XML messaging in a later chapters in this book). When you don't need to pass data along through send(), then just pass null as the argument to this method. So, to send a request in the example you've seen throughout this book, that's exactly what is needed sending through the URL itself (see Listing 10).
Listing 10. Send the request (through the URL itself)
function getCustomerInfo()
{
let phone = document.getElementById("phone").value;
let url = "/cgi-local/lookupCustomer.php?phone=" + escape(phone);
request.open("GET", url, true);
request.send(null);
}
|
Typically when you need to send something to the server or requesting something from the server [as is usually the case], you need to know server-side programming to perform some sort of tasks in response to the client's request. Server-side programming involves server-side scripts like PHP, Perl, Python, ASP, Ruby on the Rail, etc. These programming languages are suitable for performing tasks on the server.
Here is an old code, which was written sometime in 2004-5, using PHP's outdated mysql_ database engine. For an up-to-date code, see the previous PDO database engine example; or you can find some more PDO database engine examples later on, particularly in chapter 11.
In this example, we use PHP server-side programming language to look up customer's phone number (lookupCustomer.php) stored in the database. The lookupCustomer.php script looks like the following:
<?php
/***********************************
* Script to retrieve customer data *
* File: lookupCustomer.php *
************************************/
//You need to replace these values for your own db connection
$database="dbo99770110";
$localhost="dbserv.example.com";
$username="myUser123";
$password="dbPass123";
//Making connection to MySQL database server
$Conn = mysql_connect($localhost, $username, $password);
if (!$Conn)
{
die('Could not connect: ' . mysql_error());
}
@mysql_select_db($database) or die( "Unable to select database");
//Remember that you sent the request via a GET array:
//(request.open("GET", url, true);)
//So we'll use $_GET to grab the phone number from the client
//you could also grab customer's order ....
$Phone = $_GET['phone'];
// Get customer's phone number from the database
$select = 'SELECT Phone, Name, Address, City, State, Zipcode;
$from = ' FROM Customer_Table';
$where = " `Phone` = '$Phone' ";
$query = @mysql_query($select . $from . $where) or mysql_error();
if (mysql_num_rows($query) == 0)
{
echo ("Oop!! we have a new customer ... no phone # on our record.');
//so grab address from the client form instead .....
$Address = $_GET['address'];
$City = $_GET['city'];
$State = $_GET['state'];
$Zipcode = $_GET['zipcode'];
//Right here you might want to save customer data in your database
//Send customer data back to the client
//Let the client know we're sending back plain text data (not XML)
header("Content-Type: text/plain");
echo $Name . '|' . $Address . '|' . $City . '|' . $State . '|' .
$State . '|' . $Phone;
}
else
{
//Yeah!! we have a repeat customer ... welcome back!
//Let the client know we're sending back plain text data (not XML)
header("Content-Type: text/plain");
while ($row = mysql_fetch_array(query))
{
//Pick out data from resultset
$Name = $row['Name'];
$Address = $row['Address'];
$City = $row['City'];
$State = $row['State'];
$Zipcode = $row['Zipcode'];
$Phone = $row['Phone'];
//Send customer data back to the client
echo $Name . '|' . $Address . '|' . $City . '|' . $State . '|' .
$State . '|' . $Phone;
}//end while
}//end else
mysql_close($conn);
?>
|
Notice that this server-side script sends data via plain text, seperating each data item with a pipe "|". You'll learn how to handle these data on client-side script in a little bit, starting in section 2.10.
For the sake of being more complete in our pizza delivery order example, you need to process customer's order also. This involves performing some tasks in server-side script and it can be incorporated into the script above also. I'll leave it to you as an exercise.
Hint: use GET array to grap the order and once you got the items, you can decide what to do with those items; perhaps, make the pizza according to what the customer specified. And after that, you can response to the client telling them that the order has been received and in the process of being made. This involves some output to the browser in the form of just echoing back to the client script, for example:
$Sausage = $_GET['sausage'];
$Pepperoni = $_GET['pepperoni'];
$Olive = $_GET['olive'];
//and then echo out
echo $Sausage . $Pepperoni . $Olive;
|
I know I love pizza and I order pizza online on a regular basis. So I see some similarity in the way the request/response are interconnected.
Note: if you're working with PHP script, be careful with POST and GET arrays. If your customer fill in the order form and click the "Submit Order" on your website, that's is a POST request and you should use $_POST['sausage'] variable, unless your client script (JavaScript) grabs that item and sends it via a GET array instead. So be careful when working with PHP script.Section 2.9: Specifying a callback method
At this point, you've done very little that feels new, revolutionary, or asynchronous. Granted, that little keyword "true" in the open() method sets up an asynchronous request. But other than that, this code resembles programming with Java servlets and JSPs, PHP, or Perl. So what's the big secret to Ajax and Web 2.0? The secret revolves around a simple property of XMLHttpRequest called onreadystatechange.
First, be sure you understand the process that you created in this code (review Listing 10 if you need to). A request is set up and then made. Additionally, because this is an asynchronous request, the JavaScript method (getCustomerInfo() in the example) will not wait for the server. So the code will continue; in this case, that means that the method will exit and control will return to the form. Users can keep entering information and the application isn't going to wait on the server.
This creates an interesting question, though: What happens when the server has finished processing the request? The answer, at least as the code stands right now, is nothing! Obviously, that's not good, so the server needs to have some type of instruction on what to do when it's finished processing the request sent to it by XMLHttpRequest.
Referencing a function in JavaScript
JavaScript is a loosely typed language and you can reference just about anything as a variable. So if you declare a function called updatePage(), JavaScript also treats that function name as a variable. In other words, you can reference the function in your code as a variable named updatePage. This is where that onreadystatechange property comes into play. This property allows you to specify a callback method.
A callback allows the server to (can you guess?) call back into your Web page's code. It gives a degree of control to the server, as well; when the server finishes a request, it looks in the XMLHttpRequest object and specifically at the onreadystatechange property. Whatever method is specified by that property is then invoked. It's a callback because the server initiates calling back into the Web page -- regardless of what is going on in the Web page itself.
For example, it might call this method while the user is sitting in her chair, not touching the keyboard; however, it might also call the method while the user is typing, moving the mouse, scrolling, clicking a button ... it doesn't matter what the user is doing, there are some background processings going on asynchronously.
This is actually where the asynchronicity comes into play: The user operates the form on one level while on another level, the server answers a request and then fires off the callback method indicated by the onreadystatechange property. So you need to specify that method in your code as shown in Listing 11.
Listing 11. Set a callback method
function getCustomerInfo()
{
let phone = document.getElementById("phone").value;
let url = "/cgi-local/lookupCustomer.php?phone=" + escape(phone);
request.onreadystatechange = updatePage;
request.send(null);
}
|
Pay close attention to where in the code this property is set -- it's before send() is called. You must set this property before the request is sent, so the server can look up the property when it finishes answering a request. All that's left now is to code the updatePage() which is the focus of the last section.
Section 2.10: Handling server responses
You made your request, your user is happily working in the Web form (while the server handles the request), and now the server finishes up handling the request. The server looks at the onreadystatechange property and figures out what method to call. Once that occurs, you can think of your application as any other app, asynchronous or not. In other words, you don't have to take any special action writing methods that respond to the server; just change the form, take the user to another URL, or do whatever else you need to in response to the server. In this section, we'll focus on responding to the server and then taking a typical action -- changing on the fly part of the form the user sees.
Callbacks and Ajax
You've already seen how to let the server know what to do when it's finished: Set the onreadystatechange property of the XMLHttpRequest object to the name of the function to run. Then, when the server has processed the request, it will automatically call that function. You also don't need to worry about any parameters to that method. You'll start with a simple method like in Listing 12.
Listing 12. Code the callback method
<script language="javascript" type="text/javascript">
/* Create a new XMLHttpRequest object to talk to the Web server */
var request = false;
if (document.window.XMLHttpRequest)
{
//creating a non-MS browser object
request = new XMLHttpRequest();
}
else if (document.window.ActiveXObject)
{
// this is the newer MS browser object and not even
// bother to test for older versions
request = new ActiveXObject("Microsoft.XMLHTTP");
}
else
{
document.write("unknown browser");
}
if (!request)
{
alert("Error initializing XMLHttpRequest!");
}
public function getCustomerInfo()
{
// grab the phone # from the input box the user enters in
// the form in Listing 8.
let phone = document.getElementById("phone").value;
let url = "http://www.example.com/cgi-local/lookupCustomer.php?phone=" +
escape(phone);
request.open("GET", url, true);
request.onreadystatechange = updatePage;
request.send(null);
}
function updatePage()
{
alert("Server is done!");
}
</script>
|
This just spits out a handy alert, to tell you when the server is done. Of course, inside updatePage() you need to do/handle any Ajax response task accordingly instead of spitting out the message. However, there is some thing wrong with the way the code is setup as it stands right now.
Try this code in your own page, save the page, and then pull it up in a browser (if you want to see the XHTML at work from this example, refer back to Listing 8). When you enter in a phone number and leave the field, you should see the alert pops up; but click OK and it pops up again ... and again.
Depending on your browser, you'll get two, three, or even four alerts before the form stops popping up alerts. So what's going on? It turns out that you haven't taken into account the HTTP ready state, an important component of the request/response cycle.
Section 2.11: HTTP ready states
Earlier, I said that the server, once finished with a request, looks up what method to call in the onreadystatechange property of XMLHttpRequest. That's true, but it's not the whole truth. In fact, it calls that method every time the HTTP ready state changes. So what does that mean? Well, you've got to understand HTTP ready states first.
An HTTP ready state indicates the state or status of a request. It's used to figure out if a request has been started, if it's being answered, or if the request/response model has completed. It's also helpful in determining whether it's safe to read whatever response text or data that a server might have supplied. You need to know about five ready states in your Ajax applications:
0: The request is uninitialized (before you've called open()).
1: The request is set up, but hasn't been sent (before you've called send()).
2: The request was sent and is being processed (you can usually get content headers from the response at this point).
3: The request is being processed; often some partial data is available from the response, but the server hasn't finished with its response.
4: The response is complete; you can get the server's response and use it.
As with almost all cross-browser issues, these ready states are used somewhat inconsistently. You might expect to always see the ready state move from 0 to 1 to 2 to 3 to 4, but in practice, that's rarely the case. Some browsers never report 0 or 1 and jump straight to 2, then 3, and then 4. Other browsers report all states. Still others will report ready state 1 multiple times. As you saw in the last section, the server called updatePage() several times and each invocation resulted in an alert box popping up -- probably not what you intended!
For Ajax programming, the only state you need to deal with directly is ready state 4, indicating that a server's response is complete and it's safe to check the response data and use it. To account for this, the first line in your callback method should be as shown in Listing 13.
Listing 13. Check the ready state
function updatePage()
{
if (request.readyState == 4)
{
alert("Server is done!");
}
}
|
This change checks to ensure that the server really is finished with the process. Try running this version of the Ajax code and you should only get the alert message one time, which is as it should be.
HTTP status codes
Despite the apparent success of the code in Listing 13, there's still a problem -- what if the server responds to your request and finishes processing, but reports an error? Remember, your server-side code should care if it's being called by Ajax, a JSP, a regular HTML form, or any other type of code; it only has the traditional Web-specific methods of reporting information. And in the Web world, HTTP codes can deal with the various things that might happen in a request.
For example, you've certainly entered a request for a URL, typed the URL incorrectly, and received a 404 error code to indicate a page is missing. This is just one of many status codes that HTTP requests can receive as a status. 403 and 401, both indicating secure or forbidden data being accessed, are also common. In each of these cases, these are codes that result from a completed response. In other words, the server fulfilled the request (meaning the HTTP ready state is 4), but is probably not returning the data expected by the client.
In addition to the ready state then, you also need to check the HTTP status. You're looking for a status code of 200 which simply means okay. With a ready state of 4 and a status code of 200, you're ready to process the server's data and that data should be what you asked for (and not an error or other problematic piece of information). Add another status check to your callback method as shown in Listing 14.
Listing 14. Check the HTTP status code
function updatePage()
{
if (request.readyState == 4)
{
if (request.status == 200)
{
alert("Server is done!");
}
}
}
|
To add more robust error handling -- with minimal complication -- you might add a check or two for other status codes; check out the modified version of updatePage() in Listing 15.
Listing 15. Add some light error checking
function updatePage()
{
if (request.readyState == 4)
{
if (request.status == 200)
{
alert("Server is done!");
}
else if (request.status == 404)
{
alert("Url does not exist!");
}
else
{
alert("Error: status code is " + request.status);
}
}
}
|
Now change the URL in your getCustomerInfo() to a non-existent URL and see what happens. You should see an alert that tells you the URL you asked for doesn't exist -- perfect! This is hardly going to handle every error condition, but it's a simple change that covers 80 percent of the problems that can occur in a typical Web application.
Section 2.12: Reading the response text
Now that you made sure the request was completely processed (through the ready state) and the server gave you a normal, okay response (through the status code), you can finally deal with the data sent back by the server. This is conveniently stored in the responseText property of the XMLHttpRequest object.
Details about what the text in responseText looks like, in terms of format or length, is left intentionally vague by the creator of the Ajax engine, leaving us the freedom to do whatever we want in term of data format and its length.
This allows the server to set this text to virtually anything. In other words, it's up to the server-side script to set up the data format to send to client script. For instance, one script might return comma-separated values, another pipe-separated values (the pipe is the | character), and another may return one long string of text.
So it's all up to the server to format data and response. In other words, it's up to you to write your server-side script "how" to send back the request to the client script.
So because of the freedom we're allow to do, it is much easier to send data to client using JSON data structure. See chapter 10 and 11 for more.
Using JSON data structure is the most popular way for sending data from the server to the client. It is very easy to format and send, and as well as very easy to parse it on the client's end.
In the case of the example used in this section, the server returns a customer's last order and then their address, separated by the pipe symbol. The order and address are both then used to set values of elements on the form. Listing 16 shows the code that updates the display.Listing 16. Deal with the server's response
function updatePage()
{
if (request.readyState == 4)
{
if (request.status == 200)
{
let response = request.responseText.split("|");
document.getElementById("order").value = response[0];
document.getElementById("address").innerHTML =
response[1].replace(/\n/g, "");
}
else
{
alert("status is " + request.status);
}
}
}
|
First, the responseText is pulled and split on the pipe symbol using the JavaScript split() method. The resulting array of values is dropped into variable response. The first value -- the customer's last order -- is accessed in the array as response[0] and is set as the value of the field with an ID of "order." The second value in the array, at response[1], is the customer's address and it takes a little more processing.
Note that the above client script assumes the address was sent as one item and not as multiple items, seperating it into address, city, state, and zipcode. If you want to send address as multiple items, you can grab each individual item as the order item example above. Otherwise, use innerHTML to grab the whole address as shown above.
Assuming the server-side script sent an address as a single whole item, the address typical looks like this:
Jane Doe
123 Main St
Urban City, TX 77013
Since the lines in the address are separated by normal line separators (the "\n" character), the code needs to replace these with XHTML-style line separators, <br />s. That's accomplished through the use of the replace() function along with a regular expression. Finally, the modified text is set as the inner HTML of a div in the HTML form. The result is that the form suddenly is updated with the customer's information.
Before I wrap up, another important property of XMLHttpRequest is called responseXML. That property contains (can you guess?) an XML response in the event that the server chooses to respond with XML. Dealing with an XML response is quite different than dealing with plain text and involves parsing, the Document Object Model (DOM), and several other considerations. You'll learn more about XML in a future chapter. Still, because responseXML commonly comes up in discussions surrounding responseText, it's worth mentioning here. For many simple Ajax applications, responseText is all you need, but you'll soon learn about dealing with XML through Ajax applications as well.
As mentioned above, using JSON data structure is the most popular way for sending data from the server to the client. It is very easy to format and send, and as well as very easy to parse it on the client's end. The preceding illustration that shows how to parse data using the symbol pipe "|" was for educational purpose only; however, for practical purpose, I suggest that you use JSON data structure instead.
Section 2.13: Conclusion.You might be a little tired of XMLHttpRequest -- I rarely read an entire chapter about a single object, especially one that is this simple. However, you will use this object over and over again in each page and application that you write that uses Ajax. Truth be told, there's quite a bit still to be said about XMLHttpRequest. In coming chapters, you'll learn to use POST in addition to GET in your requests, set and read content headers in your request as well as the response from the server; you'll understand how to encode your requests and even handle XML in your request/response model.
Quite a bit further down the line, you'll also see some of the popular Ajax toolkits that are available. These toolkits actually abstract away most of the details discussed in this chapter and make Ajax programming easier. You might even wonder why you have to code all this low-level detail when toolkits are so readily available. The answer is, it's awfully hard to figure out what goes wrong in your application if you don't understand what is going on in your application.
So don't ignore these details or speed through them; when your handy-dandy toolkit creates an error, you won't be stuck scratching your head and sending an email to support. With an understanding of how to use XMLHttpRequest directly, you'll find it easy to debug and fix even the strangest problems. Toolkits are fine unless you count on them to take care of all your problems.
So get comfortable with XMLHttpRequest. In fact, if you have Ajax code running that uses a toolkit, try to rewrite it using just the XMLHttpRequest object and its properties and methods. It will be a great exercise and probably help you understand what's going on a lot better.
In the next chapter, you'll dig even deeper into this object, exploring some of its tricker properties (like responseXML), as well as how to use POST requests and send data in several different formats. So start coding to get a feel for yourself and then proceed to the next chapter.
Chapter 3
- Section 3.1 - Introduction
- Section 3.2 - Digging deeper into HTTP ready states
- Section 3.3 - Browser inconsistencies
- Section 3.4 - Getting safe data
- Section 3.5 - Redirection and rerouting
- Section 3.6 - Additional request types
- Section 3.7 - Checking for a URL
- Section 3.8 - CURL Examples using HTTP Codes
- Section 3.9 - Conclusion
Section 3.1: Introduction
For many Web developers, making simple requests and receiving simple responses is all they'll ever need, but for developers who want to master Ajax, a complete understanding of HTTP status codes, ready states, and the XMLHttpRequest object is required. In this chapter, I will show you the different status codes and demonstrate how browsers handle each and he will showcase the lesser-used HTTP requests that you can make with Ajax.
In the last chapter in this book, I provided a solid introduction to the XMLHttpRequest object, the centerpiece of an Ajax application that handles requests to a server-side application or script, and also deals with return data from that server-side component. Every Ajax application uses the XMLHttpRequest object, so you'll want to be intimately familiar with it to make your Ajax applications perform and perform well.
In this chapter, I move beyond the basics in the last chapter and concentrate on more detail about three key parts of this request object:
1. The HTTP ready state
2. The HTTP status code
3. The types of requests that you can make
Each of these is generally considered part of the plumbing of a request; as a result, little detail is recorded about these subjects. However, you will need to be fluent in ready states, status codes, and requests if you want to do more than just dabble in Ajax programming. When something goes wrong in your application -- and things always go wrong -- understanding ready states, how to make a HEAD request, or what a 400 status code means can make the difference between five minutes of debugging and five hours of frustration and confusion.
XMLHttpRequest or XMLHttp: A rose by any other name Microsoft and Internet Explorer use an object called XMLHttp instead of the XMLHttpRequest object used by Mozilla, Opera, Safari, and most non-Microsoft browsers. For the sake of simplicity, I refer to both of these object types simply as XMLHttpRequest. This matches the common practice you'll find all over the Web and is also in line with Microsoft's intentions of using XMLHttpRequest as the name of their request object in Internet Explorer 7.0. (For more on this, look at Chapter 2 again.)
I'll look at HTTP ready states first.
Section 3.2: Digging deeper into HTTP ready states
You should remember from the last chapter that the XMLHttpRequest object has a property called readyState. This property ensures that a server has completed a request and typically, a callback function uses the data from the server to update a Web form or page. Listing 1 shows a simple example of this.
Listing 1. Deal with a server's response in a callback function
function updatePage()
{
if (request.readyState == 4)
{
if (request.status == 200)
{
let response = request.responseText.split("|");
document.getElementById("order").value = response[0];
document.getElementById("address").innerHTML =
response[1].replace(/\n/g, "");
}
else
{
alert("status is " + request.status);
}
}
}
|
This is definitely the most common (and most simple) usage of ready states. As you might guess from the number "4," though, there are several other ready states (you also saw this list in the last chapter):
0: The request is uninitialized (before you've called open()).
1: The request is set up, but not sent (before you've called send()).
2: The request was sent and is in process (you can usually get content headers from the response at this point).
3: The request is in process; often some partial data is available from the response, but the server isn't finished with its response.
4: The response is complete; you can get the server's response and use it.
If you want to go beyond the basics of Ajax programming, you need to know not only these states, but when they occur and how you can use them. First and foremost, you need to learn at what state of a request you encounter each ready state. Unfortunately, this is fairly non-intuitive and also involves a few special cases.
Ready states in hiding
The first ready state, signified by the readyState property 0 (
readyState == 0), represents an uninitialized request. As soon as you call open() on your request object, this property is set to 1. Because you almost always call open() as soon as you initialize your request, it's rare to see readyState == 0. Furthermore, the uninitialized ready state is pretty useless in practical applications.Still, in the interest of being complete, check out Listing 2 which shows how to get the ready state when it's set to 0.
Listing 2. Get a 0 ready state
function getSalesData()
{
// Create a request object
createRequest();
alert("Ready state is: " + request.readyState);
// Setup (initialize) the request
let url = "/boards/servlet/UpdateBoardSales";
request.open("GET", url, true);
request.onreadystatechange = updatePage;
request.send(null);
}
|
In this simple example, getSalesData() is the function that your Web page calls to start a request (like when a button is clicked). Note that you've got to check the ready state before open() is called.
When 0 is equal to 4
In the use case where multiple JavaScript functions use the same request object, checking for a ready state of 0 to ensure that the request object isn't in use can still turn out to be problematic. Since readyState == 4 indicates a completed request, you'll often find request objects that are not being used with their ready state still set at 4 -- the data from the server was used, but nothing has occurred since then to reset the ready state. There is a function that resets a request object called abort(), but it's not really intended for this use. If you have to use multiple functions, it might be better to create and use a request object for each function rather than to share the object across multiple functions.
Obviously, this doesn't do you much good; there are very few times when you'll need to make sure that open() hasn't been called. The only use for this ready state in almost-real-world Ajax programming is if you make multiple requests using the same XMLHttpRequest object across multiple functions. In that (rather unusual) situation, you might want to ensure that a request object is in an uninitialized state (readyState == 0) before making a new requests. This essentially ensures that another function isn't using the object at the same time.
Viewing an in-progress request's ready state
Aside from the 0 ready state, your request object should go through each of the other ready states in a typical request and response, and finally end up with a ready state of 4. That's when the if (request.readyState == 4) line of code you see in most callback functions comes in; it ensures the server is done and it's safe to update a Web page or take action based on data from the server.
It is a trivial task to actually see this process as it takes place. Instead of only running code in your callback if the ready state is 4, just output the ready state every time that your callback is called. For an example of code that does this, check out Listing 3.
Listing 3. Check the ready state
function updatePage()
{
// Output the current ready state
alert("updatePage() called with ready state of " + request.readyState);
}
|
If you're not sure how to get this running, you'll need to create a function to call from your Web page and have it send a request to a server-side component (just such a function was shown in Listing 2 and throughout the examples in both chapter one and two). Make sure that when you set up your request, you set the callback function to updatePage(); to do this, set the onreadystatechange property of your request object to updatePage().
This code is a great illustration of exactly what onreadystatechange means -- every time the request's ready state changes, updatePage() is called and you see an alert.
Try this code yourself. Put it into your Web page and then activate your event handler (click a button, tab out of a field, or use whatever method you set up to trigger a request). Your callback function will run several times -- each time the ready state of the request changes -- and you'll see an alert for each ready state. This is the best way to follow a request through each of its stages.
Section 3.3: Browser inconsistencies
Once you've a basic understanding of this process, try to access your Web page from several different browsers. You should notice some inconsistencies in how these ready states are handled. For example, in Firefox 1.5, you see the following ready states:
1
2
3
4
This shouldn't be a surprise since each stage of a request is represented here. However, if you access the same application using Safari, you should see -- or rather, not see -- something interesting. Here are the states you see on Safari 2.0.1:
2
3
4
Safari actually leaves out the first ready state and there's no sensible explanation as to why; it's simply the way Safari works. It also illustrates an important point: While it's a good idea to ensure the ready state of a request is 4 before using data from the server, writing code that depends on each interim ready state is a sure way to get different results on different browsers.
For example, when using Opera 8.5, things are even worse with displayed ready states:
3
4
Last but not least, Internet Explorer responds with the following states:
1
2
3
4
If you have trouble with a request, this is the very first place to look for problems. Add an alert to show you the request's ready state so you can ensure that things are operating normally. Better yet, test on both Internet Explorer and Firefox -- you'll get all four ready states and be able to check each stage of the request.
Next I look at the response side.
Response data under the microscope
Once you understand the various ready states that occur during a request, you're ready to look at another important piece of the XMLHttpRequest object -- the responseText property. Remember from last chapter that this is the property used to get data from the server. Once a server has finished processing a request, it places any data that is needed to respond to the request back in the responseText of the request. Then, your callback function can use that data, as seen in Listing 1 and Listing 4.
Listing 4. Use the response from the server
function updatePage()
{
if (request.readyState == 4)
{
let newTotal = request.responseText;
let totalSoldEl = document.getElementById("total-sold");
let netProfitEl = document.getElementById("net-profit");
replaceText(totalSoldEl, newTotal);
/* Figure out the new net profit */
let boardCostEl = document.getElementById("board-cost");
let boardCost = getText(boardCostEl);
let manCostEl = document.getElementById("man-cost");
let manCost = getText(manCostEl);
let profitPerBoard = boardCost - manCost;
let netProfit = profitPerBoard * newTotal;
/* Update the net profit on the sales form */
netProfit = Math.round(netProfit * 100) / 100;
replaceText(netProfitEl, netProfit);
}
}
|
Listing 1 is fairly simple; Listing 4 is a little more complicated, but to begin, both check the ready state and then grab the value (or values) in the responseText property.
Viewing the response text during a request
Like the ready state, the value of the responseText property changes throughout the request's life cycle. To see this in action, use code like that shown in Listing 5 to test the response text of a request, as well as its ready state.
Listing 5. Test the responseText property
function updatePage()
{
// Output the current ready state
alert("updatePage() called with ready state of " + request.readyState +
" and a response text of '" + request.responseText + "'");
}
|
Now open your Web application in a browser and activate your request. To get the most out of this code, use either Firefox or Internet Explorer since those two browsers both report all possible ready states during a request. At a ready state of 2, for example, the responseText property is undefined; you'd see an error if the JavaScript console was open as well.
At ready state 3 though, the server has placed a value in the responseText property, at least in this example.
You'll find that your responses in ready state 3 vary from script to script, server to server, and browser to browser. Still, this is remains incredibly helpful in debugging your application.
Section 3.4: Getting safe data
All of the documentation and specifications insist that it's only when the ready state is 4 that data is safe to use. Trust me, you'll rarely find a case where the data cannot be obtained from the responseText property when the ready state is 3. However, to rely on that in your application is a bad idea -- the one time you write code that depends on complete data at ready state 3 is almost guaranteed to be the time the data is incomplete.
A better idea is to provide some feedback to the user that when the ready state is 3, a response is forthcoming. While using a function like alert() is obviously a bad idea -- using Ajax and then blocking the user with an alert dialog box is pretty counterintuitive -- you could update a field on your form or page as the ready state changes. For example, try to set the width of a progress indicator to 25 percent for a ready state of 1, 50 percent for a ready state of 2, 75 percent for a ready state of 3, and 100 percent (complete) when the ready state is 4.
Of course, as you've seen, this approach is clever but browser-dependent. On Opera, you'll never get those first two ready states and Safari drops the first one (1). For that reason, I'll leave code like this as an exercise for you to do rather than include it in this lesson.
Time to take a look at status codes.
A closer look at HTTP status codes
With ready state and the server's response in your bag of Ajax programming techniques, you're ready to add another level of sophistication to your Ajax applications -- working with HTTP status codes. These codes are nothing new to Ajax. They've been around on the Web for as long as there has been a Web. These codes (ready state codes and status codes) are not specific to just Ajax -- they are borned out of the Web, particularly the HTTP transfer protocal, that enables the client-server communication seamlessly.
You've probably already seen several of these through your Web browser:
401: Unauthorized
403: Forbidden
404: Not Found
You can find more (for a complete list at w3 consotium website). To add another layer of control and responsiveness (and particularly more robust error-handling) to your Ajax applications, then you need to check the status codes in a request and respond appropriately.
200: Everything is OK
In many Ajax applications, you'll see a callback function that checks for a ready state and then goes on to work with the data from the server response, as in Listing 6.
Listing 6. Callback function that ignores the status code
function updatePage()
{
if (request.readyState == 4)
{
let response = request.responseText.split("|");
document.getElementById("order").value = response[0];
document.getElementById("address").innerHTML =
response[1].replace(/\n/g, "<br />");
}
}
|
This turns out to be a short-sighted and error-prone approach to Ajax programming. If a script requires authentication and your request does not provide valid credentials, the server will return an error code like 403 or 401. However, the ready state will be set to 4 since the server answered the request (even if the answer wasn't what you wanted or expected for your request). As a result, the user is not going to get valid data and might even get a nasty error when your JavaScript tries to use non-existent server data.
It takes minimal effort to ensure that the server not only finished with a request, but returned an "Everything is OK" status code. That code is "200" and is reported through the status property of the XMLHttpRequest object. To make sure that not only did the server finish with a request but that it also reported an OK status, add an additional check in your callback function as shown in Listing 7.
Listing 7. Check for a valid status code
function updatePage()
{
if (request.readyState == 4)
{
if (request.status == 200)
{
let response = request.responseText.split("|");
document.getElementById("order").value = response[0];
document.getElementById("address").innerHTML =
response[1].replace(/\n/g, "<br />");
}
else
alert("status is " + request.status);
}
}
|
With the addition of a few lines of code, you can be certain that if something does go wrong, your users will get a (questionably) helpful error message rather than seeing a page of garbled data with no explanation.
Section 3.5: Redirection and rerouting
Before I talk in depth about errors, it's worth talking about something you probably don't have to worry about when you're using Ajax -- redirections. In HTTP status codes, this is the 300 family of status codes, including:
301: Moved permanently
302: Found (the request was redirected to another URL/URI)
305: Use Proxy (the request must use a proxy to access the resource requested)
Ajax programmers probably aren't concerned about redirections for two reasons:
First, Ajax applications are almost always written for a specific server-side script, servlet, or application. For that component to disappear and move somewhere else without you, the Ajax programmer, knowing about it is pretty rare. So more often than not, you'll know that a resource has moved (because you moved it or had it moved), change the URL in your request, and never encounter this sort of result.
And an even more relevant reason is: Ajax applications and requests are sandboxed. This means that the domain that serves a Web page that makes Ajax requests is the domain that must respond to those requests. So a Web page served from ebay.com cannot make an Ajax-style request to a script running on amazon.com; Ajax applications on ibm.com cannot make requests to servlets running on netbeans.org.
As a result, your requests aren't able to be redirected to another server without generating a security error. In those cases, you won't get a status code at all. You'll usually just have a JavaScript error in the debug console. So, while you think about plenty of status codes, you can largely ignore the redirection codes altogether.
Edge cases and hard cases
At this point, novice programmers might wonder what all this fuss is about. It's certainly true that less than 5 percent of Ajax requests require working with ready states like 2 and 3 and status codes like 403 (and in fact, it might be much closer to 1 percent or less). These cases are important and are called edge cases -- situations that occur in very unusual situations in which the oddest conditions are met. While unusual, edge cases make up about 80 percent of most users' frustrations!
Typical users forget the 100 times an application worked correctly, but clearly remember the one time it didn't. If you can handle the edge cases -- and hard cases -- smoothly, then you'll have content users that return to your site.
Errors
Once you've taken care of status code 200 and realized you can largely ignore the 300 family of status codes, the only other group of codes to worry about is the 400 family, which indicates various types of errors. Look back at Listing 7 and notice that while errors are handled, it's only a very generic error message that is output to the user. While this is a step in the right direction, it's still a pretty useless message in terms of telling the user or a programmer working on the application what actually went wrong.
First, add support for missing pages. This really shouldn't happen much in production systems, but it's not uncommon in testing for a script to move or for a programmer to enter an incorrect URL. If you can report 404 errors gracefully, you're going to provide a lot more help to confused users and programmers. For example, if a script on the server was removed and you use the code in Listing 7, you'd see a non-descript error.
The user has no way to tell if the problem is authentication, a missing script (which is the case here), user error, or even whether something in the code caused the problem. Some simple code additions can make this error a lot more specific. Take a look at Listing 8 which handles missing scripts as well as authentication errors with a specific message.
Listing 8. Check for a valid status code
function updatePage()
{
if (request.readyState == 4)
{
if (request.status == 200)
{
let response = request.responseText.split("|");
document.getElementById("order").value = response[0];
document.getElementById("address").innerHTML =
response[1].replace(/\n/g, "<br />");
}
else if (request.status == 404)
{
alert("Requested URL is not found.");
}
else if (request.status == 403)
{
alert("Access denied.");
}
else
{
alert("status is " + request.status);
}
}
}
|
This is still rather simple, but it does provide some additional information. In your own applications, you might consider clearing the username and password when failure occurs because of authentication and adding an error message to the screen. Similar approaches can be taken to more gracefully handle missing scripts or other 400-type errors (such as 405 for an unacceptable request method like sending a HEAD request that is not allowed, or 407 in which proxy authentication is required). Whatever choices you make, though, it begins with handling the status code returned from the server.
Section 3.6: Additional request types
If you really want to take control of the XMLHttpRequest object, consider this one last stop -- add HEAD requests to your repertoire. In the previous two chapters, I showed you how to make GET requests; in an upcoming chapter, you'll learn all about sending data to the server using POST requests. In the spirit of enhanced error handling and information gathering, though, you should learn how to make HEAD requests.
Making the request
Actually making a HEAD request is quite trivial; you simply call the open() method with "HEAD" instead of "GET" or "POST" as the first parameter, as shown in Listing 9.
Listing 9. Make a HEAD request with Ajax
function getSalesData()
{
// Create a request object
createRequest();
// Setup (initialize) the request
let url = "/boards/servlet/UpdateBoardSales";
request.open("HEAD", url, true);
request.onreadystatechange = updatePage;
request.send(null);
}
|
When you make a HEAD request like this, the server doesn't return an actual response as it would for a GET or POST request. Instead, the server only has to return the headers of the resource which include the last time the content in the response was modified, whether the requested resource exists, and quite a few other interesting informational bits. You can use several of these to find out about a resource before the server has to process and return that resource.
The easiest thing you can do with a request like this is to simply spit out all of the response headers. This gives you a feel for what's available to you through HEAD requests. Listing 10 provides a simple callback function to output all the response headers from a HEAD request.
Listing 10. Print all the response headers from a HEAD request
function updatePage()
{
if (request.readyState == 4)
{
alert(request.getAllResponseHeaders());
}
}
|
You can use any of these headers (from the server type to the content type) individually to provide extra information or functionality within an Ajax application.
Section 3.7: Checking for a URL
You've already seen how to check for a 404 error when a URL doesn't exist. If this turns into a common problem -- perhaps a certain script or servlet is offline quite a bit -- you might want to check for the URL before making a full GET or POST request. To do this, make a HEAD request and then check for a 404 error in your callback function; Listing 11 shows a sample callback.
Listing 11. Check to see if a URL exists
function updatePage()
{
if (request.readyState == 4)
{
if (request.status == 200)
{
alert("URL exists");
}
else if (request.status == 404)
{
alert("URL does not exist.");
}
else
{
alert("Status is: " + request.status);
}
}
}
|
To be honest, this has little value. The server has to respond to the request and figure out a response to populate the content-length response header, so you don't save any processing time. Additionally, it takes just as much time to make the request and see if the URL exists using a HEAD request as it does to make the request using GET or POST than just handling errors as shown in Listing 7. Still, sometimes it's useful to know exactly what is available; you never know when creativity will strike and you'll need the HEAD request!
Useful HEAD requests
One area where you'll find a HEAD request useful is to check the content length or even the content type. This allows you to determine if a huge amount of data will be sent back to process a request or if the server will try to return binary data instead of HTML, text, or XML (which are all three much easier to process in JavaScript than binary data).
In these cases, you just use the appropriate header name and pass it to the getResponseHeader() method on the XMLHttpRequest object. So to get the length of a response, just call request.getResponseHeader("Content-Length"). To get the content type, use request.getResponseHeader("Content-Type").
In many applications, making HEAD requests adds no functionality and might even slow down a request (by forcing a HEAD request to get data about the response and then a subsequent GET or POST request to actually get the response). However, in the event that you are unsure about a script or server-side component, a HEAD request can allow you to get some basic data without dealing with response data or needing the bandwidth to send that response.
Section 3.8: CURL Examples using HTTP Codes.
For the description of the family of codes, see this link.
<?php
// Create a cURL handle
$ch = curl_init('http://www.example.com/');
// Execute
curl_exec($ch);
// Check HTTP status code
if (!curl_errno($ch))
{
switch ($http_code = curl_getinfo($ch, CURLINFO_HTTP_CODE))
{
case 200: # OK -- meaning, the request was successfully and the response was also successfully
// do something, such as processing the response returned by the server
break;
case 201: # Created
// do something
break;
case 202: # Accepted
// do something
break;
case 203: # Non-Authoritative Information
// do something
break;
case 204: # No Content
// do something
break;
default:
echo 'Unexpected HTTP code: ', $http_code, "\n";
}
}
// Close handle
curl_close($ch);
?>
Continuing on to add some more settings.
<?php
// create cURL handle (ch)
$ch = curl_init();
if (!$ch)
{
die("Couldn't initialize a cURL handle");
}
// set some cURL options
// these settings are very minimal -- you can add more settings to suite your goal!
curl_setopt($ch, CURLOPT_URL, "http://www.example.com");
curl_setopt($ch, CURLOPT_HEADER, 1);
curl_setopt($ch, CURLOPT_FOLLOWLOCATION, 1);
curl_setopt($ch, CURLOPT_RETURNTRANSFER, 0);
curl_setopt($ch, CURLOPT_TIMEOUT, 30);
// execute
$response = curl_exec($ch);
if (empty($response))
{
// some kind of an error happened
die(curl_error($ch));
// close cURL handler
curl_close($ch);
}
else
{
$info = curl_getinfo($ch);
// close cURL handler
curl_close($ch);
if (empty($info['http_code']))
{
die("No HTTP code was returned");
}
else
{
// pick out the HTTP codes from the server response
switch ($http_code = curl_getinfo($ch, CURLINFO_HTTP_CODE))
{
case 200: # OK -- meaning, the request was successfully and the response was also successfully
// do something, such as processing the response returned by the server
break;
case 201: # Created -- actually most of the time you don't even need to branch out to these
# codes -- maybe only certain situations only!
// do something
break;
case 202: # Accepted -- implement this if your situation needed
// do something
break;
case 203: # Non-Authoritative Information -- implement this if your situation needed
// do something
break;
case 204: # No Content -- implement this if your situation needed
// do something
break;
default:
echo 'Unexpected HTTP code: ', $http_code, "\n";
}
// echo results
echo "The server responded:
";
echo $http_code['http_code'];
}
}
?>
Section 3.9: Conclusion.
For many Ajax and Web programmers, the material in this chapter seems fairly advanced. What is the value in making a HEAD request? What is really a case where you should handle a redirection status code explicitly in your JavaScript? These are good questions; for simple applications, the answer is that these advanced techniques are unlikely to be valuable.
However, the Web is no longer a place where simple applications are tolerated; users have become more advanced, customers expect robustness and advanced error reporting, and managers are fired because an application goes down 1 percent of the time.
It's your job then, to go beyond a simple application and that requires a more thorough understanding of XMLHttpRequest.
If you can account for the various ready states -- and understand how they differ from browser to browser -- you'll be able to debug an application quickly. You might even come up with creative functionality based on a ready status and report on a request's status to users and customers.
If you have a handle on status codes, you can set your application up to deal with a script's errors, unexpected responses, and edge cases. As a result, your application will work all of the time, rather than just in the situation where everything goes exactly right.
Add to this the ability to make HEAD requests, check for the existence of a URL, and find out when a file was modified, and you can ensure that users get valid pages, are up-to-date on their information, and (most importantly) surprise them with just how robust and versatile your application is.
/**
* Here is a list of the Hypertext Transfer Protocol (HTTP) Status Code Registry
*
* As stated earlier, these codes are not specific to just Ajax, but rather,
* they are bourned out of the Web since the birth of the Web.
*/
HTTP Status Codes
Value Description
----- -----------
the 100 family: Connection
100 Continue
101 Switching Protocols
102 Processing
103 Early Hints
104-199 Unassigned (these codes are for user-defined code -- it's an all-purpose type of codes)
the 200 family: Successful 2xx
200 OK (the request went through ok and also the response came back ok)
201 Created -- if the request to create something is successful -- it's created successfully
202 Accepted -- it's accepted the sent content successfully
203 Non-Authoritative Information
204 No Content
205 Reset Content
206 Partial Content
207 Multi-Status
208 Already Reported
209-225 Unassigned (these codes are for user-defined code --it's an all-purpose type of codes)
226 IM Used
227-299 Unassigned (these codes are for user-defined code -- it's an all-purpose type of codes)
the 300 family: Redirection 3xx
300 Multiple Choices
301 Moved Permanently
302 Found
303 See Other
304 Not Modified
305 Use Proxy
306 (Unused)
307 Temporary Redirect
308 Permanent Redirect
309-399 Unassigned (these codes are for user-defined code -- it's an all-purpose type of codes)
the 400 family: Client Error 4xx
400 Bad Request
401 Unauthorized
402 Payment Required
403 Forbidden
404 Not Found
405 Method Not Allowed
406 Not Acceptable
407 Proxy Authentication Required
408 Request Timeout
409 Conflict
410 Gone
411 Length Required
412 Precondition Failed
413 Content Too Large
414 URI Too Long
415 Unsupported Media Type
416 Range Not Satisfiable
417 Expectation Failed
418 (Unused)
419-420 Unassigned (these codes are for user-defined code -- it's an all-purpose type of codes)
421 Misdirected Request
422 Unprocessable Content
423 Locked
424 Failed Dependency
425 Too Early
426 Upgrade Required
427 Unassigned
428 Precondition Required
429 Too Many Requests
430 Unassigned (these codes are for user-defined code -- it's an all-purpose type of codes)
431 Request Header Fields Too Large
432-450 Unassigned (these codes are for user-defined code -- it's an all-purpose type of codes)
451 Unavailable For Legal Reasons
452-499 Unassigned (these codes are for user-defined code -- it's an all-purpose type of codes)
the 500 family: Server Error 5xx
500 Internal Server Error
501 Not Implemented
502 Bad Gateway
503 Service Unavailable
504 Gateway Timeout
505 HTTP Version Not Supported
506 Variant Also Negotiates
507 Insufficient Storage
508 Loop Detected
509 Unassigned (these codes are for user-defined code -- it's an all-purpose type of codes)
510 Not Extended
511 Network Authentication Required
512-599 Unassigned (these codes are for user-defined code -- it's an all-purpose type of codes)
This chapter isn't going to make your applications flashy, help you highlight text with fading yellow spotlights, or feel more like a desktop. While these are all strengths of Ajax (and topics we'll cover in subsequent chapters), they are to some degree just icing on the cake. If you can use Ajax to build a solid foundation in which your application handles errors and problems smoothly, users will return to your site and application. Add to this the visual trickery that I'll talk about in upcoming chapters and you'll have thrilled, excited, and happy customers. (Seriously, you don't want to miss the next chapter!)
Chapter 4
- Section 4.1 - Introduction
- Section 4.2 - Web programmers and markup
- Section 4.3 - A closer look at Web browsers
- Section 4.4 - Moving to a tree view
- Section 4.5 - Strict is sometimes good
- Section 4.6 - Sloppy HTML
- Section 4.7 - Introducing the DOM
- Section 4.8 - Conclusion
Section 4.1: Introduction
Before I dive into the DOM, I want to explain one nagging issue that seems to confuse a lot of programmers, and that is, the difference between a class and an object.
What is the difference between a class and an object ?
Both class and object have the same meaning and both achieve the same purpose but differ only in the way they're implemented and used.
A class consists of constant variables, properties, and methods. Those are the three basic attributes of a class. That's all a class is: it has three attributes -- a very simple concept and yet very powerful.
Consider the following class definition:
<?php
class MyClass
{
// 1st attribute of the class (MyClass):
// declaring class constant variables
// COMMAND_EVENT_START, COMMAND_BEFORE_START,
// COMMAND_AFTER_START are constant variables
// command_start, before_start, after_start are constant values
const COMMAND_BEFORE_START = 'before_start';
const COMMAND_EVENT_START = 'command_start';
const COMMAND_AFTER_START = 'after_start';
// 2nd attribute of the class (MyClass):
class properties: properties must be declared prefacing with visibility control
public, protected, private are visibility control:
public make = 'Toyota';
protected model = 'Tundra';
private color = 'grey';
// 3rd attribute of the class (MyClass):
class methods: methods must be declared prefacing with visibility control
public, protected, private are visibility control:
public function test1()
{
// will output: An object is just a copy of the class.
document.write ("An object is just a copy of the class.");
}
public function test2(str)
{
// will output whatever string got passed in via str
document.write (str);
}
}
?>
And then consider this object creation:
str = 'An object is just a copy of the class.';
creating an instance of MyClass()
obj is an instance of the class MyClass. it is a copy or a clone of MyClass.
obj = new MyClass();
obj->test1(str);
will output an error message saying argument str is undefined in test1().
obj->test1();
will output ----> An object is just a copy of the class.
obj->test2();
will output an error message saying test2() requires at least one argument.
obj->test2(str);
will output -----> An object is just a copy of the class.
A class is the program you write (i.e., the MyClass class implementation above); while object (i.e., obj) is the copy of the class or the clone of the class, most often being known as the instance of the class.
A class resides in ROM (permanent memory area) whereas object (i.e., obj) resides in RAM (temporary memory area.)
In ROM, data is stored there permanently even when the computer is turned off. In a RAM memory area, on the other hand, data get stored temporarily while the program is running or while the computer is still turned on. When the computer is turned off, the RAM data (i.e., obj) is completely erased and is no longer stored in the RAM.
Instances of a class can be useful only while the program is running or while the computer is turned on; and when the program is not running or when the computer is turned off, instances of a class are no longer useful to a program; and therefore, it is stored in a temporary memory area.
Instances of a class can be created 'on the fly' at any time when needed by a program [as you can see above: obj = new MyClass()].
Instances of a class are often being created from everywhere when needed (i.e., libraries, frameworks, and other classes, etc.)
So there is no need to store instances of a class permanently in permanent memory spaces and wasting valuable memory spaces.
Now on to the introduction of Document Object Model or DOM
The great divide between programmers (who work with back-end applications) and Web programmers (who spend their time writing HTML, CSS, and JavaScript) is long standing. However, the Document Object Model (DOM) bridges the chasm and makes working with both XML on the back end and HTML on the front end possible and an effective tool. In this chapter, I will introduce the Document Object Model, explains its use in Web pages, and starts to explore its usage from JavaScript.
Like many Web programmers, you have probably worked with HTML. HTML is how programmers start to work on a Web page; HTML is often the last thing they do as they finish up an application or site, and tweak that last bit of placement, color, or style. And, just as common as using HTML is the misconception about what exactly happens to that HTML once it goes to a browser to render to the screen. Before I dive into what you might think happens -- and why it is probably wrong -- I want you to be clear on the process involved in designing and serving Web pages:
1. Someone (usually you!) creates HTML in a text editor or IDE.2. You then upload the HTML to a Web server, like Apache HTTPD, and make it public on the Internet or an intranet.
3. A user requests your Web page with a browser like Firefox or Safari.
4. The user's browser makes a request for the HTML to your Web server.
5. The browser renders the page it receives from the server graphically and textually; users look at and activate the Web page.
While this feels very basic, things will get interesting quickly. In fact, the tremendous amount of "stuff" that happens between steps 4 and 5 is what the focus of this tutorial. The term "stuff" really applies too, since most programmers never really consider exactly what happens to their markup when a user's browser is asked to display it:
1. Does the browser just read the text in the HTML and display it?
2. What about CSS, especially if the CSS is in an external file?
3. And what about JavaScript -- again often in an external file?
4. How does the browser handle these items and how does it map event handlers, functions, and styles to that textual markup?
It turns out that the answer to all these questions is the Document Object Model. So, without further ado, let's dig into the DOM.
Section 4.2: Web Programmers and Markup
For most programmers, their job ends where the Web browser begins. In other words, once you drop a file of HTML into a directory on your Web server, you usually file it away as "done" and (hopefully) never really think about it again! That's a great goal when it comes to writing clean, well-organized pages, too; there's nothing wrong with wanting your markup to display what it should, across browsers, with various versions of CSS and JavaScript.
The problem is that this approach limits a programmer's understanding of what really happens in the browser. More importantly, it limits your ability to update, change, and restructure a Web page dynamically using client-side JavaScript. Get rid of that limitation, and allow even greater interaction and creativity on your Web sites.
What the programmer does
As the typical Web programmer, you probably fire up your text editor and IDE and start to enter HTML, CSS, or even JavaScript. It's easy to think about those tags and selectors and attributes only as little tasks that you do to make a site look just right. But you need to stretch your mind beyond that point -- instead, realize that you are organizing your content. Don't worry; I promise this won't turn into a lecture on the beauty of markup, how you must realize the true potential of your Web page, or anything else meta-physical. What you do need to understand is exactly what your role in Web development is.
When it comes to how a page looks, at best you're only able to make suggestions. When you provide a CSS stylesheet, a user can override your style choices. When you provide a font size, a user's browser can alter those sizes for the visually impaired or scale them down on massive monitors (with equally massive resolutions). Even the colors and font faces you choose are subject to the monitor of users and the fonts that users install on their systems. While it's great to do your best in styling a page, that's not the largest impact you have on a Web page.
What you do absolutely control is the structure of your Web page. Your markup is unchangeable and unalterable and users can't mess with it; their browsers can only retrieve it from your Web server and display it (albeit with a style more in line with the user's tastes than your own). But the organization of that page -- whether this word is inside that paragraph or in the other div -- is solely up to you. When it comes to actually changing your page (which is what most Ajax applications focus on), it's the structure of your page that you operate on. While it's nice to change the color of a piece of text, it's much more dramatic to add text or an entire section to an existing page. No matter how the user styles that section, you work with the organization of the page itself.
What the markup does
Once you realize that your markup is really about organization, you can view it differently. Rather than think that an h1 causes text to be big, black, and bold, think about an h1 as a heading. How the user sees that -- and whether they use your CSS, their own, or some combination of the two -- is a secondary consideration. Instead, realize that markup is all about providing this level of organization; a p indicates that text is in a paragraph, img denotes an image, div divides a page up into sections, and so forth.
You should also be clear that style and behavior (event handlers and JavaScript) are applied to this organization after the fact. The markup has to be in place to be operated upon or styled. So, just as you might have CSS in an external file to your HTML, the organization of your markup is separate from its style, formatting, and behavior. While you can certainly change the style of an element or piece of text from JavaScript, it's more interesting to actually change the organization that your markup lays out.
As long as you keep in mind that your markup only provides an organization, or framework, for your page, you're ahead of the game. And a little further on, you'll see how the browser takes all this textual organization and turns it into something much more interesting -- a set of objects, each of which can be changed, added to, or deleted.
Some additional thoughts on markupPlain text editing: Right or wrong? Plain text files are ideal for storing markup, but that doesn't hold true for editing that markup. It's perfectly acceptable to use an IDE like Macromedia DreamWeaver -- or the slightly more intrusive Microsoft FrontPage -- to work on Web page markup. These environments often offer shortcuts and help in creating Web pages, especially when you're using CSS and JavaScript, each from a file external to an actual page's markup. Many folks still prefer good old Notepad or vi (I confess I'm one of those folk) and that's a great option as well. In either case, the final result is a text file full of markup.
Text over the network: A good thing
As already mentioned, text is a great medium for a document -- like HTML or CSS -- that is transferred over a network hundreds and thousands of times. When I say that the browser has a hard time representing text, that means specifically turning text into the visual and graphical page that users view. This has no bearing on how the browser actually retrieves a page from a Web server; in that case, text is still very much the best option.
The advantages of text markup
Before I discuss the Web browser, it's worth considering why plain text is absolutely the best choice for storing your HTML. Without getting into the pros and cons, simply recall that your HTML is sent across a network to a Web browser every time the page is viewed (putting caching and so forth aside for simplicity's sake). There's simply no more efficient approach to take than passing along text. Binary objects, graphical representations of the page, a re-organized chunk of markup ... all of these are harder to send across the network than plain text files.
Add to that the value that a browser adds to the equation. Today's browsers allow users to change the size of text, scale images, download the CSS or JavaScript for a page (in most cases), and a lot more -- this all precludes sending any kind of graphical representation of the page to the browser. Instead, the browser needs the raw HTML so it can apply whatever processing to the page in the browser rather than trusting the server to handle that task. In the same vein, separating CSS from JavaScript and separating those from the HTML markup requires a format that is easy to, well, separate. Text files again are a great way to do just this.
Last, but not least, remember that the promise of new standards like HTML 4.01 and XHTML 1.0 and 1.1 separates content (the data in your page) from presentation and style (usually applied by CSS). For programmers to separate their HTML from their CSS, then force a browser to retrieve some representation of a page that melds these all back together, defeats much of the advantage of these standards. To keep these disparate parts separate all the way down to the browser allows the browser the most flexibility in getting the HTML from the server.
Section 4.3: A closer look at Web browsers
For some of you, everything you've read so far may be droll review of your role in the Web development process. But when it comes to what the Web browser does, many of the most savvy Web designers and developers often don't realize what actually goes on "under the hood." I'll focus on that in this section. And don't worry, code is coming soon, but hold off on your coding impatience because really understanding exactly what a Web browser does is essential to your code working correctly.
The disadvantages of text markup
Just as text markup has terrific advantages for a designer or page creator, it also has rather significant disadvantages for a browser. Specifically, browsers have a very difficult time directly representing text markup to a user visually. Consider these frequent browser tasks:
1. Apply CSS styles -- often from multiple stylesheets in external files -- to markup based on the type of element, its class, its ID, and its position in the HTML document.
2. Apply styles and formatting based on JavaScript code -- also often in external files -- to different parts of the HTML document.
3. Change the value of form fields based on JavaScript code.
Support visual effects like image rollovers and image swapping based on JavaScript code. The complexity isn't in coding these tasks; it's fairly easy to do each of these things. The complexity comes from the browser actually carrying out the requested action. If markup is stored as text and, for example, you want to center the text (text-align: center) in a p element in the center-text class, how do you accomplish that?
1. Do you add inline styling to the text?
2. Do you apply the styling to the HTML text in the browser and just keep up with which content to centered or not center?
3. Do you apply unstyled HTML and then apply format after the fact?
These very difficult questions are why few people code browsers these days. (Those who do should receive a hearty "Thanks!")
Clearly, plain text isn't a great way to store HTML for the browser even though text was a good solution for getting a page's markup in the first place. Add to this the ability for JavaScript to change the structure of a page and things really get tricky. Should the browser rewrite the modified structure to disk? How can it keep up with what the current stage of the document is?
Clearly, text isn't the answer. It's difficult to modify, clumsy to apply styles and behavior to, and ultimately bears little likeness to the dynamic nature of today's Web pages.
Section 4.4: Moving to a tree view
The answer to this problem -- at least, the answer chosen by today's Web browsers -- is to use a tree structure to represent HTML. Take a look at Listing 1, a rather simple and boring HTML page represented as text markup.
Listing 1. Simple HTML page in text markup
<html>
<head>
<title>Trees, trees, everywhere</title>
</head>
<body>
<h1>Trees, trees, everywhere</h1>
<p>Welcome to a <em>really</em> boring page.
<div>
Come again soon.
<img src="come-again.gif" />
</div>
</body>
</html>
|
The browser takes this and converts it into a tree-like structure.
I made a few very minor simplifications to keep this tutorial on track. Experts in the DOM or XML will realize that whitespace can have an effect on how text in a document is represented and broken up in the Web browser's tree structure. Getting into this does little but confuse the matter, so if you know about the effect of whitespace, great; if not, read on and don't worry about it. When it becomes an issue, you'll find out all you need at that time.
Other than the actual tree background, the first thing you might notice here is that everything in the tree begins with the outer-most, containing element of HTML, which is the html element. This is called the root element in keeping with the tree metaphor. So even though this is at the bottom of the tree, always begin here when you look at and analyze trees. If it helps, you're welcome to flip the whole thing upside down, although that does stretch the tree metaphor a bit.
From the root flow out lines that show the relationships between different pieces of markup. The head and body elements are children of the html root element; title is a child of head and then the text "Trees, trees, everywhere" is a child of title. The entire tree is organized like this until the browser gets a structure.
A few additional terms
To carry on with the tree metaphor, head and body are said to be branches of html. They are branches because they in turn have children of their own. When you reach the extremities of the tree, you'll run into mostly text such as "Trees, trees, everywhere" and "really." These are often referred to leaves because they have no children of their own. You don't need to memorize all these terms and it is often easier to just visualize the tree structure when you try to figure out what a particular term means.
The value of objects
Now that you have some basic terminology in hand, it's time to focus more on those little rectangles with element names and text inside it. Each rectangles is an object; that's where the browser resolves some of these problems with text. By using objects to represent each piece of the HTML document, it becomes very easy to change the organization, apply styles, allow JavaScript to access the document, and much more.
Object types and properties
Each possible type of markup gets its own object type. For instance, elements in your HTML are represented by an Element object type. The text in your document is represented by a Text type, attributes are represented by Attribute types, and right on down the line.
So the Web browser not only gets to use an object model to represent your document -- getting away from having to deal with static text -- but can immediately tell what something is by its object type. The HTML document is parsed and turned into the set of objects and then things like angle brackets and escape sequences (for example, using < for < and > for >) no longer become an issue. This makes the job of the browser, at least after it parses the input HTML, much easier. The operation to figure out whether something is an element or an attribute and then determine what to do with that type of object is simple.
By using objects, the Web browser can then change those objects' properties. For example, each element object has a parent and a list of children. So adding a new child element or text is simply a matter of adding a new child to an element's list of children. These objects also have a style property, so it becomes trivial to change the style of an element or piece of text on the fly. For example, you might change the height of a div using JavaScript like this:
someDiv.style.height = "300px";
In other words, the Web browser can very easily change the appearance and structure of the tree using object properties like this. Compare this to the complicated sorts of things that the browser must do if it represented the page as text internally; every change of property or structure requires the browser to rewrite the static file, re-parse it, and re-display it on the screen. All of this becomes possible with objects.
At this point, take time to pull open some of your HTML documents and sketch them out as trees. While that seems an unusual request -- especially from a section that contains very little code -- you will need to become familiar with the structure of these trees if you want to be able to manipulate them.
In the process, you'll probably find some oddities. For example, consider the following situations:
1. What happens to attributes?
2. What about text that is broken up with elements, like em and b?
3. And what about HTML that isn't structured correctly (like when a closing p tag is missing)?
Once familiar with these sorts of issues, you'll understand the next few sections a lot better.
Section 4.5: Strict is sometimes good
If you tried the exercise I just mentioned, you probably found some of the potential troubles for a tree-view of your markup (if you didn't exercise, just take my word for it!). In fact, you'll find several of these in Listing 1, starting with the way the p element was broken up. If you ask the typical Web developer what the text content of the p element is, the most common answer would be, "Welcome to a really boring Web page."
It turns out that the p element has three different child objects and none contain all of the text "Welcome to a really boring Web page." You'll find parts of that text, like "Welcome to a " and " boring Web page", but not all of it. To understand this, remember that everything in your markup has to be turned into an object of some type.
Furthermore, the order does matter! Can you imagine how users would respond to a Web browser if it showed the correct markup, but in a different ordering than you provided in your HTML? Paragraphs were sandwiched in between titles and headings, even when that's not how you organized the document yourself? Obviously, the browser must preserve the order of elements and text.
In this case, the p element has three distinct parts:
1. The text that comes before the em element
2. Tthe em element itself
3. The text that comes after the em element
If you mix this ordering up, you might apply the emphasis to the wrong portion of text. To keep this all straight, the p element has three object children in the order that those things appeared in the HTML in Listing 1. Further, the emphasized text "really" isn't a child element of p; it is a child of em which is a child of p.
It is very important for you to understand this concept. Even though the "really" text will probably display along with the rest of the p element's text, it still is a direct child of the em element. It can have different formatting from the rest of the p and can be moved around independently of the rest of the text.
To help cement this in your mind, try to diagram the HTML in Listings 2 and 3, making sure you keep text with its correct parent (despite how that text might end up looking on screen).
Listing 2. Markup with slightly tricky element nesting
<html>
<head>
<title>This is a little tricky</title>
</head>
<body>
<h1>Pay <u>close</u> attention, OK?</h1>
<div>
<p>Welcome to a <em>really</em> boring page.
<p>This p really isn't <em>necessary</em>, but it makes the
<span id="bold-text">structure <i>and</i> the organization</span>
of the page easier to keep up with.</p>
</div>
</body>
</html>
Listing 3. Even trickier nesting of elements
<html>
<head>
<title>Trickier nesting, still</title>
</head>
<body>
<div id="main-body">
<div id="contents">
<table>
<tr><th>Steps</th><th>Process</th></tr>
<tr><td>1</td><td>Figure out the <em>root element</em>.</td></tr>
<tr><td>2</td><td>Deal with the <span id="code">head</span> first,
as it's usually easy.</td></tr>
<tr><td>3</td><td>Work through the <span id="code">body</span>.
Just <em>take your time</em>.</td></tr>
</table>
</div>
<div id="closing">
This link is <em>not</em> active, but if it were, the answers
to this <a href="answers.html"><img src="exercise.gif" /></a> would
be there. But <em>do the exercise anyway!</em>
</div>
</div>
</body>
</html>
|
Try to take the time to work these out for yourself. It will help you understand how strictly rules apply to organizing the tree and really help you in your quest to master HTML and its tree structure.
What about attributes?
Did you run across any problems as you tried to figure out what to do with attributes? As I mentioned, attributes do have their own object type, but an attribute is really not the child of the element it appears on -- nested elements and text are not at the same "level" of an attribute and you'll notice that the answers to the exercises in Listings 2 and 3 do not have attributes shown.
Attributes are in fact stored in the object model that a browser uses, but they are a bit of a special case. Each element has a list of attributes available to it, separate from the list of child objects. So a div element might have a list that contained an attribute named "id" and another named "class." For example, you might want to classify your code into customer's information such as name, address, phone, and other information, etc, and customer's order containing items the customer has ordered from you. So you would place a list of attributes in a div element like this:
<DIV id="customer" class="order">some content here</DIV>
|
Keep in mind that attributes for an element must have unique names (e.g., one id as in id="customer" and one class as in class="order"); in other words, an element cannot have two "id" or two "class" attributes. This makes the list very easy to keep up with and to access. As you'll see in the next chapter, you can simply call a method like getAttribute("id") to get the value of an attribute by its name. You can also add attributes and set (or reset) the value of existing attributes with similar method calls.
It's also worth pointing out that the uniqueness of attribute names makes this list different than the list of child objects. A p element could have multiple em elements within it, so the list of child objects can contain duplicate items. While the list of children and the list of attributes operate similarly, one can contain duplicates (the children of an object) and one cannot (the attributes of an element object). Finally, only elements can have attributes, so text objects have no lists attached to them for storing attributes.
Section 4.6: Sloppy HTML
Before I move on, one more topic is worth some time when it comes to how the browser converts markup to a tree representation -- how a browser deals with markup that is not well-formed. Well-formed is actually a term largely used in XML and means two basic things:
1. Every opening tag has a matching closing tag. So every <p> is matched in the document by a </p>, every <div> by a </div>, and so forth.
2. The innermost opening tag is matched with the innermost closing tag, then the next innermost opening tag by the next innermost closing tag, and so forth. So <b><i>bold and italics</b></i> would be illegal because the innermost opening tag -- <i> -- is improperly matched with the innermost closing tag -- <b>. To make this well-formed, you would need to switch either the opening tag order or the closing tag order. (If you switched both, you'd still have a problem).
Study these two rules closely. They are both rules that not only increase the simple organization of a document, but they also remove ambiguity. Should bolding be applied first and then italics? Or the other way around? If it seems that this ordering and ambiguity is not a big deal, remember that CSS allows rules to override other rules so if, for example, the font for text within b elements was different than the font for within i elements, the order in which formatting was applied becomes very important. Therefore, the well-formedness of an HTML page comes into play.
In cases where a browser receives a document that is not well-formed, it simply does the best it can. The resulting tree structure is at best an approximation of what the original page author intended and at worst something completely different. If you ever loaded your page in a browser and saw something completely unexpected, you might have viewed the result of a browser trying to guess what your structure should be and doing the job poorly. Of course, the fix to this is pretty simple: Make sure your documents are well-formed! If you're unclear on how to write standardized HTML like this, consult the appropriate resources for help.
Section 4.7: Introducing the DOM
So far you've heard that browsers turn a Web page into an object representation and maybe you've even guessed that the object representation is a DOM tree. DOM stands for Document Object Model and is a specification available from the World Wide Web Consortium (W3C).
More importantly though, the DOM defines the objects' types and properties that allow a browser to represent markup. (Next chapter focuses on the specifics of using the DOM from your JavaScript and Ajax code.)
The document object
First and foremost, you will need to access the object model itself. This is remarkably easy; to use the built-in document variable in any piece of JavaScript code running on your Web page, you can write code like this:
let domTree = document;
Of course, this code is pretty useless in and of itself, but it does demonstrates that every Web browser makes the document object available to JavaScript code and that the object represents the complete tree of markup.
Everything is a node
Clearly, the document object is important, but is just the beginning. Before you can go further, you need to learn another term: node. You already know that each bit of markup is represented by an object, but it's more than just any object -- it's a specific type of object, a DOM node. The more specific types -- like text, elements, and attributes -- extend from this basic node type. So you have text nodes, element nodes, and attribute nodes.
If you've programmed much in JavaScript, it should occur to you that you might already be using DOM code. If you followed this Ajax tutorial thus far, then you've definitely used DOM code for some time now. For example, the line var number = document.getElementById("phone").value; uses the DOM to find a specific element and then to retrieve the value of that element (in this case, a form field). So even if you didn't realize it, you used the DOM every time you typed document into your JavaScript code.
To refine the terms you've learned then, a DOM tree is a tree of objects, but more specifically it is a tree of node objects. In Ajax applications -- or any other JavaScript -- you can work with those nodes to create such effects as removing an element and its content, highlighting a certain piece of text, or adding a new image element. Since this all occurs on the client side (code that runs in your Web browser), these effects take place immediately without communication with the server. The end result is often an application that feels more responsive because things on the Web page change without long pauses while a request goes to a server and a response is interpreted.
In most programming languages, you need to learn the actual object names for each type of node, learn the properties available, and figure out about types and casting; but none of this is necessary in JavaScript. You can simply create a variable and assign it the object you want (as you've already seen):
let domTree = document;
let phoneNumberElement = document.getElementById("phone");
let phoneNumber = phoneNumberElement.value;
There are no types and JavaScript handles creating the variables and assigning them the correct types as needed. As a result, it becomes fairly trivial to use the DOM from JavaScript (a later chapter focuses on the DOM in relation to XML and things are a little trickier).
Section 4.8: Conclusion.
At this point, I'm going to leave you with a bit of a cliffhanger. Obviously, this hasn't been a completely exhaustive coverage of the DOM; in fact, this chapter is little more than an introduction to the DOM. There is more to DOM than I've shown you today!
The next chapter in this series will expand upon these ideas and dive more into how you can use the DOM in your JavaScript to update Web pages, make changes to your HTML on the fly, and create a more interactive experience for your user. I'll come back to DOM once again in later chapters which focus on using XML in your Ajax requests. So become familiar with the DOM; it's a major part of Ajax applications.
It would be pretty simple to launch into more of the DOM at this point, detailing how to move within a DOM tree, get the values of elements and text, iterate through node lists, and more, but that would probably leave you with the impression that the DOM is about code -- it's not.
Before the next chapter, try to think about tree structures and work through some of your own HTML to see how a Web browser would turn that HTML into a tree view of the markup. Also, think about the organization of a DOM tree and work through the special cases discussed in this chapter: attributes, text that has elements mixed in with it, elements that don't have text content (like the img element).
If you get a firm grasp of these concepts and then learn the syntax of JavaScript and the DOM (in the next chapter), it will make crafting responsiveness much easier.
Chapter 5
- Section 5.1 - Introduction
- Section 5.2 - Cross browser, cross language
- Section 5.3 - Properties of a node
- Section 5.4 - Methods of a node
- Section 5.5 - API design notes
- Section 5.6 - The document node
- Section 5.7 - What type of node?
- Section 5.8 - Conclusion
Section 5.1: Introduction
Last chapter I introduced the Document Object Model, whose elements work behind the scenes to define your Web pages. This chapter, we'll dive even deeper into the DOM. Learn how to create, remove, and change the parts of a DOM tree, and take the next step toward updating your Web pages on the fly!
If you followed my discussion in this book last chapter, then you got a first-hand look at what goes on when a Web browser displays one of your Web pages. As I explained then, when the HTML and CSS you've defined for your page is sent to a Web browser, it's translated from text to an object model. This is true whether the code is simple or complex, housed all in one file or in separate files.
The browser then works directly with the object model, rather than the text files you supplied. The model the browser uses is called the Document Object Model. It connects objects representing the elements, attributes, and text in your documents. All the styles, values, and even most of the spaces in your HTML and CSS are incorporated into the object model. The specific model for a given Web page is called the page's DOM tree.
Understanding what a DOM tree is, and even knowing how it represents your HTML and CSS, is just the first step in taking control of your Web pages. Next, you need to learn how to work with the DOM tree for a particular Web page. For instance, if you add an element to the DOM tree, that element immediately appears in a user's Web browser -- without the page reloading.
Remove some text from the DOM tree, and that text vanishes from the user's screen. You can change and interact with the user interface through the DOM, which gives you tremendous programming power and flexibility. Once you learn how to work with a DOM tree you've taken a huge leap toward mastering rich, interactive, dynamic Web sites.
Note that the following discussion builds on last chapter's "Exploiting the DOM for Web response;" if you haven't read that tutorial, you might want to do so before you proceed here.
Acronym pronunciation matters
In many ways, the Document Object Model could just as easily have been called the Document Node Model. Of course, most people don't know what the term node means, and "DNM" isn't nearly as easy to pronounce as "DOM," so it's easy to understand why the W3C went with DOM.
Even with that, I, personally, still think that the W3C have made a mistake as well in deriving the acronym DOM from Document Object Model. But, I think the acronym DOM should have been derived from Dynamic Object Model instead, because it is more closely appropriate to the actual nature of the DOM, which is very dynamic in the way it functions as an object. Dynamic object -- get it? It can work with HTML dynamically!
Section 5.2: Cross browser, cross language
The Document Object Model is a W3C standard. Because of that, all modern Web browsers support the DOM, at least to some degree. While there is some variance among browsers, if you use core DOM functionality -- and pay attention to a few special cases and exceptions -- your DOM code will work on any browser in the same way. The code you write to modify a Web page in Opera will work on Apple's Safari, Firefox, Microsoft Internet Explorer, and Mozilla.
The DOM is also a cross-language specification; in other words, you can use it from most of the popular programming languages. The W3C defines several language bindings for the DOM. A language binding is simply an API defined to let you use the DOM for a specific language. For example, you can find well-defined DOM language bindings for C, Java, and JavaScript. So you can use the DOM from any of these languages. Language bindings are also available for several other languages, although many of these are not defined by the W3C, but instead by third parties.
In this chapter I'll focus on the JavaScript bindings into the DOM. That makes sense because most asynchronous application development is based on writing JavaScript code to run in a Web browser. With JavaScript and the DOM, you can modify the user interface on the fly, respond to user events and input, and more -- all using fairly standardized JavaScript.
All that said, I do encourage you to check out the DOM language bindings in other languages. For instance, you can use the Java language bindings to work not only with HTML, but also XML, as I'll discuss in a later chapter. So the lessons you'll learn here apply to far more than HTML, in many more environments than just client-side JavaScript.
The conceptual node
A node is the most basic object type in the DOM. In fact, as you'll see in this chapter, almost every other object defined by the DOM extends the node object. But, before you get too far into semantics, you need to understand the concept that is represented by a node; then, to learn the actual properties and methods of a node is a piece of cake.
In a DOM tree, almost everything you'll come across is a node. Every element is at its most basic level a node in the DOM tree. Every attribute is a node. Every piece of text is a node. Even comments, special characters (like ©, which represents a copyright symbol), and a DOCTYPE declaration (if you have one in your HTML or XHTML) all are nodes. So before I get into the specifics of each of these individual types, you really need to grasp what a node is.
A node is...
In simplest terms, a node is just one single thing in a DOM tree. The vagueness of "thing" is intentional, because that's about as specific as it gets. For example, it's probably not obvious that an element in your HTML, like img, and a piece of text in HTML, like "Scroll down for more details" have much in common. But that's because you're probably thinking about the function of those individual types, and focusing on how different they are.
Consider, instead, that each element and piece of text in a DOM tree has a parent; that parent is either the child of another element (like when an img is nested inside a p element), or is the top-most element in the DOM tree (which is a one-time special case for each document, and is where you use the html element). Also consider that both elements and text have a type. The type for an element is obviously an element; the type for text is text. Each node also has some fairly well-defined structure to it: does it have a node (or nodes) below it, such as child elements? Does it have sibling nodes (nodes "next to" the element or text)? What document does each node belong to?
Obviously, much of this sounds pretty abstract. In fact, it might even seem silly to say that the type of an element is ... well ... an element. However, you need to think a bit abstractly to realize the value of having the node as a common object type.
The common node type
The single task you'll perform more than any other in your DOM code is navigating within the DOM tree for a page. For instance, you might locate a form by its "id" attribute, and then begin to work with the elements and text nested within that form. There will be textual instructions, labels for input fields, actual input elements, and possibly other HTML elements like img elements and links (a elements). If elements and text are completely different types, then you have to write completely different pieces of code to move from one type to another.
Things are different if you use a common node type. In that case you can simply move from node to node, and worry about the type of the node only when you want to do something specific with an element or text. When you just move around in the DOM tree, you'll use the same operations to move to an element's parent -- or its children -- as you would with any other type of node. You only have to work specifically with a node type, like an element or text, when you require something specific from a certain type of node, like an element's attributes. Thinking about each object in the DOM tree simply as a node allows you to operate much more simply. With that in mind, I'll look next at exactly what the DOM Node construct has to offer, starting with properties and methods.
Section 5.3: Properties of a node
You'll want to use several properties and methods when you work with DOM nodes, so let's consider them first. The key properties of a DOM node are:
1. nodeName reports the name of the node (see more below).
2. nodeValue:gives the "value" of the node (see more below).
3. parentNode returns the node's parent. Remember, every element, attribute, and text has a parent node.
4. childNodes is a list of a node's children. When working with HTML, this list is only useful when you're dealing with an element; text nodes and attribute nodes don't have any children.
5. firstChild is just a shortcut to the first node in the childNodes list.
6. lastChild is another shortcut, this time to the last node in the childNodes list.
7. previousSibling returns the node before the current node. In other words, it returns the node that precedes the current one, in this node's parent's childNodes list (if that was confusing, re-read that last sentence).
8. nextSibling is similar to the previousSibling property; it turns the next node in the parent's childNodes list.
9. attributes is only useful on an element node; it returns a list of an element's attributes.
10. The few other properties really apply to more generic XML documents, and aren't of much use when you work with HTML-based Web pages.
For those of you who want to work with PHP, check this out: DOMDocument
Unusual propertiesMost of the above-defined properties are pretty self-explanatory, with the exception of the nodeName and nodeValue properties. Rather than simply explain these properties, consider a couple of odd questions:
What would the nodeName be for a text node?
And, similarly, what would the nodeValue be for an element?
If these questions stumped you, then you already understand the potential for confusion inherent in these properties. nodeName and nodeValue really don't apply to all node types (this is also true of a few of the other properties on a node). This illustrates a key concept: any of these properties can return a null value (which sometimes shows up in JavaScript as "undefined"). So, for example, the nodeName property for a text node is null (or "undefined" in some browsers, as text nodes don't have a name. nodeValue returns the text of the node, as you would probably expect.
Similarly, elements have a nodeName -- the name of the element -- but the value of an element's nodeValue property is always null. Attributes have values for both the nodeName and nodeValue properties. I'll talk about these individual types a bit more in the next section, but since these properties are part of every node, they're worth mentioning here.
Now take a look at Listing 1, which shows several of the node properties in action.
Listing 1. Using node properties in the DOM
// These first two lines get the DOM tree for the current Web page,
// and then the <html> element for that DOM tree
var myDocument = document;
var htmlElement = myDocument.documentElement;
// What's the name of the <html> element? "html"
alert("The root element of the page is " + htmlElement.nodeName);
// <head> element
var headElement = htmlElement.getElementsByTagName("head")[0];
if (headElement != null)
{
// the name of the <head> element: nodeName returns "head"
alert("We found the head element, named " + headElement.nodeName);
// Print out the title of the page
var titleElement = headElement.getElementsByTagName("title")[0];
if (titleElement != null)
{
// The text will be the first child node of the <title> element
var titleText = titleElement.firstChild;
// We can get the text of the text node with nodeValue
alert("The page title is '" + titleText.nodeValue + "'");
}
// After <head> is <body>
var bodyElement = headElement.nextSibling;
while (bodyElement.nodeName.toLowerCase() != "body")
{
bodyElement = bodyElement.nextSibling;
}
// We found the <body> element...
// We'll do more when we know some methods on the nodes.
}
|
Section 5.4: Methods of a node
Next up are the methods available to all nodes (as in the case of node properties, I've omitted a few methods that don't really apply to most HTML DOM operations):
1. insertBefore(newChild, referenceNode) inserts the newChild node before the referenceNode.
Keep in mind you would call this on the intended parent of newChild.
2. replaceChild(newChild, oldChild) replaces the oldChild node with the newChild node.
3. removeChild(oldChild) removes the oldChild node from the node the function is run on.
4. appendChild(newChild) adds the newChild node to the node this function is run on.
5. newChild is added at the end of the target node's children.
6. hasChildNodes() returns true if the node it's called on has children, and false if it doesn't.
7. hasAttributes() returns true if the node it's called on has attributes, and false if there are no attributes.
You'll notice that, for the most part, all of these methods deal with the children of a node. That's their primary purpose. If you're just trying to grab the value of a text node or the name of an element, you probably won't find yourself calling methods much, since you can simply use the properties of a node. Listing 2 builds on the code from Listing 1 using several of the above methods.
Listing 2. Using node methods in the DOM
// These first two lines get the DOM tree for the current Web page,
// and then the <html> element for that DOM tree
var myDocument = document;
var htmlElement = myDocument.documentElement;
// What's the name of the <html> element? "html"
alert("The root element of the page is " + htmlElement.nodeName);
// Look for the <head> element
let headElement = htmlElement.getElementsByTagName("head")[0];
if (headElement != null)
{
// the name of the <head> element: nodeName returns "head"
alert("We found the head element, named " + headElement.nodeName);
// Print out the title of the page
var titleElement = headElement.getElementsByTagName("title")[0];
if (titleElement != null)
{
// The text will be the first child node of the <title> element
var titleText = titleElement.firstChild;
// We can get the text of the text node with nodeValue
alert("The page title is '" + titleText.nodeValue + "'");
}
// After <head> is <body>
var bodyElement = headElement.nextSibling;
while (bodyElement.nodeName.toLowerCase() != "body")
{
bodyElement = bodyElement.nextSibling;
}
// We found the <body> element...
// Remove all the top-level <img> elements in the body
if (bodyElement.hasChildNodes())
{
for (i=0; i<bodyElement.childNodes.length; i++)
{
var currentNode = bodyElement.childNodes[i];
if (currentNode.nodeName.toLowerCase() == "img")
{
bodyElement.removeChild(currentNode);
}
}
}
}
|
So far, you've seen just two examples, in Listings 1 and 2, but they should give you all sorts of ideas for what's possible when you start manipulating the DOM tree. If you want to try out the code so far, just drop Listing 3 into an HTML file, save it, and load it into your Web browser.
Listing 3. An HTML file with some JavaScript code using the DOM
<html>
<head>
<title>JavaScript and the DOM</title>
<script language="JavaScript">
function test()
{
// These first two lines get the DOM tree for the current Web page,
// and then the rest of the <html> elements for that DOM tree
var myDocument = document;
var htmlElement = myDocument.documentElement;
// documentElement returns the <html> element of the document as
// a node name, for example, the following variable x contains: HTML
// var x = document.documentElement.nodeName;
// What's the name of the <html> element? "html"
alert("The root element of the page is " + htmlElement.nodeName);
// Look for the <head> element
var headElement = htmlElement.getElementsByTagName("head")[0];
if (headElement != null)
{
// the name of the <head> element: nodeName returns "head"
alert("We found the head element, named " + headElement.nodeName);
// Print out the title of the page
var titleElement = headElement.getElementsByTagName("title")[0];
if (titleElement != null)
{
// The text will be the first child node of the <title> element
var titleText = titleElement.firstChild;
// We can get the text of the text node with nodeValue
alert("The page title is '" + titleText.nodeValue + "'");
}
// After <head> is <body>
var bodyElement = headElement.nextSibling;
while (bodyElement.nodeName.toLowerCase() != "body")
{
bodyElement = bodyElement.nextSibling;
}
// We found the <body> element...
// Remove all the top-level <img> elements in the body
if (bodyElement.hasChildNodes())
{
for (i=0; i<bodyElement.childNodes.length; i++)
{
var currentNode = bodyElement.childNodes[i];
if (currentNode.nodeName.toLowerCase() == "img")
{
bodyElement.removeChild(currentNode);
}
}
}
}
}//end rest()
</script>
</head>
<body>
<p>JavaScript and DOM are a perfect match. </p>
<p>test() above removes all top-level <img> elements in the body!</p>
<img src="http://www.example.com/Image/any_image.jpg" />
<input type="button" value="Test me!" onClick="test();" />
</body>
</html>
|
Once you've loaded this page into your browser, you should see something, such as alert boxes showing the name of an element.
When the code (test()) is finished running the images are removed from the page in real-time.
Section 5.5: API design notes
Take a look again at the properties and methods available on each node. They illustrate a key point of the DOM for those comfortable with object-oriented (OO) programming: the DOM isn't a very object-oriented API. First, in many cases you'll use an object's properties directly, rather than calling a method on a node object. There's no getNodeName() method, for example; you just use the nodeName property directly. So node objects (as well as the other DOM objects) expose a lot of their data through properties, and not just functions.
Second, the naming of objects and methods in the DOM might seem a bit strange if you're used to working with overloaded objects and object-oriented APIs, especially in languages like Java or C++. The DOM has to work in C, Java, and JavaScript (to name a few languages), so some concessions were made in the design of the API. For instance, you'll see two different methods on the NamedNodeMap methods that look like this:
1. getNamedItem(String name)
2. getNamedItemNS(Node node)
For OO programmers, this looks pretty odd. Two methods, with the same purpose, but one takes a String and one takes a Node. In most OO APIs, you would use the same method name for both versions. The virtual machine running your code would figure out which method to run based on the type of object you passed into the method.
The problem is that JavaScript doesn't support this technique, called method overloading. In other words, JavaScript requires that you have a single method or function for a given name. So if you have a method called getNamedItem() that takes a string, then you can't have any other method or function named getNamedItem(), even if the second version takes a different type of argument (or even takes an entirely different set of arguments). JavaScript will report an error if you do, and your code won't behave as you think it should.
In essence, the DOM consciously avoids method overloading and other OO programming techniques. It does this to ensure that the API works across multiple languages, including those that don't support OO programming techniques. The end result is simply that you'll have to learn a few extra method names. The upside is that you can learn the DOM in any language -- for example, Java -- and know that the same method names and coding constructs will work in other languages that have a DOM implementation -- like JavaScript.
Let the programmer beware
If you're into API design at all -- or perhaps just are paying close attention -- you might wonder: "Why are properties on the node type that aren't common to all nodes?" That's a good question, and the answer is more about politics and decision-making than any technical reason. In short, the answer is, "Who knows! But it's a bit annoying, isn't it?"
The property nodeName is meant to allow every type to have a name; but in many cases, that name is either undefined or it's some strange, internal name that has no value to programmers (for example, in Java, the nodeName of a text node is reported as "#text" in a lot of cases). Essentially, you have to assume that error handling is left up to you. It's not safe to simply access myNode.nodeName and then use that value; in many cases, the value will be null. So, as is often the case when it comes to programming, let the programmer beware.
Common node types
Now that you've seen some of the features and properties of a DOM node (and some of its oddities as well), you're ready to learn about some of the specific types of nodes that you'll work with. In most Web applications, you'll only work with four types of nodes:
1. The document node represents an entire HTML document.
2. Element nodes represent HTML elements like a or img.
3. Attribute nodes represent the attributes on HTML elements, like href (on the a element) or src (on the img element).
Text nodes represent text in the HTML document, like "Click on the link below for a complete set list." This is the text that appears inside elements like p, a, or h2. When you deal with HTML, you'll work with these node types about 95% of the time. So I'll spend the remainder of this month's article discussing them in-depth. (When I discuss XML in a future article I'll introduce you to some other node types.)
Section 5.6: The document node
The first node type is one you'll use in almost every piece of DOM-based code you write: the document node. The document node is actually not an element in an HTML (or XML) page, but the page itself. So in an HTML Web page, the document node is the entire DOM tree. In JavaScript, you can access the document node by using the document keyword:
// These first two lines get the DOM tree for the current Web page,
// and then the element for that DOM tree
let myDocument = document;
let htmlElement = myDocument.documentElement;
The document keyword in JavaScript returns the DOM tree for the current Web page. From there, you can work with all the nodes in the tree.
You can also use the document object to create new nodes, using methods like these:
createElement(elementName) creates an element with the supplied name.
createTextNode(text) creates a new text node with the supplied text.
createAttribute(attributeName) creates a new attribute with the supplied name.
The key thing to note is that these methods create nodes, but do not attach them or insert them into any particular document. For this, you have to use one of the methods you've already seen, like insertBefore() or appendChild(). So you might use code like the following to create and then add a new element to a document:
var pElement = myDocument.createElement("p");
var text = myDocument.createTextNode("Here's some text in a p element.");
pElement.appendChild(text);
bodyElement.appendChild(pElement);
Now we can use the above code like this:
// assuming we have an html markup document like this:
<html>
<head></head>
<body id="mybody">
<div id="mydiv">
</div>
</body>
</html>
// The following two lines create the DOM tree document object for the above Web page
var myDocument = document;
var htmlElement = myDocument.documentElement; // returns <html> element as a node name
// Next, get the <head> element
var headElement = htmlElement.getElementsByTagName("head")[0];
// Next, get the <body> element
var bodyElement = headElement.nextSibling;
// Create a <p> element
var pElement = myDocument.createElement("p");
// To add text to the <p> element (pElement), we must create a text node first.
// This code creates a text node containing some text:
var text = myDocument.createTextNode("Here's some text in a p element.");
// Now that we got a text node containing some text, we can add that node
// to the <p> element (pElement)
pElement.appendChild(text);
// So now <p> element looks something like this in markup:
// <p>Here's some text in a p element.</p>
// Now all we have to do is to append the <p> element containing actual text to
// the body element
bodyElement.appendChild(pElement);
// after the above code is run we have an html markup document
// that looks something like this:
<html>
<head></head>
<body id="mybody">
<div id="mydiv">
</div>
<p>Here's some text in a p element.</p>
</body>
</html>
Notice that above, it appends the paragraph: <p>Here's some text in a p element.</p> to the end of the existing code: in this case, the <div></div> block. There are ways to append before or after certain node as well. For more, please check out tutorials on the Web as well as the rest of this chapter explaining a few text node methods. For example:
1. appendData(text) adds the text you supply to the end of the text node's existing text.
2. insertData(position, text) allows you to insert data in the middle of the text node. It inserts the text you supply at the position indicated.
3. replaceData(position, length, text) removes the characters starting from the position indicated, of the length indicated, and puts the text you supply to the method in the place of the removed text.
For now, let's continuing on our DOM tree description.
Once you've used the document element to get access to a Web page's DOM tree, you're ready to start working with elements, attributes, and text directly, beginning with element node next.
Element nodesAlthough you'll work with element nodes a lot, many of the operations you need to perform on elements involve the methods and properties common to all nodes, rather than methods and properties specific to just elements. Only two sets of methods are specific to elements:
1. Methods that relate to working with attributes:
2. getAttribute(name) returns the value of the attribute named name.
3. removeAttribute(name) removes the attribute named name.
4. setAttribute(name, value) creates an attribute named name, and sets its value to value.
5. getAttributeNode(name) returns the attribute node named name (attribute notes are covered below).
6. removeAttributeNode(node) removes the attribute node that matches the supplied node. Methods that relate to finding nested elements:
7. getElementsByTagName(elementName) returns a list of element nodes with the supplied name. These are all pretty self-explanatory, but check out some examples anyway.
Working with attributes
Working with attributes is fairly simple; for example, you might create a new img element with the document object, and element, and some of the methods from above:
let imgElement = document.createElement("img");
imgElement.setAttribute("src", "http://www.example.com/Image/any_image.jpg");
imgElement.setAttribute("width", "130");
imgElement.setAttribute("height", "150");
bodyElement.appendChild(imgElement);
This should look pretty routine by now. In fact, you should start to see that once you understand the concept of a node and know the methods available, working with the DOM in your Web pages and JavaScript code is simple. In the code above, the JavaScript creates a new img element, sets up some attributes, and then adds it to the body of the HTML page.
Finding nested elements
It's also easy to find nested elements. For example, here's the code I used to find and remove all the img elements in the HTML page from Listing 3:
// Remove all the top-level <img> elements in the body
if (bodyElement.hasChildNodes())
{
for (i=0; i < bodyElement.childNodes.length; i++)
{
var currentNode = bodyElement.childNodes[i];
if (currentNode.nodeName.toLowerCase() == "img")
{
bodyElement.removeChild(currentNode);
}
}
}
|
You could achieve a similar effect using getElementsByTagName():
// Remove all the top-level <img> elements in the body
var imgElements = bodyElement.getElementsByTagName("img");
for (i=0; i < imgElements.length; i++)
{
var imgElement = imgElements.item[i];
bodyElement.removeChild(imgElement);
}
|
Attribute nodes
The DOM represents attributes as nodes, and you can always get an element's attributes using the attributes property of an element, as shown here:
// Remove all the top-level <img> elements in the body
var imgElements = bodyElement.getElementsByTagName("img");
for (i=0; i < imgElements.length; i++)
{
var imgElement = imgElements.item[i];
// Print out some information about this element
var msg = "Found an img element!";
var atts = imgElement.attributes;
for (j=0; j < atts.length; j++)
{
var att = atts.item(j);
msg = msg + "\n " + att.nodeName + ": '" + att.nodeValue + "'";
}
alert(msg);
bodyElement.removeChild(imgElement);
}
|
The strange case of attributesAttributes are a bit of a special case when it comes to the DOM. On the one hand, attributes really aren't children of elements like other elements or text are; in other words, they don't appear "underneath" an element. At the same time, they obviously have a relationship to an element; an element "owns" its attributes. The DOM uses nodes to represent attributes, and makes them available on an element through a special list. So attributes are part of the DOM tree, but they often don't appear on the tree. Suffice it to say that the relationship of attributes to the rest of a DOM tree's structure is a little fuzzy.
It's worth noting that the attributes property is actually on the node type, and not specifically on the element type. A little odd, and it won't affect your coding, but it is worth knowing.
While it's certainly possible to work with attribute nodes, it's often easier to use the methods available on the element class to work with attributes. The methods are as follows:
1. getAttribute(name) returns the value of the attribute named name.
2. removeAttribute(name) removes the attribute named name.
3. setAttribute(name, value) creates an attribute named name and sets its value to value.
These three methods don't require you to work directly with attribute nodes. Instead, you can just set and remove attributes and their values with simple string properties.
Text nodes
The last type of node you need to worry about -- at least in working with HTML DOM trees -- is the text node. Almost all of the properties you'll commonly use to work with text nodes are actually available on the node object. In fact, you'll generally use the nodeValue property to get the text from a text node, as shown here:
let pElements = bodyElement.getElementsByTagName("p");
for (i=0; i < pElements.length; i++)
{
var pElement = pElements.item(i);
var text = pElement.firstChild.nodeValue;
alert(text);
}
|
A few other methods are specific to text nodes. These deal with adding to or splitting the data in a node:
1. appendData(text) adds the text you supply to the end of the text node's existing text.
2. insertData(position, text) allows you to insert data in the middle of the text node. It inserts the text you supply at the position indicated.
3. replaceData(position, length, text) removes the characters starting from the position indicated, of the length indicated, and puts the text you supply to the method in the place of the removed text.
Section 5.7: What type of node?
Most of what you've seen so far assumes you already know what type of node you're working with, which isn't always the case. For example, if you're navigating through a DOM tree, and working with the common node types, you might not know whether you've moved to an element or text. You might get all the children of a p element, and be unsure whether you're working with text, or a b element, or perhaps an img element. In these cases, you'll need to figure out what type of node you have before you can do much with it.
Fortunately, it's pretty simple to figure this out. The DOM node type defines several constants, like this:
1. Node.ELEMENT_NODE is the constant for the element node type.
2. Node.ATTRIBUTE_NODE is the constant for the attribute node type.
3. Node.TEXT_NODE is the constant for the text node type.
4. Node.DOCUMENT_NODE is the constant for the document node type.
There are a number of other node types, but you'll rarely deal with any but these four when processing HTML. I've also intentionally left out the value for each of these constants, even though the values are defined in the DOM specification; you should never deal directly with the value, since that's what the constants are for!
The nodeType property
You can also use the nodeType property -- which is defined on the DOM node type, so is available to all nodes -- to compare a node to the above constants, as shown here:
let someNode = document.documentElement.firstChild;
if (someNode.nodeType == Node.ELEMENT_NODE)
{
alert("We've found an element node named " + someNode.nodeName);
}
else if (someNode.nodeType == Node.TEXT_NODE)
{
alert("It's a text node; the text is " + someNode.nodeValue);
}
else if (someNode.nodeType == Node.ATTRIBUTE_NODE)
{
alert("It's an attribute named " + someNode.nodeName
+ " with a value of '" + someNode.nodeValue + "'");
}
|
This is a pretty simple example, but that's largely the point: getting the type of a node is simple. What's trickier is figuring out what to do with the node once you know what type it is; but with a firm knowledge of what the node, text, attribute, and elements types offer, you're ready to take on DOM programming yourself.
Well, almost.
A wrench in the works
It sounds like the nodeType property is just the ticket to working with nodes -- it allows you to figure out what type of node you're working with, and then write the code to deal with that node. The problem is that the above-defined Node constants don't work properly on Internet Explorer. So, if you use Node.ELEMENT_NODE, Node.TEXT_NODE, or any of the other constants in your code, Internet Explorer will return an error.
Internet Explorer will report this error anytime you use the Node constants in your JavaScript. Because most of the world still uses Internet Explorer, you'd do well to avoid constructs like Node.ELEMENT_NODE or Node.TEXT_NODE in your code. Even though Internet Explorer 7.0 -- the upcoming version of Internet Explorer -- is supposed to rectify this problem, it will be a number of years before Internet Explorer 6.x falls out of heavy use. So avoid using Node; it's important that your DOM code (and your Ajax apps) work on all the major browsers.
That was pertain to Internet Explorer 6 only and later Internet Explorer versions have been ported to work with the said problem. That was for educational purpose only!
Section 5.8: Conclusion.Are you ready for the top?
If you really work to understand and eventually master the DOM, you'll be at the very top of the Web programming skill level. Most Web programmers know how to use JavaScript to write image rollovers or grab values from a form, and some even are comfortable making requests and receiving responses from a server (as you certainly should be after the first few chapters in this book). But actually changing the structure of a Web page on the fly is not for the faint of heart or the inexperienced. You've learned quite a bit in the last few chapters in this series.
At this point, you should explore how you can create fancy effects or slick interfaces using the DOM is your own app project/homework now. Take what you've learned in these last two chapters and start to experiment and play around. See if you can create a Web site that feels a bit more like a desktop application, where objects move around on the screen in response to a user's action. Make it a user-friendly website.
Better yet, throw a border around every object on the screen, so you can see where the objects in the DOM tree are, and start moving things around. Create nodes and append them to existing child lists; remove nodes that have lots of nested nodes; change the CSS style of a node, and see if those changes are inherited by child nodes. The possibilities are limitless, and every time you try something new, you'll learn something new. Enjoy playing around with your Web pages.
Then, in the upcoming final part of this DOM-specific trilogy, I will show you how to incorporate some cool and interesting applications of the DOM into your programming. I'll stop speaking conceptually and explaining the API, and show you some code. Until then, you should come up with some clever ideas on your own, and see what you can make happen all by yourself.
Chapter 6
- Section 6.1 - Introduction
- Section 6.2 - Getting started with the sample application
- Section 6.3 - Getting the parent of the original image
- Section 6.4 - Connecting the JavaScript
- Section 6.5 - Changing the image, the (really) easy way
- Section 6.6 - Hiding that rabbit
- Section 6.7 - Dealing with event handlers
- Section 6.8 - Conclusion
Section 6.1: Introduction
Combine the Document Object Model (DOM) with JavaScript code to create interactive Ajax applications. In previous chapters in this book, you examined the concepts involved in DOM programming -- how the Web browser view a Web page as a tree -- and you should now understand the programming structures used in the DOM. In this chapter, you put all of this knowledge into practice and build a simple Web page that has some nice effects, all created using JavaScript to manipulate the DOM, without ever reloading or refreshing the page.
You've had two full chapters of introduction to the Document Object Model, or DOM; you should be pretty comfortable with how the DOM works by now. In this chapter, you'll put that understanding into practice. You'll develop a basic Web application with a user interface that changes based on user actions -- of course, you'll use the DOM to handle changing that interface. By the time you're finished with this chapter, you'll have put most of the techniques and concepts you've learned about the DOM into practice.
I assume that you've followed along for the last two chapters; if you haven't, review them to get a solid understanding of the DOM and of how Web browsers turn the HTML and CSS you supply them into a single tree structure that represents a Web page. All of the DOM principles that I've talked about so far will be used in this chapter to build a working -- albeit somewhat simple -- DOM-based dynamic Web page. If at any point in this chapter you get stuck, you can simply stop and review the earlier two chapters, and come back.
Section 6.2: Getting started with the sample application
A note on the code
To keep the focus specifically on the DOM and JavaScript code, I've been somewhat sloppy and have written HTML with inline style (like the align attribute on the h1 and p elements, for example). While this is acceptable for trying things out, I recommend that you take the time to put all your styles into external CSS stylesheets for any production applications you develop.
Let's start out by putting together a very basic application, and then adding a little DOM magic. In keeping with the idea that the DOM can move things around on a Web page without submitting a form -- thus making it a perfect companion for Ajax -- let's build a simple page that shows nothing but a plain old top hat, and a button labeled Hocus Pocus! (Can you guess where this will go?)
The initial HTML
Listing 1 shows the HTML for this page; it's just a body with a heading and a form, along with a simple image and a button that you can push.
Listing 1. The HTML for the sample application
<html>
<head>
<title>Magic Hat</title>
</head>
<body>
<h1 align="center">Welcome to the DOM Magic Show!</h1>
<form name="magic-hat">
<p align="center">
<img src="topHat.gif" />
<br />
|
Viewing the sample Web page
As you may have guess, the code above displays a heading text: "Welcome to the DOM Magic Show!" along with an image of a hat (if you supplied it) and a button: "Hocus Pocus!". Nothing particularly tricky here; open up the page and you should see something rather boring-looking top hat on your webpage.
A final point about the HTML
One important point that you should note, though, is that the button ("Hocus Pocus!") on the form in Listing 1 is of type button, and is not a submit button. If you do use a submit button, pressing the button will cause the browser to try and submit the form; of course, the form has no action attribute (which is entirely intentional), so this would just create an infinite loop of no activity. (You should try this on your own to see what happens.) By using a normal input button -- and avoiding the submit button -- you can connect a JavaScript function to the button and interact with the browser without submitting the form.
Adding more to the sample application
Now, spruce up the Web page with some JavaScript, DOM manipulatin, and a little image wizardry.
Using the getElementById() function
Obviously, a magic hat isn't worth much without a rabbit. In this case, begin by replacing the image in the existing page with an image of a rabbit (if you have one) or any image, for that matter.
The first step in making this bit of DOM trickery occur involves looking up the DOM node that represents the img element in the Web page. Generally, the easiest way to do this is to use the getElementById() method, available on the document object that represents the Web page. You've seen this method before; it functions like this:
let elementNode = document.getElementById("id-of-element");
Adding an id attribute to the HTML
This is pretty basic JavaScript, but it requires a bit of work in your HTML: the addition of an id attribute to the element that you want to access. That's the img element you want to replace (with a new image containing the rabbit); so you need to change our HTML to look like Listing 2.
Listing 2. Adding an id attribute
<html>
<head>
<title>Magic Hat</title>
</head>
<body>
<h1 align="center">Welcome to the DOM Magic Show!</h1>
<form name="magic-hat">
<p align="center">
<img src="topHat.gif" id="topHat" />
<br />
|
If you reload (or reopen) the page, you'll see nothing different at all; the addition of an id attribute has no visual effect on a Web page. It does, however, make it possible to work with an element more easily using JavaScript and the DOM.
Grabbing the img element
Now you can use getElementById() easily. You have the ID of the element you want -- topHat -- and can store that in a new JavaScript variable. Add in the code shown in Listing 3 to your HTML page.
Listing 3. Getting access to the img element
<html>
<head>
<title>Magic Hat</title>
<script language="JavaScript">
function showRabbit()
{
var hatImage = document.getElementById("topHat");
}
</script>
</head>
<body>
<h1 align="center">Welcome to the DOM Magic Show!</h1>
<form name="magic-hat">
<p align="center">
<img src="topHat.gif" id="topHat" />
<br />
|
Again, loading or reloading the Web page at this point won't show anything exciting. Even though you now have access to the image, you haven't done anything with it.
Changing the image, the hard way
You can make the change you want in two ways: the hard way and the easy way. Like all good programmers, I typically prefer the easy way; however, walking through the longer path is a great DOM exercise, and well worth your time. Look at how to change out the image the hard way first; later, you'll re-examine things to see how to make the same change in an easier way.
Here's what you need to do to replace the existing image with the newer, rabbit-inclusive image:
1. Create a new img element.
2. Get access to the element that is the parent -- that is, the container -- of the current img element.
3. Insert the new img element as a child of the container just before the existing img element.
4. Remove the old img element.
5. Set things up so that the JavaScript function you've created is called when a user clicks the Hocus Pocus! button.
Creating a new img element
You should remember from my last two chapters that the key to almost everything in the DOM is the document object. It represents an entire Web page, allows you access to powerful methods like getElementById(), and also allows you to create new nodes. It's this last property you want to use now.
Specifically, you need to create a new img element. Remember, in the DOM, everything is a node, but nodes are broken up further into three basic groups:
1. Elements: An example of an "element" is marked with a red color: <DIV>Rabbit in the hat!</DIV>
2. Attributes: An example of an "attribute" is marked with a red color: <DIV id="tophat">Rabbit in the hat!</DIV>
3. Text nodes: An example of a "text node" is marked with a red color: <DIV>Rabbit in the hat!</DIV>
There are other groups, but these three will serve you for about 99 percent of your programming needs. In this case,you want a new element, of type img. So you need this code in your JavaScript:
let newImage = document.createElement("img");
This will create a new node, of type element, with the element name img. In HTML, that's essentially this:
<img />
Remember, the DOM will create well-formed HTML, meaning that the element is currently empty, with both a starting and ending tag. So examples of a well-formed HTML would be like the following:
<img />
<DIV><DIV />
<P><P />
<H1><H1 />
<Title><Title />
Notice that <img /> tag need not have a closing tag--you knew that.
Now all that's left is to add content or attributes to this element, and then insert it into the Web page.
As for content, the img element is an empty element. However, you do need to add an attribute: the src attribute, which specifies the image to load. You might think that you need to use a method like addAttribute() here, but you would be incorrect. The DOM specification creators figured that as programmers, we might like a little shortcut (and we do!), so they created a single method to both add new attributes and change the value of existing ones: setAttribute().
If you call setAttribute() and supply an existing attribute, its value is changed to the value you supply. However, if you call setAttribute() and supply an attribute that does not exist, the DOM quietly adds the attribute, using the value you provide. One method, two purposes! Make sure to be careful not to supply the existing attribute if you still want that attribute to stay the way it is. With that said, you need to add the following to your JavaScript:
let newImage = document.createElement("img");
newImage.setAttribute("src", "rabbit-hat.gif");
This creates the image, and sets its source up appropriately. At this point, your HTML should look like Listing 4.
Listing 4. Creating a new image using the DOM
<html>
<head>
<title>Magic Hat</title>
<script language="JavaScript">
function showRabbit()
{
let hatImage = document.getElementById("topHat");
let newImage = document.createElement("img");
newImage.setAttribute("src", "rabbit-hat.gif");
}
</script>
</head>
<body>
<h1 align="center">Welcome to the DOM Magic Show!</h1>
<form name="magic-hat">
<p align="center">
<img src="topHat.gif" id="topHat" />
<br />
|
You can load this page, but don't expect any action; you haven't really done anything that affects the actual Web page yet. Plus, if you look back up at step 5 in the list of things to do, you might notice that your JavaScript function isn't even getting called yet!
Section 6.3: Getting the parent of the original image
Now that you have an image ready to insert, you need somewhere to insert it. However, you're not inserting it into the existing image; instead, you want to put it before the existing image, and then remove the existing image. To do that, you need the parent of the existing image, which is really the key to all this inserting and removing.
You should recall from the earlier chapters that the DOM really sees a Web page as a tree, a hierarchy of nodes. Every node has a parent (a node higher up the tree that it is a child of), and possibly some children of its own. In the case of this image, there are no children -- remember, images are empty elements -- but there is certainly a parent. You don't even care what the parent is; you just need to access it.
To do that, you can just use the parentNode property that every DOM node has, like this:
let imgParent = hatImage.parentNode;
It's really that simple! You know that the parent can have children, because it already has one: the old image. Beyond that, you really don't need to know if the parent is a div, or a p, or even the body of the page; it just doesn't matter!
Inserting the new image
Now that you have the parent of the old image, you can insert the new image. That's fairly easy, as you can use several methods to add a child:
1. insertBefore(newNode, oldNode)
2. appendChild(newNode)
Since you want the new image to appear exactly where the old image is, you need insertBefore() (and you'll also need to use the removeChild() method as well). Here's the line of JavaScript you'll use to insert the new image element just before the existing image:
let imgParent = hatImage.parentNode;
imgParent.insertBefore(newImage, hatImage);
At this point, the parent of the old image has two child images: the new image, immediately followed by the old image. It's important to note here that the content around these images is unchanged, and that the order of that content is exactly the same as it was before the insertion. It's just that the parent now has one additional child -- the new image -- directly before the old image.
Removing the old image
Now all that you need to do is remove the old image; you only want the new image in the Web page. This is simple, as you already have the old image element's parent. You can just call removeChild() and pass in the node you want to remove, like this:
let imgParent = hatImage.parentNode;
imgParent.insertBefore(newImage, hatImage);
imgParent.removeChild(hatImage);
At this point, you essentially replaced the old image with the new one. Your HTML should look like Listing 5.
Listing 5. Replacing the old image with the new
<html>
<head>
<title>Magic Hat</title>
<script language="JavaScript">
function showRabbit()
{
let hatImage = document.getElementById("topHat");
let newImage = document.createElement("img");
newImage.setAttribute("src", "rabbit-hat.gif");
let imgParent = hatImage.parentNode;
imgParent.insertBefore(newImage, hatImage);
imgParent.removeChild(hatImage);
}
</script>
</head>
<body>
<h1 align="center">Welcome to the DOM Magic Show!</h1>
<form name="magic-hat">
<p align="center">
<img src="topHat.gif" id="topHat" />
<br />
|
Section 6.4: Connecting the JavaScript
The last step -- and perhaps the easiest -- is to connect your HTML form to the JavaScript function you just wrote. You want the showRabbit() function to run every time a user clicks the Hocus Pocus! button. To accomplish this, just add a simple onClick event handler to your HTML:
<input type="button" value="Hocus Pocus!" onClick="showRabbit();" />
At this point in your JavaScript programming, this should be pretty routine. Add this into your HTML page, save the page, and then load the page into your Web browser and click Hocus Pocus! button, and see the result that is more appealing: the rabbit has come out to play--the rabbit pops out of the hat (if you supplied the images).
Changing the image, the slightly easier way
If you look back over the steps you took to change out the image, and then review the various methods available on nodes, you might notice a method called replaceNode(). This allows you to replace one node with another. Consider again the steps you took:
1. Create a new img element.
2. Get access to the element that is the parent -- that is, the container -- of the current img element.
3. Insert the new img element as a child of the container just before the existing img element.
4. Remove the old img element.
5. Set things up so that the JavaScript function you've created is called when a user clicks Hocus Pocus!.
With replaceNode(), you can now reduce the number of steps you need to take. You can combine steps 3 and 4 so the process looks like this:
1. Create a new img element.
2. Get access to the element that is the parent -- that is, the container -- of the current img element.
3. Replace the old img element with the new one you just created.
4. Set things up so that the JavaScript function you created is called when a user clicks Hocus Pocus!.
This may not seem like a huge deal, but it certainly simplifies your code. Listing 6 shows how you can make this change: by removing the insertBefore() and removeChild() method calls.
Listing 6. Replacing the old image with the new (in one step)
<html>
<head>
<title>Magic Hat</title>
<script language="JavaScript">
function showRabbit()
{
let hatImage = document.getElementById("topHat");
let newImage = document.createElement("img");
newImage.setAttribute("src", "rabbit-hat.gif");
let imgParent = hatImage.parentNode;
imgParent.replaceChild(newImage, hatImage);
}
</script>
</head>
<body>
<h1 align="center">Welcome to the DOM Magic Show!
<form name="magic-hat">
<p align="center">
<img src="topHat.gif" id="topHat" />
<br />
|
Again, this isn't a big change, but it does illustrate a rather important point in DOM coding: you can usually find a few ways to perform any given task. Many times, you can cut what takes four or five steps down to two or three if you carefully review the DOM methods available to you, and see if there are perhaps shorter ways to accomplish a task.
Section 6.5: Changing the image, the (really) easy way
Since I've pointed out that there is almost always an easier way to perform a task, I'll now show you that there's a much easier way to replace the top hat image with the rabbit image. Did you figure out what that approach is as you worked through this chapter? Here's a hint: it has to do with attributes.
Remember, the image element is largely controlled by its src attribute, which refers to a file somewhere (either a local URI or an external URL). So far, you've replaced the image node with a new image; however, it's much simpler to just change the src attribute of the existing image! This consolidates all the work of creating a new node, finding the parent, and replacing the old node into a single step:
hatImage.setAttribute("src", "rabbit-hat.gif");
That's all it takes! Look at Listing 7, which shows this solution in the context of an entire Web page.
Listing 7. Changing the src attribute
<html>
<head>
<title>Magic Hat</title>
<script language="JavaScript">
function showRabbit()
{
let hatImage = document.getElementById("topHat");
hatImage.setAttribute("src", "rabbit-hat.gif");
}
</script>
</head>
<body>
<h1 align="center">Welcome to the DOM Magic Show!</h1>
<form name="magic-hat">
<p align="center">
<img src="topHat.gif" id="topHat" />
<br />
|
This is one of the coolest thing about the DOM: when you update an attribute, the Web page immediately changes. As soon as the image points to a new file, the browser loads that file, and the page is updated. No reloading is necessary, and you don't even need to create a new image element! The result is still identical to the previous examples, shown earlier -- it's just that the code is far simpler.
Section 6.6: Hiding that rabbit
Currently, the Web page is pretty nifty, but still a bit primitive. Even though the rabbit pops out of the hat, the button on the bottom of the screen still reads Hocus Pocus! once he's out, and still calls showRabbit(). This means that if you click on the button after the rabbit is revealed, you waste processing time. More importantly, it's just plain useless, and useless buttons are never a good thing. Let's see if you can use the DOM to make a few more changes, and make that button useful whether the rabbit is in the hat or out of it.
Changing the button's label
The easiest thing to do is to change the label of the button after a user clicks it. That way, it doesn't seem to indicate that anything else magical will occur; the worst thing a Web page can do is imply something to the user that's not correct. Before you can change the button's label, though, you need to get access to the node; and before you can do that, you need an ID to reference the button by. This should be old hat by now, right? Listing 8 adds an id attribute to the button.
Listing 8. Adding an id attribute
<html>
<head>
<title>Magic Hat</title>
<script language="JavaScript">
function showRabbit()
{
let hatImage = document.getElementById("topHat");
hatImage.setAttribute("src", "rabbit-hat.gif");
}
</script>
</head>
<body>
<h1 align="center">Welcome to the DOM Magic Show!
<form name="magic-hat">
<p align="center">
<img src="topHat.gif" id="topHat" />
<br />
|
Now it's trivial to access the button in your JavaScript:
function showRabbit()
{
let hatImage = document.getElementById("topHat");
hatImage.setAttribute("src", "rabbit-hat.gif");
let button = document.getElementById("hocusPocus");
}
|
Of course, you probably already typed in the next line of JavaScript, to change the value of the button's label. Again, setAttribute() comes into play:
function showRabbit()
{
let hatImage = document.getElementById("topHat");
hatImage.setAttribute("src", "rabbit-hat.gif");
let button = document.getElementById("hocusPocus");
button.setAttribute("value", "Get back in that hat!");
}
|
With this simple bit of DOM manipulation, the button's label will change as soon as the rabbit pops out. At this point, your HTML and completed showRabbit() function should look like Listing 9.
Listing 9. The completed (for now) Web page
<html>
<head>
<title>Magic Hat</title>
<script language="JavaScript">
function showRabbit()
{
let hatImage = document.getElementById("topHat");
hatImage.setAttribute("src", "rabbit-hat.gif");
let button = document.getElementById("hocusPocus");
button.setAttribute("value", "Get back in that hat!");
}
</script>
</head>
<body>
<h1 align="center">Welcome to the DOM Magic Show!</h1>
<form name="magic-hat">
<p align="center">
<img src="topHat.gif" id="topHat" />
<br />
|
Putting the rabbit back
As you might guess from the new button label, it's time to get the rabbit back into the hat. This essentially just reverses the process by which you got him out: changing the image's src attribute back to the old image. Create a new JavaScript function to do this:
function hideRabbit()
{
let hatImage = document.getElementById("topHat");
hatImage.setAttribute("src", "topHat.gif");
let button = document.getElementById("hocusPocus");
button.setAttribute("value", "Hocus Pocus!");
}
|
This is really just a matter of reversing everything that the showRabbit() function does. Set the image to the old, rabbit-free top hat, grab the button, and change its label back to Hocus Pocus!
Section 6.7: Dealing with event handlers
The sample application at this point has one big problem: even though the label of the button changes, the action that occurs when you click that button does not.
Fortunately, you can change the event -- the action that occurs -- when a user clicks the button using the DOM. So if the button reads 'Get back in that hat!, you want it to run hideRabbit() when it's clicked. Conversely, once the rabbit is hidden, the button returns to running showRabbit().
In addition to the onclick property, there's a method intended to be used to add an event handler, like onClick or onBlur; it's unsurprisingly called addEventListener(). Unfortunately, Microsoft Internet Explorer 8 and earlier don't support this method; however, Internet Explorer 9 and onward will properly support this method. So if you use it in your JavaScript, millions of Internet Explorer 8.0 or earlier, users are going to get nothing from your page other than an error (and probably some ideas about complaints).
You can get the same results using Javascript event property called onclick, which does work on all versions of Internet Explorer.
If you look at the HTML, you'll see that the event you deal with here is onClick. In JavaScript, you can reference this event using the onclick property of a button. (Note that in HTML, the property is generally referred to as onClick, with a capital C, and in JavaScript, it's onclick, all lowercase.) So you can change the event that's run on a button: you just assign a new function to the onclick property.But there's a slight twist: the onclick property wants to be fed a function reference -- not the string name of a function, but a reference to the function itself. In JavaScript, you can reference a function by its name, without any parentheses. So you might change the function that runs when a button is clicked like this:
button.onclick = myFunction;
In your HTML, then, making this change is pretty simple. Check out Listing 10, which toggles the functions that the button runs.
Listing 10. Changing the button's onClick function
<html>
<head>
<title>Magic Hat</title>
<script language="JavaScript">
function showRabbit()
{
let hatImage = document.getElementById("topHat");
hatImage.setAttribute("src", "rabbit-hat.gif");
let button = document.getElementById("hocusPocus");
button.setAttribute("value", "Get back in that hat!");
button.onclick = hideRabbit;
}
function hideRabbit()
{
let hatImage = document.getElementById("topHat");
hatImage.setAttribute("src", "topHat.gif");
let button = document.getElementById("hocusPocus");
button.setAttribute("value", "Hocus Pocus!");
button.onclick = showRabbit;
}
</script>
</head>
<body>
<h1 align="center">Welcome to the DOM Magic Show!</h1>
<form name="magic-hat">
<p align="center">
<img src="topHat.gif" id="topHat" />
<br />
|
This is a complete, ready-to-use DOM application. Try it out and see for yourself!
Now let's briefly touch on the issue of Internet Explorer version 8.0 and earlier not supporting addEventListener() while Internet Explorer version 9.0 or later will support this addEventListener() method just fine.
Let's illustrate the same code above using addEventListener() method on Internet Explorer version 9.0 or later.
Listing 10(a). Using addEventListener() method on Internet Explorer version 9.0 or later
<html>
<head>
<title>Magic Hat</title>
<script language="JavaScript">
function showRabbit()
{
let hatImage = document.getElementById("topHat");
hatImage.setAttribute("src", "rabbit-hat.gif");
let button = document.getElementById("hocusPocus");
button.setAttribute("value", "Get back in that hat!");
// hideRabbit() is a listener for click events registered using
// addEventListener(). "click" is the event name
// A click on the "Hocus Pocus!" button bubbles up to the handler
// and runs hideRabbit()
button.addEventListener("click", hideRabbit);
}
function hideRabbit()
{
let hatImage = document.getElementById("topHat");
hatImage.setAttribute("src", "topHat.gif");
let button = document.getElementById("hocusPocus");
button.setAttribute("value", "Hocus Pocus!");
// showRabbit() is a listener for click events registered using
// addEventListener(). "click" is the event name
// A click on the "Hocus Pocus!" button bubbles up to the handler
// and runs showRabbit()
button.addEventListener("click", showRabbit);
}
</script>
</head>
<body>
<h1 align="center">Welcome to the DOM Magic Show!</h1>
<form name="magic-hat">
<p align="center">
<img src="topHat.gif" id="topHat" />
<br />
|
Hopefully, you can use both the examples using JavaScript property called onclick and as well as using JavaScript method addEventListener() in your Javascript code because nowaday no one in the right mind would still be using Internet Explorer 8.0 or lower. So it's safe to assume that everybody are using and will still continue to use Internet Explorer version 9.0 or later.
Section 6.8: Conclusion.At this point, you should be pretty comfortable with the DOM. In previous chapters, you saw the basic concepts involved in working with the DOM, and got a detailed look at the API; now you've worked through a simple DOM-based application. Be sure to take your time with this chapter, and try it out online for yourself.
Although this is the last of the chapters specifically focusing on the Document Object Model, it's not the last you'll see of the DOM. In fact, you'll be hard-pressed to do much in the Ajax and JavaScript worlds without using the DOM to at least some degree. Whether you create complex highlighting and movement effects, or just work with text blocks or images, the DOM gives you access to a Web page in a really easy-to-use manner.
If you still feel a little unsure of how to use the DOM on your own, take some time to revisit this set of three chapters; the rest of this book will use the DOM without much explanation, and you don't want to get lost in those details and miss out on important information about other concepts, such as XML or JSON. Be sure you're comfortable using the DOM, write a few DOM-based applications on your own, and you'll be ready to tackle some of the data format issues I'll be discussing over the next several chapters.
Chapter 7
- Section 7.1 - Introduction
- Section 7.2 - Using XML (for real)
- Section 7.3 - Converting name/value pairs to XML
- Section 7.4 - Sending XML to the server
- Section 7.5 - XML is not simple to construct
- Section 7.6 - Conclusion
Section 7.1: Introduction
First of all, XML is an acronym for Extensible Markup Language (or XHTML)--an extension of the Hypertext Markup Language (or HTML).
You really can't do any significant programming today without running across XML. Whether you're a Web page designer considering the move to XHTML, a Web programmer working with JavaScript, a server-side programmer using deployment descriptors and data binding, or a back-end developer investigating XML-based databases, the extensible markup language is everywhere. It's no surprise, then, that XML is considered one of the core technologies that underlies Ajax.However, this opinion reflects the poor choice of names for the core object used in Ajax applications -- XMLHttpRequest -- more than it does technical reality. In other words, most people think XML is a core part of Ajax because they assume that the XMLHttpRequest object actually uses XML all the time. But that's not the case, and the reasons why are the subject of the first part of this chapter. In fact, you'll see that in most Ajax applications, XML rarely makes an appearance at all.
XML does have real uses in Ajax, and XMLHttpRequest allows for these as well. There's certainly nothing keeping you from sending XML to a server. In earlier chapters, you used plain text and name/value parameters to send data, but XML is also a viable format. In this chapter, you'll look at how to do that. More importantly, though, I'll talk about why you might use XML for your request format, and why, in many cases, you shouldn't use it.
XML: Is it really there at all?
It's easy to make assumptions about Ajax applications and their usage of XML; both the technology name (Ajax) and the core object it uses (XMLHttpRequest) imply the use of XML, and you'll hear XML linked with Ajax applications all the time. However, this perception is simply wrong, and if you want to really know your stuff when it comes to writing asynchronous applications, you need to know that the perception is wrong -- and, better yet, know why it's wrong.
XMLHttpRequest: Poor names and HTTP
One of the worst things that can happen to a technology is for it to become so hot that changing basic pieces of it becomes impossible. That's exactly what's happened with XMLHttpRequest, the basic object used in Ajax apps. It sounds like it's designed to either send XML over HTTP requests, or perhaps make HTTP requests in some sort of XML format. Whatever the object's name sounds like, though, what it actually does is simply provide a way for your client code (usually JavaScript in your Web page) to send an HTTP request. That's it; there's really nothing more to it.
Thus, it would be nice to simply change XMLHttpRequest's name to something more accurate, like HttpRequest, or perhaps simply Request. However, millions of developers are now throwing Ajax into their applications, and because we all know that it takes years -- if not decades -- for the majority of users to move to new browser versions like Internet Explorer 7.0 or Firefox 1.5, such a move is simply not feasible. The end result is that you're stuck with XMLHttpRequest, and it's up to developers to realize that the thing is just poorly named.
It's somewhat telling that one of the best known fallback methods for dealing with a browser (especially on Windows) that doesn't support XMLHttpRequest is to use the Microsoft IFRAME object. Hardly sounds like XML, HTTP, or even a request, does it? Obviously, all those things might be involved, but this should simply make clear the fact that the XMLHttpRequest object is a lot more about making requests without requiring a page reload than it is about XML, or even HTTP.
The requests are HTTP, not XML
Another common mistake is to suppose that XML is somehow used behind the scenes -- a view I once held myself, to be honest! However, that view reflects a poor understanding of the technology. When a user opens a browser and requests a Web page from a server, they type in something like http://www.google.com or whatever the site you're visiting is. Even if they don't include the http://, the browser will fill in that part in the browser address bar. That first part -- http:// -- is a not-so-subtle clue about how communication is occurring: through HTTP, the Hypertext Transfer Protocol. When you write code in your Web page to communicate with a server, whether it's using Ajax or a normal form POST or even a hyperlink, you're just talking HTTP.
HTTPS: Still HTTP
Those of you newer to the Web might wonder about URLs like https://intranet.nextel.com. The https is secure HTTP, and just uses a more secure form of the HTTP protocol used by ordinary Web requests. So even with HTTPS, you're still just talking HTTP, albeit with some extra layers of security added to keep away prying eyes. Given that pretty much all Web communication between browsers and servers takes place through HTTP, the idea that XML is somehow the transport or technology used by XMLHttpRequest under the covers just doesn't make any sense.
It's certainly possible for XML to be sent in the HTTP request, but HTTP is a very precisely defined standard that isn't going away any time soon. Unless you're specifically using XML in your request, or the server is sending you a response in XML, there's nothing but plain old HTTP used in the XMLHttpRequest object. So the next time someone tells you, "Yeah, it's called XMLHttpRequest because it uses XML behind the scenes," just smile and patiently explain to them what HTTP is, and let them know that while XML can be sent over HTTP, XML is a data format, not a transfer protocol. You'll both be the better for the explanation.
Section 7.2: Using XML (for real)
So far, I've told you about all the places where XML isn't used in Ajax. But the x in Ajax and the XML in XMLHttpRequest are still very real, and you've several options for using XML in your Web applications. You'll look at the basic options in this section, and then really dig into detail in the rest of this chapter.
Options for XML
In your asynchronous apps, you'll find two basic applications of XML:
1. To send a request from a Web page to a server in XML format
2. To receive a request from a server in your Web page in XML format
The first of these -- to send a request in XML -- requires you to format your request as XML, either using an API to do so or just stringing together the text, and then sending the result to a server. In this option, the main job at hand is to construct the request in a way that complies with the rules of XML, and that can be understood by the server. So the focus is really on the XML format; you have the data you want to send, and just need to wrap it up in XML semantics. The rest of this chapter focuses on this use of XML in your Ajax applications.
The second of these options -- to receive a request in XML -- requires you to take a response from a server, and extract the data from XML (again, using either an API or more of a brute force approach). In this case, your focus is on the data from the server, and it just so happens that you've got to pull that data out of XML to use it in any constructive way. This is the subject of the next chapter, and you'll really dig into that in detail then.
A preemptory warning
Before I get into the details of using XML, a short cautionary word is in order: XML is not a small, fast, space-saving format. As you'll see in the next several sections and in the next chapter, there are some great reasons to use XML in this context, and some advantages that XML has over plain text requests and responses (especially for responses). However, XML is almost always going to take up more space and be slower than plain text, because you add all the tags and semantics required for XML to your messages.
If you want to write a blazing fast application that feels like a desktop app, XML might not be the best place to start. If you begin with plain text, and find a specific need for XML, then that's great; however, if you use XML from the beginning, you almost certainly slow down your application's responsiveness. In most cases, it's faster to send plain text -- using name/value pairs like name=jennifer -- than to turn the text into XML like this:
<name>jennifer</name>
Think of all the places where using XML adds time: wrapping the text in XML; sending across extra information (note that I didn't include any surrounding elements, an XML header, or anything else that would probably be part of a more realistic request); having the server parse the XML, generate a response, wrap the response back in XML, and send it back to your Web page; and then having your page parse the response and finally use it. So learn when to use XML, but don't start out by thinking that it's going to make your application faster in many situations; rather, it adds flexibility, as we'll begin to talk about now.
XML from the client to the server
Let's look at using XML as the format to send data from a client to a server. First, you'll see how to do this technically, and then spend some time examining when this is a good idea, and when it's not.
Sending name/value pairs
In about 90 percent of the Web apps you write, you'll end up with name/value pairs to send to a server. For example, if a user types their name and address into a form on your Web page, you might have data like this from the form:
firstName=Larry
lastName=Gullahorn
street=9018 Heatherhorn Drive
city=Rowlett
state=Texas
zipCode=75080
If you were just using plain text to send this data to a server, you might use code that looks something like Listing 1. (This is similar to an example I used in the first chapter in this book.)
Listing 1. Sending name/value pairs in plain text using a GET request
function callServer()
{
// Get the city and state from the Web form
let firstName = document.getElementById("firstName").value;
let lastName = document.getElementById("lastName").value;
let street = document.getElementById("street").value;
let city = document.getElementById("city").value;
let state = document.getElementById("state").value;
let zipCode = document.getElementById("zipCode").value;
// Build the URL to connect to
let url = "/scripts/saveAddress.php?firstName=" + escape(firstName) +
"&lastName=" + escape(lastName) + "&street=" + escape(street) +
"&city=" + escape(city) + "&state=" + escape(state) +
"&zipCode=" + escape(zipCode);
// Open a connection to the server
xmlHttp.open("GET", url, true);
// Set up a function for the server to run when it's done
xmlHttp.onreadystatechange = confirmUpdate;
// Send the request
xmlHttp.send(null);
}
|
Section 7.3: Converting name/value pairs to XML
The first thing you need to do if you want to use XML as a format for data like this is to come up with some basic XML format in which to store the data. Obviously, your name/value pairs can all turn into XML elements, where the element name is the name of the pair, and the content of the element is the value:
<firstName>Larry</firstName>
<lastName>Gullahorn</lastName>
<street>9018 Heatherhorn Drive</street>
<city>Rowlett</city>
<state>Texas</state>
<zipCode>75080</zipCode>
|
Of course, XML requires that you have a root element, or, if you're just working with a document fragment (a portion of an XML document), an enclosing element. So you might convert the XML above to something like this:
<address>
<firstName>Larry</firstName>
<lastName>Gullahorn</lastName>
<street>9018 Heatherhorn Drive</street>
<city>Rowlett</city>
<state>Texas</state>
<zipCode>75080</zipCode>
</address>
|
Now you're ready to create this structure in your Web client, and send it to the server ... almost.
Communication, of the verbal kind
Before you're ready to start tossing XML over the network, you want to make sure that the server -- and script -- to which you send data actually accepts XML. Now for many of you, this might seem like a silly and obvious point to make, but plenty of newer programmers just assume that if they send XML across the network, it is received and interpreted correctly.
In fact, you need to take two steps to ensure that the data you send in XML will be received correctly:
1. Ensure that the script to which you send the XML accepts XML as a data format.
2. Ensure the script will accept the particular XML format and structure in which you send data.
Both of these will probably require you to actually talk to a human being, so fair warning! Seriously, if it's important that you be able to send data as XML, most script writers will oblige you; so just finding a script that will accept XML shouldn't be that hard. However, you'still need to make sure that the your format matches what the script expects.
Most of the situations, the party that you're dealing with usually have some sort of documentation outlining the procedures of their API. For example, if you're trying to request an API from payment processors like PayPal, Stripe, Mastercard, Visa, etc, or from other parties as well, such as financial instutitions for requesting stock trading purposes, they're already layout their API documentation in a clear and concise for you to use to make requests. All you have to do is follow their guideline and make requests. You don't need to talk to a human being, except if you have further questions.
Most of the documentation will specify exactly what you should and shouldn't do to make the request. For the sake of this tutorial, suppose that the server accepts data like this:
<profile>
<firstName>Larry</firstName>
<lastName>Gullahorn</lastName>
<street>9018 Heatherhorn Drive</street>
<city>Rowlett</city>
<state>Texas</state>
<zip-code>75080</zip-code>
</profile>
|
This looks similar to the XML above, except for two things:
The XML from the client is wrapped within an address element, but the server expects the data to be wrapped within a profile element.
The XML from the client uses a zipCode element, while the server expects the zip code to be in a zip-code element.
In the grand scheme of things, these really small points are the difference between the server accepting and processing your data, and the server crashing miserably and supplying your Web page -- and probably its users -- with a cryptic error message. So you've got to figure out what the server expects, and mesh the data you send into that format. Then -- and only then -- are you ready to deal with the actual technicalities of sending XML from a client to a server.
Section 7.4: Sending XML to the server
When it comes to sending XML to the server, you'll spend more of your code taking your data and wrapping it XML than you will actually transmitting the data. In fact, once you have the XML string ready to send to the server, you send it exactly as you would send any other plain text; check out Listing 2 to see this in action.
Listing 2. Sending name/value pairs in XML using a POST request
function callServer()
{
// Get the city and state from the Web form
let firstName = document.getElementById("firstName").value;
let lastName = document.getElementById("lastName").value;
let street = document.getElementById("street").value;
let city = document.getElementById("city").value;
let state = document.getElementById("state").value;
let zipCode = document.getElementById("zipCode").value;
let xmlString = "<profile>" +
" <firstName>" + escape(firstName) + "</firstName>" +
" <lastName>" + escape(lastName) + "</lastName>" +
" <street>" + escape(street) + "</street>" +
" <city>" + escape(city) + "</city>" +
" <state>" + escape(state) + "</state>" +
" <zip-code>" + escape(zipCode) + "</zip-code>" +
"</profile>";
// Build the URL to connect to
let url = "/scripts/saveAddress.php";
// Open a connection to the server
xmlHttp.open("POST", url, true);
// Tell the server you're sending it XML
xmlHttp.setRequestHeader("Content-Type", "text/xml");
// Set up a function for the server to run when it's done
xmlHttp.onreadystatechange = confirmUpdate;
// Send the request
xmlHttp.send(xmlString);
}
|
Much of this is self-explanatory with just a few points worth noting. First, the data in your request must be manually formatted as XML. That's a bit of a letdown after three chapters on using the Document Object Model, isn't it? And while nothing forbids you from using the DOM to create an XML document using JavaScript, you'd then have to convert that DOM object to text before sending it over the network with a GET or POST request. So it turns out to be easier to simply format the data using normal string manipulation. Of course, this introduces room for error and typographical mistakes, so you need to be extra careful when you write code that deals with XML.
Once you construct your XML, you open a connection in largely the same way as you would when you send text. I tend to prefer using POST requests for XML, since some browsers impose a length limitation on GET query strings, and XML can get pretty long; you'll see that Listing 2 switches from GET to POST accordingly. Additionally, the XML is sent through the send() method, rather than as a parameter tacked on to the end of the URL you're requesting (e.g. a GET request). These are all fairly trivial differences, though, and easy to adjust for.
You will have to write one entirely new line of code, though:
xmlHttp.setRequestHeader("Content-Type", "text/xml");
This isn't hard to understand: it just tells the server that you're sending it XML, rather than plain old name/value pairs. In either case, you send data as text, but use text/xml here, or XML sent as plain text. If you just used name/value pairs, this line would read:
xmlHttp.setRequestHeader("Content-Type", "text/plain");
If you forget to tell the server that you're sending it XML, you'll have some trouble, so don't forget this step.
Once you get all this put together, all you need to do is call send() and pass in the XML string. The server will get your XML request, and (assuming you've done your pre-work) accept the XML, parse it, and send you back a response. That's really all there is to it -- XML requests with just a few changes of code.
Sending XML: Good or bad?
Before leaving XML requests (and this chapter) for XML responses, let's spend some real time thinking about the sensibility of using XML in your requests. I've already mentioned that XML is by no means the fastest data format in terms of transfer, but there's a lot more to think about.
Section 7.5: XML is not simple to construct
The first thing you need to realize is that XML is just not that easy to construct for use in requests. As you saw in Listing 2, your data quickly becomes pretty convoluted with the semantics of XML:
let xmlString = "<profile>" +
" <firstName>" + escape(firstName) + "</firstName>" +
" <lastName>" + escape(lastName) + "</lastName>" +
" <street>" + escape(street) + "</street>" +
" <city>" + escape(city) + "</city>" +
" <state>" + escape(state) + "</state>" +
" <zip-code>" + escape(zipCode) + "</zip-code>" +
"</profile>";
|
This might not seem so bad, but it's also an XML fragment that has only six fields. Most of the Web forms you'll develop will have ten to fifteen; although you won't use Ajax for all of your requests, it is a consideration. You're spending at least as much time dealing with angle brackets and tag names as you are with actual data, and the potential to make little typos is tremendous.
Another problem here is that -- as already mentioned -- you will have to construct this XML by hand. Using the DOM isn't a good option, as there aren't good, simple ways to turn a DOM object into a string that you can send as a request. So working with strings like this is really the best option -- but it's also the option that's hardest to maintain, and hardest to understand for new developers. In this case, you constructed all the XML in one line; things only get more confusing when you do this in several steps.
XML doesn't add anything to your requests
Beyond the issue of complexity, using XML for your requests really doesn't offer you much of an advantage -- if any -- over plain text and name/value pairs. Consider that everything in this chapter has been focused on taking the same data you could already send using name/value pairs (refer back to Listing 1) and sending it using XML. At no point was anything said about data that you can send with XML that you could not send using plain text; that's because there almost never is anything that you can send using XML that you can't send using plain text.
And that's really the bottom line with XML and requests: there's just rarely a compelling reason to do it. You'll see in the next chapter that a server can use XML for some things that are much harder to do when using plain text; but it's just not the case with requests. So unless you're talking to a script that only accepts XML (and there are some out there), you're better off using plain text in almost every request situation.
Section 7.6: Conclusion.
You should definitely feel like you're starting to get the XML in Ajax figured out. You know that Ajax apps don't have to use XML, and that XML isn't some sort of magic bullet for data transfer. You should also feel pretty comfortable in sending XML from a Web page to a server. Even more importantly, you know what's involved in making sure that a server will actually handle and respond to your requests: you've got to ensure that the server script accepts XML, and that it accepts it in the format that you're using to send the data over.
You also should have a good idea now of why XML isn't always that great a choice for a data format for requests. In future chapters, you'll see some cases where it helps, but in most requests, it simply slows things down and adds complexity. So while I'd normally suggest that you immediately start using the things you learned in a chapter, I'll instead suggest that you be very careful about using what you've learned here. XML requests have their place in Ajax apps, but that place isn't as roomy as you might think.
In the next chapter, you'll look at how servers can respond using XML, and how your Web applications can handle those responses. Happily, there's a much larger number of reasons for a server to send XML back to a Web app than the other way around, so you'll get even more use out of that chapter's technical detail; for now, be sure you understand why XML isn't always a great idea -- at least for sending requests. You might even want to try and implement some Web apps using XML as the data format for requests, and then convert back to plain text, and see which seems both faster and easier to you. See you next chapter.
Chapter 8
- Section 8.1 - Introduction
- Section 8.2 - Server Back-End
- Section 8.3 - Receiving XML from a server
- Section 8.4 - Dealing with XML as plain text
- Section 8.5 - Treating XML as XML
- Section 8.6 - XML on the server: A brief example
- Section 8.7 - Other options for interpreting XML
- Section 8.8 - Conclusion
Section 8.1: Introduction
In the last chapter, you saw how your Ajax apps can format requests to a server in XML. You also saw why, in most cases, that isn't a good idea. This chapter focuses on something that often is a good idea: returning XML responses to a client.
I don't really enjoy writing tutorials that are primarily about something that you shouldn't do. Most of the time, it's a pretty silly type of thing to write. I spend half the chapter explaining something, just so I can spend the rest of the chapter explaining what a bad idea it is to use the techniques you've just learned about. Such was the case, to a large degree, with last chapter's discussion, which taught you how to use XML as the data format for your Ajax apps' requests.
Hopefully, this chapter will redeem the time you spent learning about XML requests. In Ajax apps, while there are very few reasons to use XML as the sending data format, there are a lot of reasons why you might want a server to send XML back from a server, to a client. So everything you learned about XML in the last chapter will definitely start to have some value in this chapter.
Section 8.2: Server Back-End
Before you dive into the technical details of getting an XML response from a server, you need to understand why it's such a good idea for a server to send XML in response to a request (and how that's different from a client sending that request in XML).
Clients speak in name/value pairs
As you'll recall from the last chapter, clients don't need to use XML in most cases because they can send requests using name/value pairs. So you might send a name like this: name=jennifer. You can stack those up by simply adding an ampersand (&) between successive name/value pairs, like this: name=jennifer&job=president. Using simple text and these name/value pairs, clients can send requests with multiple values to a server easily. There's rarely a need for the additional structure (and overhead) that XML provides.
In fact, almost all the reasons you'd need to send XML to a server can be grouped into two basic categories:
1. The server only accepts XML requests. In these cases, you don't have a choice. The basics in last chapter's discussion should give you all the tools you need to send these sorts of requests.
2. You're calling a remote API that only accepts XML or SOAP requests. This is really just a specialized case of the previous point, but it's worth mentioning on its own. If you want to use the APIs from Google or Amazon in an asynchronous request, there are some particular considerations. I'll look at those, and a few examples of making requests to APIs like this, in next chapter's discussion.
Servers can't send name/value pairs (in a standard way)
When you send name/value pairs, the Web browser sending the requests and the platform responding to that request and hosting a server program cooperate to turn those name/value pairs into data that a server program can work with easily. Practically every server-side technology -- from Java servlets to PHP to Perl to Ruby on Rails -- allows you to call a variety of methods to get at values based on a name. So getting the name attribute is trivial.
This isn't the case going in the other direction. If a server replied to an app with the string name=jennifer&job=president, the client has no standardized, easy way to break up the two name/value pairs, and then break each pair into a name and value. You'll have to parse the returned data manually. If a server returns a response made up of name/value pairs, that response is no easier (or harder) to interpret than a response with elements separated by semicolons, or pipe symbols, or any other nonstandard formatting character.
Give me some space!
In most HTTP requests, the escape sequence %20 is used to represent a single space. So the text "Live Together, Die Alone" is sent over HTTP as Live%20Together,%20Die%20Alone.
What that leaves you with, then, is no easy way to use plain text in your responses and have the client get that response and interpret it in a standard way, at least when the response contains multiple values. If your server simply sent back the number 42, say, plain text would be great. But what about if it's sending back the latest ratings for the TV shows Lost, Alias, and Six Degrees, all at once? While you can chose many ways to send this response using plain text (see Listing 1 for a few examples), none are particularly easy to interpret without some work by the client, and none are standardized at all.
Listing 1. Server response for TV ratings (various versions)
show=Alias&ratings=6.5|show=Lost&ratings=14.2|show=Six%20Degrees&ratings=9.1
Alias=6.5&Lost=14.2&Six%20Degrees=9.1
Alias|6.5|Lost|14.2|Six%20Degrees|9.1
Even though it's not too hard to figure out how to break up these response strings, a client will have to parse and split the string up based on the semicolons, equal signs, pipes, and ampersands. This is hardly the way to write robust code that other developers can easily understand and maintain.
Enter XML
When you realize that there's no standard way for a server to respond to clients with name/value pairs, the reasoning behind using XML becomes pretty clear. When sending data to the server, name/value pairs are a great choice because servers and server-side languages can easily interpret the pairs; the same is true for using XML when returning data to a client. You saw the use of the DOM to parse XML in several earlier chapters, and will see how JSON provides yet another option to parse XML in a future chapter. And on top of all that, you can treat XML as plain text, and get values out of it that way. So there are several ways to take an XML response from a server, and, with fairly standard code, pull the data out and use it in a client.
As an added bonus, XML is generally pretty easy to understand. Most people who program can make sense of the data in Listing 2, for example.
Listing 2. Server response for TV ratings (in XML)
<ratings>
<show>
<title>Alias</title>
<rating>6.5</rating>
</show>
<show>
<title>Lost</title>
<rating>14.2</rating>
</show>
<show>
<title>Six Degrees</title>
<rating>9.1</rating>
</show>
</ratings>
|
The code in Listing 2 has no mystery about what a particular semicolon or apostrophe means.
Section 8.3: Receiving XML from a server
Because the focus of this tutorial is on the client side of the Ajax equation, I won't delve into much detail about how a server-side program can generate a response in XML. However, you need to know about some special considerations when your client receives XML.
First, you can treat an XML response from a server in two basic ways:
1. As plain text that just happens to be formatted as XML
2. As an XML document, represented by a DOM Document object.
Second, presume a simple response XML from a server for example's sake. Listing 3 shows the same TV listings as detailed above (this is, in fact, the same XML as in Listing 2, reprinted for your convenience). I'll use this sample XML in the discussions in this section.
Listing 3. XML-formatted TV ratings for examples
<ratings>
<show>
<title>Alias</title>
<rating>6.5</rating>
</show>
<show>
<title>Lost</title>
<rating>14.2</rating>
</show>
<show>
<title>Six Degrees</title>
<rating>9.1</rating>
</show>
</ratings>
|
Section 8.4: Dealing with XML as plain text
The easiest option to handle XML, at least in terms of learning new programming techniques, is to treat it like any other piece of text returned from a server. In other words, you basically ignore the data format, and just grab the response from the server.
In this situation, you use the responseText property of your request object, just as you would when the server sends you a non-XML response (see Listing 4).
Listing 4. Treating XML as a normal server response
function updatePage()
{
if (request.readyState == 4)
{
if (request.status == 200)
{
let response = request.responseText;
// response has the XML response from the server
alert(response);
}
}
}
|
In this code fragment, updatePage() is the callback, and request is the XMLHttpRequest object. You end up with the XML response, all strung together, in the response variable. If you printed out that variable, you'd have something like Listing 5. (Note that the code in Listing 5 normally is one, continuous line. Here, it is shown on multiple lines for display purposes.)
Listing 5. Value of response variable
<ratings><show><title>Alias</title><rating>6.5</rating>
</show><show><title>Lost</title><rating>14.2</rating></show><show>
<title>Six Degrees</title><rating>9.1</rating></show></ratings>
|
The most important thing to note here is that the XML is all run together. In most cases, servers will not format XML with spaces and carriage returns; they'll just string it all together, like you see in Listing 5. Of course, your apps don't care much about spacing, so this is no problem; it does make it a bit harder to read, though.
Review earlier chapters
To avoid lots of repetitive code, these later chapters only show the portions of code relevant to the subject being discussed. So Listing 4 only shows the callback method in your Ajax client's code. If you're unclear on how this method fits into the larger context of an asynchronous app, you should review the first several chapters, which cover the fundamentals of Ajax apps.
At this point, you can use the JavaScript split function to break up this data, and basic string manipulation to get at the element names and their values. Of course, that's a pretty big pain, and it ignores the handy fact that you spent a lot of time looking at the DOM, the Document Object Model, earlier in this book. So I'll urge you to keep in mind that you can use and output a server's XML response easily using responseText, but I wont show you much more code; you shouldn't use this approach to get at the XML data when you can use the DOM, as you'll see next.
Section 8.5: Treating XML as XML
While you can treat a server's XML-formatted response like any other textual response, there's no good reason to do so. First, if you've read this tutorial faithfully, you know how to use the DOM, a JavaScript-friendly API with which you can manipulate XML. Better yet, JavaScript and the XMLHttpRequest object provide a property that is perfect for getting the server's XML response, and getting it in the form of a DOM Document object.
To see this in action, check out Listing 6. This code is similar to Listing 4, but rather than use the responseText property, the callback uses the responseXML property instead. This property, available on XMLHttpRequest, returns the server's response in the form of a DOM document.
function updatePage()
{
if (request.readyState == 4)
{
if (request.status == 200)
{
var xmlDoc = request.responseXML;
// work with xmlDoc using the DOM
}
}
}
|
Now you have a DOM Document, and you can work with it just like any other XML. For example, you might then grab all the show elements, as in Listing 7.
Listing 7. Grabbing all the show elements
function updatePage()
{
if (request.readyState == 4)
{
if (request.status == 200)
{
var xmlDoc = request.responseXML;
var showElements = xmlDoc.getElementsByTagName("show");
}
}
}
|
If you're familiar with DOM, this should start to feel familiar. You can use all the DOM methods you've already learned about, and easily manipulate the XML you received from the server.
You can also, of course, mix in normal JavaScript code. For instance, you might iterate through all the show elements, as in Listing 8.
Listing 8. Iterating through all the show elements
function updatePage()
{
if (request.readyState == 4)
{
if (request.status == 200)
{
let xmlDoc = request.responseXML;
var showElements = xmlDoc.getElementsByTagName("show");
for (let x = 0; x < showElements.length; x++)
{
// We know that the first child of show is title,
//and the second is rating
let title = showElements[x].childNodes[0].value;
let rating = showElements[x].childNodes[1].value;
// Now do whatever you want with the show title and ratings
}
}
}
}
|
With this relatively simple code, you treated an XML response like it's XML, not just plain unformatted text, and used a little DOM and some simple JavaScript to deal with a server's response. Even more importantly, you worked with a standardized format -- XML -- instead of comma-separated values or pipe-delimited name/value pairs. In other words, you used XML where it made sense, and avoided it when it didn't, like in sending requests to the server.
Section 8.6: XML on the server: A brief example
Although I haven't talked much about how to generate XML on the server, it's worth seeing a brief example. Listing 9 shows a simple PHP script that response to the client's request and performas some tasks such as storing and retrieving data into and out of database, respectively. After performing some tasks on the database, it outputs XML back to the client, presumably from an asynchronous client request.
This is the brute force approach, where the PHP script is really just pounding out the XML output manually. You can find a variety of toolkits and APIs for PHP and most other server-side languages that also allow you to generate XML responses. In any case, this at least gives you an idea of what server-side scripts that generate and reply to requests with XML look like.
Listing 9. PHP script that returns XML
<?php
// Connect to a MySQL database
$conn = @mysql_connect("mysql.myhost.com", "username", "secret-password");
if (!conn)
die("Error connecting to database: " . mysql_error());
if (!mysql_select_db("television", $conn))
die("Error selecting TV database: " . mysql_error());
// Get ratings for all TV shows in database
$select = 'SELECT title, rating';
$from = ' FROM ratings';
$queryResult = @mysql_query($select . $from);
if (!$queryResult)
die("Error retrieving ratings for TV shows.');
// Let the client know we're sending back XML
header("Content-Type: text/xml");
echo "<?xml version=\"1.0\" encoding=\"utf-8\"?>";
echo "<ratings>";
while ($row = mysql_fetch_array($queryResult))
{
$title = $row['title'];
$rating = $row['rating'];
echo "<show>
echo "<title>" . $title . "</title>";
echo "<rating>" . $rating . "</rating>";
echo "</show>";
}
echo "</ratings>";
mysql_close($conn);
?>
|
You should be able to output XML in a similar way using your own favorite server-side language. Google the Web using the term like "sending/receiving XML in [your favorite server-side language]".
Section 8.7: Other options for interpreting XML
One very popular options for dealing with XML, beyond treating it as unformatted text or using the DOM, is important and worth mentioning. That's JSON, short for JavaScript Object Notation, and it's a free text format that is bundled into JavaScript. I don't have room to cover JSON in this chapter, so I'll come back to it in future chapters; you'll probably hear about it as soon as you mention XML and Ajax apps, however, so now you'll know what your co-workers are talking about.
In general, everything that you can do with JSON, you can do with the DOM, or vice versa; it's mostly about preference, and choosing the right approach for a specific application. For now, stick with the DOM, and get familiar with it in the context of receiving a server's response. In future chapters, I'll spend a good amount of time on JSON, and then you'll be ready to choose between the two on your next app. So stay tuned: lots more XML is coming in the next couple of chapters.
Section 8.8: Conclusion.
I've talked about XML nearly non-stop since the last chapter in this XML tutorial series began, but have still really only scratched the surface of XML's contribution to the Ajax equation. In my next chapter, you'll look in more detail at those particular occasions in which you would want to send XML (and see in which of those cases you'll need to receive XML back as well). In particular, you'll examine Web services -- both proprietary ones and APIs like Google -- in light of Ajax interaction.
Your biggest task in the short term, though, is to really think about when XML makes sense for your own applications. In many cases, if your app is working well, then XML is nothing more than a technology buzzword that can cause you headaches, and you should resist the temptation to use it just so you can say you have XML in your application.
If you've a situation where the data the server sends you is limited, though, or in a strange comma- or pipe-delimited format, then XML might offer you real advantages. Consider working with or changing your server-side components so that they return responses in a more standard way, using XML, rather than a proprietary format that almost certainly isn't as robust as XML.
Most of all, realize that the more you learn about the technologies around Ajax, the more careful you have to be about your decisions. It's fun to write these Web 2.0 apps (and in coming chapters, you'll return to the user interface and see some of the cool things that you can do), but it also takes some caution to make sure you don't throw technologies at a working Web page just to impress your friends. I know you can write a good app, so go out and do just that. When you're finished, come back here for next chapter's discussion, and even more XML.
Chapter 9
- Section 9.1 - Introduction
- Section 9.2 - Using public APIs
- Section 9.3 - Google's API documentation
- Section 9.4 - Adding in a pre-search
- Section 9.5 - Going further with Google's Ajax Search API
- Section 9.6 - Conclusion
Section 9.1: Introduction
Making asynchronous requests isn't just about talking to your own server-side programs. You can also communicate with public APIs like those from Google or Amazon, and add more functionality to your Web applications than just what your own scripts and server-side programs provide. In this chapter, I will teache you how to make and receive requests and responses from public APIs like those supplied by Google.
So far in this book, the focus was exclusively on situations in which your client Web pages make requests to your server-side scripts and programs. This is how probably 80 to 90 percent of Ajax applications -- asynchronous Web applications that use the XMLHttpRequest object -- work. However, there is a fairly serious limitation in this approach: you're limited by your own ingenuity and programming skills, or at least by the ingenuity and programming skills of the programmers on your team, in your company.
Almost certainly, sometimes you find'll that you really want to do something, but you don't have the technical knowledge necessary to achieve that goal. Perhaps you don't know some piece of syntax, or how to come up with the right algorithm. In other cases, you might not have the data or resources (either people-resources or data-resources) to fill your needs. It's in these cases that you might find yourself thinking, "Gee, if I could just use that other person's code!" This chapter is meant to address that particular case.
Open source scripts and programs
Before I get into the meat of this chapter -- using public APIs in your Web applications -- it's worth mentioning the existence of open source scripts and programs. Without getting too deeply into detail, open source is a term used to describe code that can be, to some degree, freely used and reused in your own applications. Consult Resources for relevant links, but at a 10,000-foot view, you can take open source code that someone else has written, and simply drop it into your own environment, without charge or (much) restriction.
If you make use of open source code, sometimes you'll have to add some extra documentation to your applications, or perhaps contribute changes you make to the open source program or script back to the community. Whatever the particulars of the program that you use, the end result is that you can use code that you didn't have to write, and perhaps wouldn't have been able to write without a lot of help and resources that you don't have. Projects like Apache make it easy to take advantage of the work that others have done -- and don't worry; they want you to use their work!
Articles and tutorials online
It would also be pretty silly writing a book about Ajax and not mention the wealth of resources, from articles to tutorials to white papers, available on the Internet. There are literally hundreds of thousands of pieces of instruction online, and you could probably find close to a thousand articles about Ajax -- and one author by the name of Brett McLaughlin has written countless articles and books--most of them available online for free. Most of these articles have working code, examples, downloads, and all sorts of other goodies available for your use.
If you don't have the ability to code the server-side program or script you want to use, or can't find an open source program or script to do what you need, hop over to Google and try entering in a basic description of what you're looking for. You'll often find an article, or tip, or some other snippet online that might help you do just what you need. Hop over to developerWorks and do the same; often, you'll find exactly the piece of code, or even entire script, that you were looking for, complete with helpful comments and a description of how it works.
Section 9.2: Using public APIs
Many times, you'll face a problem that isn't just technical. You don't need help writing a particular script or piece of code; rather, you need data or resources that you simply don't have. In these cases, even if a tutorial or open source script were available to help you, you'd still need more. Consider, for example, a case in which you want to place a search engine on your Web page. That presumes that you have the data that you want to search -- but what if you want to search beyond the data your company or organization has available?
In cases where you are limited not by technical ability, but by data, a public API might help you solve your problem. A public API allows you to use a program hosted on someone else's servers, using someone else's data. In general, the API itself defines how you interact with the program. For instance, a public API to the Google search engine would var you make search requests, but Google's code would search Google's data, and return the results to your program. You not only get the benefit of someone else's technical skills in writing these programs, but you also get the benefit of data stores far beyond your or your company's ability to support.
Getting set up to use the Google Ajax Search API
Google remains, arguably, the breakthrough application of the online era. Grandmothers and four-year-olds know about Google, even if they don't understand how anything else online works. Google runs such a massively popular and useful search engine, and seems so committed to providing (mostly) free services that it's no surprise that it has a public API available for you to use in your own programs. In this section, you'll get set up to use the Google API, and prepare to figure out exactly how you can make an asynchronous application talk to Google.
Getting a developer key from Google
This chapter will focus specifically on Google's Ajax Search API. You can find out more online about this particular API by visiting the Google Ajax Search API home page, which is shown in Figure 1.
Figure 1. Google's Ajax Search API page
Your first step is to click the Sign up for a Google AJAX Search API key link. This will take you to a page where you can sign up to use the Google API. You'll need to accept some terms of use -- all of which are pretty harmless, as far as I can tell -- and supply the URL of the Web site where your application will run (see Figure 2).
Figure 2. Signing up for Google's Ajax Search API
What URL should I use?
The URL that Google asks for is more or less actually the domain where you run your site. You only need to be more specific if your site uses a subdomain or a particular path within a larger domain.
Once you've read the agreement and checked the checkbox, enter in your URL, click Generate API Key, and wait a second or two. At this point, you'll have to log in to Google, or create an account. This is a pretty standard process, and you should be able to handle it on your own. Once you're finished, you'll get a nice reply screen back, which gives you a very long key, repeats back your URL, and even gives you a sample page. The key will look something like this:
ABQIAAAAjtuhyCXrSHOFSz7zK0f8phSA9fWLQO3TbB2M9BRePlYkXeAu8lHeUgfgRs0eIWUaXg
Section 9.3: Google's API documentation
Before you start to use the key you've just been assigned, you take some time to check out Google's API documentation (there's a link at the bottom of the page that supplied your key. Even though you can get a really good start through this chapter, you'll find that Google's API documentation is a good read, and will probably give you some interesting ideas for how you can use Google on your own site, in your own unique applications.
The simplest Google search Web application
To get you used to seeing what's possible, let's take the sample Web page that Google provides, change it up just a bit, and see how it works.
Creating a search box
Listing 1 shows a pretty simple Web page; go ahead and type it into your favorite editor, save it, and upload it to the domain or URL that you supplied to Google in the previous section.
Listing 1. The HTML for a simple Google search application
<html>
<head>
<title>My Google AJAX Search API Applicationlt;/title>
<link href="http://www.google.com/uds/css/gsearch.css"
type="text/css" rel="stylesheet" />
<script
src="http://www.google.com/uds/api?file=uds.js&v=1.0&key=YOUR KEY HERE"
type="text/javascript"> </script>
<script language="Javascript" type="text/javascript">
function OnLoad()
{
// Create the Google search control
let searchControl = new GSearchControl();
// These allow you to customize what appears in the search results
let localSearch = new GlocalSearch();
searchControl.addSearcher(localSearch);
searchControl.addSearcher(new GwebSearch());
searchControl.addSearcher(new GvideoSearch());
searchControl.addSearcher(new GblogSearch());
// Tell Google your location to base searches around
localSearch.setCenterPoint("Dallas, TX");
// "Draw" the control on the HTML form
searchControl.draw(document.getElementById("searchcontrol"));
}
</script>
</head>
<body onload="OnLoad()">
<div id="searchcontrol" />
</body>
</html>
|
Be sure to replace the bolded text with your own developer key from Google. When you load the page, you'll get something that looks a lot like Figure 3.
Figure 3. The simplest search form for Google
There's not much to it, but all the power of Google is sitting behind that little control.
Running a search
Type in a search term and click Search to send Google into action. You'll quickly see several results pop up, as shown in Figure 4.
Figure 4. Google's search results
Section 9.4: Adding in a pre-search
Obviously, the page looks a whole lot better once you do a search; the video, blogs, and search results give the page a nicer look. Thus, you might want to add a pre-search -- a search term that you define, the results of which will come up the first time a user loads your page. To do that, just add the bolded line in Listing 2 into your JavaScript.
Listing 2. Adding a pre-search term
function OnLoad()
{
// Create the Google search control
let searchControl = new GSearchControl();
// These allow you to customize what appears in the search results
let localSearch = new GlocalSearch();
searchControl.addSearcher(localSearch);
searchControl.addSearcher(new GwebSearch());
searchControl.addSearcher(new GvideoSearch());
searchControl.addSearcher(new GblogSearch());
// Tell Google your location to base searches around
localSearch.setCenterPoint("Dallas, TX");
// "Draw" the control on the HTML form
searchControl.draw(document.getElementById("searchcontrol"));
searchControl.execute("Christmas Eve");
}
|
Obviously, you can insert your own initial search term into your code to customize what comes up when the page loads.
JavaScript breakdown
Before I move on, take a quick look at what these basic commands do. First, a new GSearchControl is created, as illustrated in Listing 3. This is the construct that lets you do all the searching:
Listing 3. Creating a new GSearchControl
function OnLoad()
{
// Create the Google search control
let searchControl = new GSearchControl();
...
}
|
Next, the code sets up a new local search, using a GlocalSearch; this is a special Google construct that allows you to perform a search based on a specific location. The local search is illustrated in Listing 4.
Listing 4. Setting up a new local search
function OnLoad()
{
// Create the Google search control
let searchControl = new GSearchControl();
// These allow you to customize what appears in the search results
let localSearch = new GlocalSearch();
...
// Tell Google your location to base searches around
localSearch.setCenterPoint("Dallas, TX");
...
}
|
This is all pretty self-explanatory, once you learn the objects and methods to call. The code in Listing 4 creates a new local searcher, and then sets the center point of the search.
Next up in Listing 5 are several lines that tell the search control exactly what types of searches it should perform.
Listing 5. Search types to allow
function OnLoad()
{
// Create the Google search control
let searchControl = new GSearchControl();
// These allow you to customize what appears in the search results
let localSearch = new GlocalSearch();
searchControl.addSearcher(localSearch);
searchControl.addSearcher(new GwebSearch());
searchControl.addSearcher(new GvideoSearch());
searchControl.addSearcher(new GblogSearch());
// Tell Google your location to base searches around
localSearch.setCenterPoint("Dallas, TX");
...
}
|
You can look up most of these search types, here's a short summary:
1. GwebSearch: An object for searching the Web, which is what Google is best known for.
2. GvideoSearch: This object looks for video related to your search terms.
3. GblogSearch: This object focuses specifically on searching through blogs, which are structured and tagged a bit differently from other Web content types.
You've already seen how to pre-load a specific search. All that's left, then, is the draw() method call, illustrated in Listing 6. You give this call a DOM element in your HTML. The control will then magically appear on your form, ready for use.
Listing 6. Drawing the search control
function OnLoad()
{
// Create the Google search control
let searchControl = new GSearchControl();
// These allow you to customize what appears in the search results
let localSearch = new GlocalSearch();
searchControl.addSearcher(localSearch);
searchControl.addSearcher(new GwebSearch());
searchControl.addSearcher(new GvideoSearch());
searchControl.addSearcher(new GblogSearch());
// Tell Google your location to base searches around
localSearch.setCenterPoint("Dallas, TX");
// "Draw" the control on the HTML form
searchControl.draw(document.getElementById("searchcontrol"));
searchControl.execute("Christmas Eve");
}
|
But where's the Ajax?
It's actually not readily apparent where the asynchrony happens in this simple search box. Sure, it's pretty cool that you can throw up a Google search box somewhere within your own Web application, but this is still a series on Ajax apps, not Google searches. So where's the Ajax?
Enter in a search term and click the Search button, and you'll notice a very Ajaxian response: the search results come up without a page reload. That's one of the hallmarks of most Ajax apps -- the visible content changing without reloading pages. Clearly, something is going on beyond the normal request/response model. But where is XMLHttpRequest? Where is the request object that you've learned about for so many articles? And other than that one getElementById() method, where is the DOM and page manipulation? Well, it's all wrapped up in two lines within your HTML.
Google takes care of the JavaScript
The first line of note is one I haven't talked much about yet, and it's illustrated in Listing 7.
Listing 7. The all-important JavaScript file
<script src="http://www.google.com/uds/api?file=uds.js&v=1.0&key=[YOUR GOOGLE KEY]"
type="text/javascript"> </script>
|
The syntax here isn't particularly interesting, but the point is that Google hosts a file named uds.js, which has within it all the JavaScript needed for the search box to operate. This is using someone else's code in the truest sense: you're even letting the third party host the code your application uses. That's pretty significant, because Google handles upkeep and maintenance, and when the company upgrades the JavaScript file, you get the benefits automatically. Google won't change the API without letting you know, so your code will keep working even if the JavaScript file is changed.
The GSearchControl object
The other thing somewhat hidden from view is the code for the GSearchControl object, created in the onLoad() JavaScript function. All you have to do to create this object is invoke the code in Listing 8.
Listing 8. Creating a GSearchControl object
// Create the Google search control
let searchControl = new GSearchControl();
|
The necessary HTML is also pretty bland: just a div tag with an ID that your JavaScript can refer to, as shown in Listing 9.
Listing 9. All the HTML you'll need to create a search control
<div id="searchcontrol" />
|
What does Google's JavaScript look like?Google's JavaScript isn't so easy to get at. First, the uds.js JavaScript file figures out some locality settings, handles some Google-specific tasks, verifies your Google key, and then loads two other scripts:
http://www.google.com/uds/js/locale/en/uistrings.js and
http://www.google.com/uds/js/uds_compiled.js.
You can actually pull up these two files and wade through them if you're interested, but beware: it's tough going through advanced code, and the formatting is awful! For most of you, simply knowing how to use these files should be your goal, rather than worrying too much about what they do at a line-by-line level.
But, again, behind the scenes, Google's code is doing all sorts of things. It's creating a new text box, some iconic graphics, and a button that calls a JavaScript function, also in Google's JavaScript. So you get all sorts of behavior for free; while you should understand the basics of how this happens, it's convenient that you can simply use this code, and get on with the rest of your application.
Ajax is more than just the code you write
So Ajax apps aren't just about you using XmlHttpRequest; they're about a way to approach Web applications, and are based upon asynchrony. Even though you didn't write any Ajax-specific code, you have created an Ajax app. Thank Google: it did most of the work, and you get the benefit!
Section 9.5: Going further with Google's Ajax Search API
At this point, it's up to you to take these steps and adapt them to your own applications. At the simplest end of the spectrum, you can drop a div into your own Web pages and add the JavaScript shown in Listing 1 to your Web page; you'll have Google search all ready for use.
But the fun doesn't have to stop there. You don't need to limit yourself to this specific set of options or controls. Play around with the Web results, the blog results, and the video results, and integrate each into your Web applications where appropriate. You might want to offer multiple search controls, each of them focusing on a specific type of result. You might want to include the Google search control in a span element, right in the middle of the rest of your app's content, rather than off to the side in a div. Whatever the case, you really should ensure that Google's search is molded to fit your needs, rather than modifying your applications to suit Google.
Section 9.6: Conclusion.
It shouldn't be hard to build on what you've learned here and start to add Google search boxes and other uses of the Google API to your own Ajax apps. More importantly, though, you should now have a pretty good idea of how to use public APIs in general. For example, Amazon.com offers a public API that allows you to perform the same kind of Web searches you performed with Google on books and other merchandise from Amazon's store. You can start to hunt around for your own favorite public APIs, and move beyond just what your own coding skills allow for. In fact, you can very easily create a site that integrates with Google, Amazon.com, Flickr, and much more.
So while it's important to get a handle on how to use Google -- because of the search algorithms and enormous data stores that Google offers -- it's even more important to learn how to use any public API. You should also start thinking about your application as more than a sum of your coding skills; instead, it can simply be a gateway to letious pieces of data. That data might be stored on the servers of Google, Amazon.com, del.icio.us, or anywhere else. Add to that your own business's or project's take on that data, and you've got a very powerful and robust solution that goes well beyond what you could code on your own.
So go out and make big applications. Use data from all sorts of places, and don't be confined by what you've coded yourself. Enjoy, and I'll come back to some more technical issues, like data formats, in the next chapter.
Chapter 10
- Section 10.1 - Introduction
- Section 10.2 - The Power to Choose
- Section 10.3 - Adding JSON to the Mix
- Section 10.4 - Arrays of Values
- Section 10.5 - Using JSON in JavaScript
- Section 10.6 - Modifying JSON data
- Section 10.7 - Conclusion
Section 10.1: Introduction
Plain text and XML are both data formats that you can use for sending and receiving information in your asynchronous applications. This chapter looks at another useful data format, JavaScript Object Notation (JSON), and how it makes moving data and objects around in your applications easier.
Obviously, XML has received its fair share of press (both negative and positive), and it's no surprise that it shows up in Ajax applications. You can review earlier chapters in this book to see how XML provides an alternative data format, for example, to refresh your memory:
<request>
<firstName>John</firstName>
<lastName>Doe</lastName>
<email>john@doe.com</email>
</request>
|
This is the same data you saw earlier, but this time it's stored in an XML format. There's nothing remarkable going on here; it's just a different data format that allows you to use XML instead of plain text and name/value pairs. It's XML!
This chapter takes on yet another data format, called JavaScript Object Notation, or JSON. JSON looks a bit like what you've seen already, and a bit like nothing you've ever seen before. It will give you another choice, and having choices is a good thing.
Section 10.2: The power to choose
Before digging into the details of the JSON format, you should understand why it's worth spending another couple of chapters on another data format (yes, the next chapter will deal with JSON as well), especially when you already know how to work with both XML and name/value pairs in plain text. In a nutshell, though, it's simple: The more choices you have, and the more options you have for any problem, the better your chances are of finding the best solution to a problem, rather than just a solution.
Recapping name/value pairs and XML
This book has already touched a good bit on those situations in which name/value pairs make sense, as well as those in which XML might be a better choice. To recap quickly, your first thought should always be to use name/value pairs. Doing so is almost always the simplest solution to the problems in most asynchronous applications, and it doesn't require anything but a very basic knowledge of JavaScript.
You really shouldn't even worry about using an alternate data format unless you have some sort of constraint that moves you towards XML. Obviously, if you're sending data to a server-side program that requires XML-formatted input, then you will want to use XML as your data format. In most cases, though, XML turns out to be a better choice for the servers that need to send your application multiple pieces of information; in other words, XML is more commonly used for responses to Ajax applications, rather than requests from Ajax applications.
So that's why very often you'll see experienced application developers very seldom use XML for requests but at the same time find it more necessary to use XML (and probably better alternatives) for responses to client applications. If you're working in financial and insurance industries as a developer, you'll definitely be forced into using XML for your responses to client applications because it is easier and more powerful than alternatives.
Section 10.3: Adding JSON to the mix
When you're using either name/value pairs or XML, you're essentially taking data from the application using JavaScript and stuffing it into a data format. In these cases, JavaScript is functioning largely as a data manipulation language, moving and manipulating data from Web forms and putting it into a format that can be easily sent to a server-side program.
However, there are times when you'll use JavaScript as more than just a format language. In these cases, you're actually using objects in the JavaScript language to represent data, and going beyond just shuttling data from Web forms into requests. In these situations, it's more work to extract data from the objects in JavaScript and then stuff that data into name/value pairs or XML. This is where JSON shines: It allows you to easily turn JavaScript objects into data that can be sent as part of a request (synchronous or asynchronous).
The bottom line is that JSON isn't some sort of magic bullet; it is, however, a great option for some very specific situations. Rather than assuming that you won't ever encounter those situations, read this chapter and the next in the JSON tutorial topics to learn about JSON, so you'll be equipped when you do run into those types of problems.
JSON basics
JSON (JavaScript Object Notation) is a lightweight data-interchange format built-in the JavaScript language already and you don't need a plugin to use it. It is easy for humans to read and write. It is easy for machines to parse and generate. It is based on a subset of the JavaScript Programming Language, Standard ECMA-262 3rd Edition - December 1999. JSON is a text format that is completely language independent but uses conventions that are familiar to programmers of the C-family of languages, including C, C++, C#, Java, JavaScript, Perl, TCL, and many others. These properties make JSON an ideal data-interchange language.
You'll see that most of today's programming languages use JSON data format as well in addition to their native data formats.
At its simplest, JSON allows you to transform a set of data represented in a JavaScript object into a string that you can easily pass from one function to another, or -- in the case of asynchronous applications -- from a Web client to a server-side program. The string looks a little odd (you'll see some examples in just a moment), but it's easily interpreted by JavaScript, and JSON allows you to represent structures more complex than name/value pairs. For instance, you can represent arrays and complex objects, rather than just simple lists of keys and values.Simple JSON examples
At its very simplest, you can represent what is essentially a name/value pair in JSON like this:
{ "firstName" : "John" }
|
This is pretty basic and actually takes up more space than the equivalent name/value pair in clear text:
firstName=John
|
However, JSON illustrates its value when you start to string together multiple name/value pairs. First, you can create what is essentially a record of data, with multiple name/value pairs, like this:
{ "firstName" : "John", "lastName" : "Doe", "email" : "john@doe.com" }
|
There's still not much advantage here over name/value pairs in terms of syntax, but in this case JSON is significantly easier to use, and has some readability advantages. For example, it's clear that all three of the values above are part of the same record; the brackets establish that the values have some connection.
Section 10.4: Arrays of values
When you need to represent a set of values, JSON starts to be not only more readable, but less verbose. Say, for example, that you want to have a list of people. In XML, you'd be stuck with lots of opening and closing tags, and if you were using typical name/value pairs -- the kind we've looked at in earlier chapters -- then you'd have to come up with a proprietary data format, or perhaps modify the key names to something like person-firstName.
With JSON, you can simply group multiple bracketed records, for example:
{
"people":
[
{ "firstName" : "John", "lastName" : "Doe", "email" : "john@doe.com" },
{ "firstName" : "Jane", "lastName" : "Doe", "email" : "jane@doe.com" },
{ "firstName" : "Mary", "lastName" : "Public", "email" : "mary@abc.com" }
]
}
|
This isn't too hard to understand. In this case, there's a single variable, named people, and the value is the array containing three items, each of which is a person record with a first name, a last name, and an e-mail address. The example above illustrates how you can throw records together, and also group the items into a single value with brackets around it. Of course, you could use the same syntax, but have multiple values (each with multiple records), for example:
{
"programmer":
[
{ "firstName" : "John", "lastName" : "Doe", "email" : "john@doe.com" },
{ "firstName" : "Jane", "lastName" : "Doe", "email" : "jane@doe.com" },
{ "firstName" : "Mary", "lastName" : "Public", "email" : "mary@abc.com" }
],
"author":
[
{ "firstName" : "Isaac", "lastName" : "Asimov", "genre" : "science fiction" },
{ "firstName" : "Tad", "lastName" : "Williams", "genre" : "fantasy" },
{ "firstName" : "Frank", "lastName" : "Peretti", "genre" : "christian fiction" }
],
"musician":
[
{ "firstName" : "Eric", "lastName" : "Clapton", "instrument" : "guitar" },
{ "firstName" : "Sergei", "lastName" : "Rachmaninoff", "instrument" : "piano" }
]
}
|
The most obvious thing to note here is your ability to represent multiple values that each in turn have multiple values. What you should also notice, though, is that the actual name/value pairs in the records change across the different main entries (programmer, author, and musician). JSON is completely dynamic and lets you change the way you represent data in the middle of your JSON structure.
To put it another way, there is no predefined set of constraints that you need to follow when working with JSON-formatted data. So you can change how you represent things, or even represent the same thing in different ways, all within the same data structure.
Section 10.5: Using JSON in JavaScript
After you've got a handle on the JSON format, it's simple to use it within JavaScript. JSON is a native JavaScript format, meaning simply that you don't need any special API or toolkit to work with JSON data within JavaScript -- it's already built-in in the core JavaScript libraries.
Assigning JSON data to a variable
For example, you can simply create a new JavaScript variable and then directly assign a string of JSON-formatted data to it, for example:
let people =
{
"programmer":
[
{ "firstName" : "John", "lastName" : "Doe", "email" : "john@doe.com" },
{ "firstName" : "Jane", "lastName" : "Doe", "email" : "jane@doe.com" },
{ "firstName" : "Mary", "lastName" : "Public", "email" : "mary@abc.com" }
],
"author":
[
{ "firstName" : "Isaac", "lastName" : "Asimov", "genre" : "science fiction" },
{ "firstName" : "Tad", "lastName" : "Williams", "genre" : "fantasy" },
{ "firstName" : "Frank", "lastName" : "Peretti", "genre" : "christian fiction" }
],
"musician":
[
{ "firstName" : "Eric", "lastName" : "Clapton", "instrument" : "guitar" },
{ "firstName" : "Sergei", "lastName" : "Rachmaninoff", "instrument" : "piano" }
]
};
|
There's nothing complicated going on here; now 'people' contains the JSON formatted data we've been looking at throughout this chapter. However, this doesn't do much, as the data still isn't in a format that is obviously useful.
Accessing the data
While it might not be obvious, that lengthy string above is just an array, and once you've got that array in a JavaScript variable, you can access it easily. In fact, you can simply separate the array with period delimiters.
Le's back up a little bit and clarify the last sentence: If you look closely in the data format above you'll see that the data is formatted into groups, starting with the outter curly brackets "{}" and followed by the square brackets "[]" and then followed by another set of curly brackets. The curly brackets signify as JSON object format while the square bracket signify as JSON array. What it tells us is that, JSON data format is full of mixed data objects: JSON objects and JSON array objects.
This means that, you can mix and match them anyway you like, provided that you'll have to access them accordingly as well.
So, to access the last name of the first entry of the 'programmer' list, you would use code like this in your JavaScript to specify both the JSON object using periods "." and JSON array using the array (square) brackets, for example:
people.programmer[0].lastName;
Take note (above) that the indexing is zero-based. So this begins with the data in the 'people' (object) variable; it then moves to the item called 'programmer' and pulls off the first record ([0] in the array object); finally, it accesses the value for the lastName key (as in people.programmer[0].lastName). The result is the string value "Doe". Notice the use of the periods "." to signify as JSON object accessor.
Here are a few more examples using the same variable.
people.author[1].genre // Value is "fantasy"
people.musician[3].lastName // Undefined. This refers to the fourth entry, and there isn't one
people.programmer[2].firstName // Value is "Mary"
With this little bit of syntax, you can work with any variety of JSON-formatted data, all without any extra JavaScript toolkits or APIs.
Section 10.6: Modifying JSON data
Just as you can access data with the dot and bracket notation shown above, you can easily modify data in the same way, or in this case, correcting a mis-spelling:
people.musicians[1].lastName = "Rachmaninov"; // "Rachmaninov" is now spelled correctly
That's all you need to do to change data in a variable once you've converted from a string to JavaScript objects.
Converting back to JSON strings
Of course, all that data modification isn't of much value if you can't easily convert back into the JSON textual format mentioned in this chapter. That's also trivial in JavaScript:
var newJSONtext = JSON.stringify(people);
That's all there is to it!
Now you've got a string of text that you can use anywhere you like -- you could use it as the request string in an Ajax application, for instance:
// see url timeStamp explanation later near the end of chapter 11
let url = "/cgi-local/server.php?timeStamp=" + new Date().getTime();
request.open("POST", url, true);
request.setRequestHeader("Content-type", "application/x-www-form-urlencoded");
request.send("newJSONtext);
Perhaps even more importantly, you can convert any JavaScript object into JSON text. You don't have to work only with variables that were originally assigned a JSON-formatted string. To transform an object named myObject, you would simply issue the same sort of command:
var myObect = { firtName : "John", lastName : "Doe", email : "john@doe.com" };
var myObjectInJSON = JSON.stringify(myObject);
This is the biggest difference between JSON and other data formats this book has explored. With JSON, you call a simple function and get your data, formatted and ready for use. With other data formats, it's your job to handle the conversion between the raw data and the formatted data. Even when using an API like the Document Object Model that provides a function that converts from its own data structure into text, you've got to learn the API and use that API's objects, rather than native JavaScript objects and syntax.
The end result is that when you're already working with lots of JavaScript objects, JSON is almost certainly a good bet for you to easily convert your data into a format that is simple to send in your requests to server-side programs.
Let's see some brief JSON data structure examples:
A common use of JSON is to exchange data to/from a web server.
When sending data to a web server, the data has to be a string. And the most popular string format is the JSON string data structure.
Before a string is sent to the server, it needs to convert from a JavaScript object into a string with JSON.stringify().
Stringify a JavaScript Object
Imagine we have this object in JavaScript:
var obj = { name: "John", age: 30, city: "New York" };
Use the JavaScript function JSON.stringify() to convert it into a string.
var myJSON = JSON.stringify(obj);
The result will be a string following the JSON notation. So myJSON is now a JSON string (or more specifically a JSON string object), and ready to be sent to a server:
// obj is a Javascript array object, myJSON is a JSON data
var obj = { name: "John", age: 30, city: "New York" };
var myJSON = JSON.stringify(obj);
document.getElementById("demo").innerHTML = myJSON;
Section 10.7: Conclusion.
This book has spent a lot of time looking at data formats, mostly because your asynchronous applications are ultimately almost all about data. If you have a variety of tools and techniques that will let you send and receive all kinds of data -- and do it in the best, most efficient manner for each data type -- then you're well on your way to being an Ajax pro. Add JSON to what you've already got available in using XML and plain text, and you're equipped for even more complex data structures in JavaScript.
The next chapter goes beyond just sending data, and dives into how server-side programs can receive -- and deal with -- JSON-formatted data. I'll also look at how server-side programs can send back data in the JSON format across scripts and server-side components, making it possible to mix and match XML, plain text, and JSON requests and responses. The goal is flexibility, and you're well on your way to being able to put all these tools together, in almost any combination you can imagine.
Chapter 11
- Section 11.1 - Introduction
- Section 11.2 - JSON's real value
- Section 11.3 - Sending JSON in name/value pairs via GET
- Section 11.4 - POSTing JSON data
- Section 11.5 - Interpreting JSON on the server
- Section 11.6 - Conclusion
Section 11.1: Introduction
In the last chapter, you learned how to take an object in JavaScript and convert it into a JSON representation. That format is an easy one to use for sending (and receiving) data that maps to objects, or even arrays of objects. In this final chapter of this book, you'll learn how to handle data sent to a server in the JSON format and how to reply to scripts using the same format.
Section 11.2: JSON's real value
As discussed in the previous chapter, JSON is a useful format for Ajax applications because it allows you to convert between JavaScript objects and string values quickly. Because Ajax apps are best suited to send plain text to server-side programs and receive plain text in return, an API that generates text is almost always preferable over an API that doesn't; further, JSON allows you to work with native JavaScript objects and not worry about how those objects will be represented.
So the biggest value of JSON is that you can work with JavaScript as JavaScript, not as a data-format language. All the things you learn about using JavaScript objects can be applied to your code without worrying about how those objects will be converted to text. Then, you make a simple JSON method call, for example:
var myObjectInJSON = JSON.stringify(myObject);
and you're ready to send the resulting text onto a server.
The above example, 'myObject' is a Javascript array object.
Getting JSON to the server
Sending JSON to the server isn't particularly difficult, but it is crucial, and you still have a few choices to make. However, once you've already chosen to use JSON, the choices are a lot simpler and quite a bit more limited, so there's not as much to think or worry about. The bottom line is you just need to get your JSON string to the server, preferably as quickly and as simply as possible. For example:
// see url timeStamp explanation later near the end of chapter 11
let url = "/cgi-local/server.php?timeStamp=" + new Date().getTime();
request.open("POST", url, true);
request.setRequestHeader("Content-type", "application/x-www-form-urlencoded");
request.send("myObjectInJSON);
Section 11.3: Sending JSON in name/value pairs via GET
The easiest way to get your JSON data to the server is to convert it to text, and send it as the value of a name/value pair. Remember, your JSON-formatted data is just one fairly long object, and probably looks something like Listing 1:
Listing 1. A simple JavaScript object in JSON format
let people =
{
"programmer":
[
{ "firstName": "John", "lastName":"Doe", "email": "john@doe.com" },
{ "firstName": "Jane", "lastName":"Doe", "email": "jane@doe.com" },
{ "firstName": "Mary", "lastName":"Public", "email": "mary@abc.com" }
],
"author":
[
{ "firstName": "Isaac", "lastName": "Asimov", "genre": "science fiction" },
{ "firstName": "Tad", "lastName": "Williams", "genre": "fantasy" },
{ "firstName": "Frank", "lastName": "Peretti", "genre": "christian fiction" }
],
"musician":
[
{ "firstName": "Eric", "lastName": "Clapton", "instrument": "guitar" },
{ "firstName": "Sergei", "lastName": "Rachmaninoff", "instrument": "piano" }
]
};
|
So you could send this to a server-side script as a name/value pair like this:
let url = "organizePeople.php?people=" + JSON.stringify(people);
xmlHttp.open("GET", url, true);
xmlHttp.onreadystatechange = updatePage;
xmlHttp.send(null);
|
This looks good, but there's one problem: you've got spaces and all sorts of characters in your JSON data string that a Web browser might try and interpret. To ensure that these characters don't mess things up on the server (or in transmission of your data to the server), add in the JavaScript escape() function, like this:
let url = "organizePeople.php?people=" + escape(JSON.stringify(people));
request.open("GET", url, true);
request.onreadystatechange = updatePage;
request.send(null);
|
This function handles whitespace, slashes, and anything else that might trip up browsers and converts them to Web-safe characters (for example, an empty space is converted to %20, which browsers don't treat as a space but instead pass on to a server unchanged). Then servers will (generally automatically) convert these back to what they are supposed to be after transmission.
The downside to this approach is twofold:
1. You're sending potentially huge chunks of data using a GET request, which has a length limitation on the URL string. It's a big length, granted, but you never know how long an object's JSON string representation could get, especially if you're using pretty complex objects.
2. You're sending all your data across the network as clear text, which is about as unsecure as you can manage to get when it comes to sending data.
To be clear, these are both limitations of GET requests, rather than anything related to JSON data specifically. However, they're very real concerns when you're sending more than just a user's first or last name, or maybe selections on a form. Once you start to deal with anything that might be even remotely confidential, or extremely lengthy, then you should look at using POST requests.
Section 11.4: POSTing JSON data
When you decide you want to move to using a POST request for sending your JSON data to the server, you don't have to make a lot of code changes. Here's what you'd want:
let url = "organizePeople.php?timeStamp=" + new Date().getTime();
request.open("POST", url, true);
request.onreadystatechange = updatePage;
request.setRequestHeader("Content-Type", "application/x-www-form-urlencoded");
request.send(JSON.stringify(people));
|
Most of this code should be familiar to you from chapter 3, which focuses on sending POST requests. The request is opened using POST instead of GET, and the Content-Type header is set to let the server know what sort of data it should expect. In this case, that's application/x-www-form-urlencoded, which lets the server know you're just sending across text like it would get from a normal HTML form. You could also use "application/json" and it would work just fine.
send() contains the JSON strings 'people' converted to a JSON data format using the JSON string function stringify() to send it as a JSON string format.
One other quick note is that the URL has the current time appended to it. That ensures that the request isn't cached after it's sent the first time but is recreated and resent each time this method is called; the URL will be subtly different because of the changing time stamp. This is a common trick to ensure that POSTing to a script actually repeatedly generates a new request each time, and the Web browser doesn't try and cache responses from the server.JSON is just text
Whether you use GET or POST, the big deal here is that JSON is ultimately just text data. You can easily manipulate it and get it to the server because it doesn't require any special encoding, and every server-side script in the world can handle text data. If JSON were a binary format or had some strange textual encoding, that wouldn't be the case; as it is, though, JSON is just normal text data -- like a script would receive from a form submission, as you saw in the POST section and Content-Type header -- so you don't have a lot to worry about when sending it to a server.
Parsing JSON data structure.
By the way, did you see me mentioning somewhere either in this book or somewhere else that Javascript is the most difficult language of all the languages out there? Well, if you haven't seen my comment about how hard it is to master Javascript language, take this as a friendly warning. It is very hard to master all the nooks and crannies of Javascript language. It is very complex.
Sure a lot of programmers out there, including myself, don't know everything that Javscript has to offer; and therefore, they can get by just fine using what they already know and if you don't know what others know, it's not the end of the world. That's how I approach to learning Javascrdipt. Learn it little by little! And hey, if you don't know, then so beit!
Having said that, let's take just a fragment of the data structure in listing 1 and see what we can make sense of it.
// you can approach this as some sort of a multi-dimensional array
// it's an array that contains JSON objects
"programmer":
[
{ "firstName": "John", "lastName":"Doe", "email": "john@doe.com" },
{ "firstName": "Jane", "lastName":"Doe", "email": "jane@doe.com" },
{ "firstName": "Mary", "lastName":"Public", "email": "mary@abc.com" }
],
/**
* As you can see above, 'programmer' is the key and on the
* right side is the value of the array, in this case, square brackets [].
*
* But inside [] we have three array elements, and each array element is
* grouped by {}.
*
* So to acces the first element:
* { "firstName": "John", "lastName":"Doe", "email": "john@doe.com" }
* do this:
* programmer[0]
*
* To acces the second element:
* { "firstName": "Jane", "lastName":"Doe", "email": "jane@doe.com" }
* do this:
* programmer[1]
*
* To acces the third element:
* { "firstName": "Mary", "lastName":"Public", "email": "mary@abc.com" }
* do this:
* programmer[2]
*
* However, those three element contains an array of their own: this is called
* multi-dimensional array or array of arrays.
*
* So to access a multi-dimensional array, you could use a brute force like this:
*
* programmer[0].firstName // "John"
*
* programmer[0].lastName // "Doe"
*
* programmer[0].email // "john@doe.com"
*
* programmer[1].firstName // "Jane"
*
* programmer[1].lastName // "Doe"
*
* programmer[1].email // "jane@doe.com"
*
* programmer[2].firstName // "Mary"
*
* programmer[2].lastName // "Public"
*
* programmer[3].email // "mary@abc.com"
*
* Or you could use for() loops as in the following.
*
* Notice that for (i in ....)
* with i automatically initialized to 0 by default!
*/
Now that a partial illustration of JSON data structure has been explained, let's put the full data structure listed in listing 1 to work. It should be easy now. All the JSON data structure belong to a node called 'people' and we'll use for (... in ...) loop to iterate through this node:
document.write("<table width='100%'>
<tr>
<th>First Name</th>
<th>Last Name</th>
<th>Email</th>
</tr>");
// now iterate through JSON data structure in listing 2 with n = 0 by default
// when n = 0 it is pointing to 'programmer', n = 1 it is pointing to 'author',
// n = 2 it is pointing to 'musician'.
// notice that we're not doing anything through this loop.
// we're only running through the loop to allow the inner loop run its course.
for (n in peole)
{
// iterate through JSON data structure in listing 1 with i = 0 by default
for (i in people.programmer)
{
/**
* did I mentioned somewhere that Javascript language is the most difficult
* language out there?
*
* an example of that is right here where I try to make sense of the data
* structure sent as a JSON encoded data and trying to parse that data and
* iterate through for() loops to access the parsed data using Javascript.
*
* basically, I'm STUMP!!! and I gave up!!!
*
* I have no idea how to access the parsed JSON data structure.
*
* so I'll leave it to you as an exercise to do, and hopefully you know
* a better way of doing it than I do.
*/
// iterate through JSON data structure in listing 1 with inner loop
for (j = 0; j < 4; ++j)
{
if (j = 0)
{
if (i = 0)
{
/**
* when i = 0, and j = 0, firstName[0] = 'John'
*/
let firstName[i] = people.programmer[i].firstName[j];
}
else if (i = 1)
{
/**
* when i = 1, and j = 0, firstName[1] = 'Jane'
*/
let firstName[i] = people.programmer[i].firstName[j];
}
else if (i = 2)
{
/**
* when i = 2, and j = 0, firstName[2] = 'Mary'
*/
let firstName[i] = people.programmer[i].firstName[j];
}
}
else if (j = 1)
{
if (i = 0)
{
/**
* when i = 0, and j = 1, lastName[0] = 'Doe'
*/
let lastName[i] = people.programmer[i].latName[j];
}
else if (i = 1)
{
/**
* when i = 1, and j = 1, lastName[1] = 'Doe'
*/
let lastName[i] = people.programmer[i].lastName[j];
}
else if (i = 2)
{
/**
* when i = 2, and j = 1, lastName[2] = 'Public'
*/
let lastName[i] = people.programmer[i].lastName[j];
}
}
else if (j = 2)
{
if (i = 0)
{
/**
* when i = 0, and j = 2, email[0] = 'john@doe.com'
*/
let email[i] = people.programmer[i].email[j];
}
else if (i = 1)
{
/**
* when i = 1, and j = 2, email[1] = 'jane@doe.com'
*/
let email[i] = people.programmer[i].email[j];
}
else if (i = 2)
{
/**
* when i = 2, and j = 2, email[2] = 'mary@abc.com'
*/
let email[i] = people.programmer[i].email[j];
// I left out Joe Sixpack to save space!
}
} // end else if (j = 2)
} // end for (j = 0)
} // end for (i in ...)
/**
* now you have three arrays: firstName, lastName, email.
*
* and each array contains first names, last names, and emails for
* the three programmers.
*
* I hope you can make sense of it and can use it accordingly.
*
* I'll leave it as an exercise for you to do.
*
* below is my attempt to make use of the data.
* however, you might know a better way to do than this:
*/
document.write("<tr>");
// I could just as well use lastName.length or email.length. same result!
for (i = 0; i < firstName.length; ++i)
{
document.write("<td>" + firstName[i] + "</td>");
document.write("<td>" + lastName[i] + "</td>");
document.write("<td>" + email[i] + "</td>");
}
document.write("</tr>");
} // end for (n in ...)
document.write("</table>");
// the result from the above output looks like this:
First Name Last Name Email
---------- -------------- ---------------
John Doe john@doe.com
Jane Doe jane@doe.com
Mary Public mary@abc.com
Now despite my pre-emptive warning of how hard it is to program in Javascript, the above example doesn't seem that hard, or does it?
Anyhow, let's see another example of how to use complex JSON data structure similar to listing 1 but with some more arrays within the already existed arrays. In other words, it's the JSON objects mix with JSON arrays. But you can think of it as a multi-dimensional arrays. It is somewhat complex but not too complex.
Listing 2. A somewhat complex JavaScript object in JSON format
let dealer =
{
"name" : "John Doe",
"city" : "Miami",
"state" : "FL",
"inventory" :
[
{ "make" : "GM", "model" : ["Denali", "Yukon", "Sierra"], "color": "grey" },
{ "make" : "Ford", "model" : ["Focus", "F150": "Mustang" ], "color": "green" },
{ "make" : "Toyota", "model" : ["Corolla", "Tundra", "Teurcel"], "color": "blue" }
]
};
|
Now with the somewhat complex JSON data structure have been layout, we access it as in the following.
// to access the owner is easy using brute force:
dealer[0].name; // John Doe
dealer[0].city; // Miami
dealer[0].state; // FL
// notice that the array indexes always start with 0 pointing to
// the 1st element 'make', and iterating to 2nd element 'model', and third 'color'
// now iterate through JSON data structure in listing 2 with i = 0 by default
for (i in dealer.inventory)
{
// x = 'For GM:', 'For Ford: ', 'For Toyota:'
let x = "For " + dealer.inventory[i].make + ":";
// now iterate through JSON inner array data structure in listing 2
// as you can see, if you have other inner arrays, say color, you can
// actually make it as array of colors, i.e., red, white, blue, etc.
// or "color" : ["red", "white", "blue"] and iterate the same way as shown here.
// but instead of "model", use "color" in place. very easy!
for (j in dealer.inventory[i].model)
{
// you might find a more useful way to do with x, such as store it in a db
x += dealer.inventory[i].model[j];
document.write(x);
}
// the result from the above output looks like this:
For GM:
Denali
Yukon
Sierra
For Ford:
Focus
F150
Mustang
For Toyota:
Corolla
Tundra
Teurcel
I left out color in the above example, but you can handle it by yourself easily! With examples shown thus far, you can actually find your own unique ways to format your data structure and parse it accordingly in a more useful way. The possibilities are there for you to take advantage of using what already illustrated.
Section 11.5: Interpreting JSON on the serverOnce you've written your client-side JavaScript code, allowed your users to interact with your Web forms and pages, and gathered information that you need to send on to a server-side program for processing, you're to the point where the server becomes the major player in your application (and probably well into what we all think of as "Ajax applications," assuming you've made the call to the server-side program you're using asynchronous). It's here where the choices you made on the client, like using JavaScript objects and then converting them to JSON strings, must be matched by decisions on the server, like which API to use to decode your JSON data.
The JSON two-step
Working with JSON on the server side is essentially a two-step process, no matter what language you're using on the server:
1. Find a JSON parser/toolkit/helper API for the language you're using to write your server-side programs.
2. Use the JSON parser/toolkit/helper API to take the request data from the client and turn it into something your script can understand.
That's really all that there is to it. Let's take each step in a little more detail.
Find a JSON parser
The best resource for finding a JSON parser or toolkit is the JSON Web site (Google it). In addition to learning a lot about the format itself, this page has links to JSON tools and parsers for everything from ASP to Erlang to Pike to Ruby. Simply find the language your scripts are written in and download a toolkit. Drop that or expand that or install that (there's a lot of variability when you could be using C#, or PHP, or Lisp on the server) so that your scripts and programs on the server can use the toolkit.
For example, if you're using PHP, you could simply upgrade to PHP 5.2 and be done with it; this recent version of PHP includes the JSON extension by default. In fact, that's almost certainly the best way to handle JSON when you're working with PHP. If you're using Java servlets, the org.json package, hosted at json.org, is a simple choice. In this case, you'd download json.zip from the JSON Web site and add the included source files to your project's build directory. Compile these files, and you're ready to go. Similar steps hold true for the other languages supported; your own expertise using the language you prefer is the best guide.
Using your JSON parser
Once you've got the resources available to your program, it's just a matter of finding the right method to call. For example, suppose you were using the JSON-PHP module with PHP:
// This is just a code fragment from a larger PHP server-side script
require_once('JSON.php');
$json = new Services_JSON();
// accept POST data and decode it
$value = $json->decode($GLOBALS['HTTP_RAW_POST_DATA']);
Or here is a more elegant way of achieving the same result as above using PHP's built-in function called json_encode() and json_decode(). Furthermore, see "Bonus" section later for an even more elegant way of sending and receiving JSON data.
// accept POST from the client data and decode it using json_decode()
// assuming $json contains the raw POST data you got from the client, in which, encoded using json_encode()
$value = json_decode($json);
// Now work with $value as raw PHP
With that, you've got all the data -- array format, multiple rows, single values, whatever you stuffed into your JSON data structure -- into a native PHP format, in the $value variable. For more information, please check out this: Services-Json: Convert to and from JSON format in PHP
If you were using the org.json package in a servlet, you'd use something like this:
public void doPost(HttpServletRequest request, HttpServletResponse response)
throws ServletException, IOException
{
StringBuffer jb = new StringBuffer();
String line = null;
try
{
BufferedReader reader = request.getReader();
while ((line = reader.readLine()) != null)
jb.append(line);
}
catch (Exception e)
{
//report an error
}
try
{
JSONObject jsonObject = new JSONObject(jb.toString());
}
catch (ParseException e)
{
// crash and burn
throw new IOException("Error parsing JSON request string");
}
// Work with the data using methods like...
// int someInt = jsonObject.getInt("intParamName");
// String someString = jsonObject.getString("stringParamName");
// JSONObject nestedObj = jsonObject.getJSONObject("nestedObjName");
// JSONArray arr = jsonObject.getJSONArray("arrayParamName");
// etc...
}
|
You can refer to the org.json package documentation for more details by Googling it. (Note: If you want more detail on the org.json or other JSON toolkits, just Googling it!).
Bonus
The following are just end of book bonus materials to help you get some more ideas using JSON data structure.
The most popular method of sending/receiving resources to and from the server among the financial transactions (particularly credit card transactions) is CURL. Most of the payment providers (such as Visa, Mastercard, PayPal, Stripe, Authorize.NET, etc.) use CURL to send/receive resources to and from the server. And for that reason, we'll begin bonus section with CURL.
<?php
/**
* $Url = 'https://www.example.com/charge.php
*
* $param can be passed in from the caller as an array:
*
* [
* "amount" => $100.00,
* "currency" => "usd",
* "description" => "Customer order number: 12345",
* "customer" => customerID_12345
* ]
*/
public function request($Url, $param)
{
$curl = curl_init();
$opt = array();
if (count($param) > 0)
{
$field = array();
foreach ($param as $key => $value)
{
$field[] = $key . '=' . urlencode($value);
}
$postField = implode( $field, '&' );
$opt[CURLOPT_POST] = 1; // set CURLOPT_POST to 1 for 'POST'ing to the server
// Contains the associative array of the fields that we want to post.
// The array keys are named after the name of the form fields.
// CURLOPT_POSTFIELDS => $postField contains name/value pairs.
$opt[CURLOPT_POSTFIELDS] = $postField;
}
else
{
throw new Exception("Try to post data to server without data.");
}
// set CURLOPT_URL to the UTF8-encoded string
$opt[CURLOPT_URL] = utf8_encode($Url);
$opt[CURLOPT_RETURNTRANSFER] = true; // setting it to true enables it to return the response
$opt[CURLOPT_CONNECTTIMEOUT] = 30;
$opt[CURLOPT_TIMEOUT] = 80;
$opt[CURLOPT_RETURNTRANSFER] = true;
curl_setopt_array($curl, $opt);
// $result is the response from the server
// it will be returned to the caller as an array with $result is the first element,
// and the response code information in $code
$result = curl_exec($curl);
$errno = curl_errno($curl);
if (result === false)
{
$errno = curl_errno($curl);
$message = curl_error($curl);
curl_close($curl);
return array($message); // you need to output this error message in your calling code
}
// To get additional information about the request,
// we use the curl_getinfo($c, CURLINFO_HTTP_CODE) command that enables us to receive
// important technical information about the response,
// including the status code (200 for success) and the size of the downloaded file.
$code = curl_getinfo($curl, CURLINFO_HTTP_CODE);
curl_close($curl);
// $result is the response from the server
// it will be returned to the caller as an array with $result is the first element,
// and the response code information in $code
return array($result, $code);
}
?>
Once you send data to the server -- in other words, once you made a request to the server -- you need a server-side script like PHP to response to it and parse it and process it and then send back the response to the client.
If you look closely in the above example, it is a server-side language PHP acting as a client-side script using CURL to make a request to the server-side language, PHP in this case: charge.php.
PHP is sort of both a server-side and a client-side language -- making use CURL, which stands for "Client URL", as a client-side language.
Now the whole example above is a client-side script in PHP, making a request to a server-side language, also PHP in this case: charge.php.
Now you'll have to write your own PHP server-side language containing a script called charge.php and perform the necessary tasks according to your objective.
Next up is the client-server interaction that you'd learned throughout this book.
Here is an example of interacting with client and server scripts.
But first, let's create a server-side PHP script to send back data to the client-side Javascript.
File name: test.php.
<?php
// now create a PHP object containing data to send back to client script: Javascript
$myObj->name = "John Doe";
$myObj->email = "john@doe.com";
$myObj->occupation = "Programmer";
/**
* now format that data into a JSON data structure.
*
* notice that in PHP, you can just declare a variable and a property and use them
* together like above and it becomes an object.
*
* also, remember that JSON data structure in Javascript is slightly different than
* the one used by PHP, but they both are treated in the same manner.
*
* Okay, let's go on with PHP version of JSON data structure.
*
* below will encode the above PHP object into a JSON format that will look like the following:
*
* {"name" : "John Doe", "email" : "john@doe.com", "occupation" : "Programmer"}
*/
$myJSON = json_encode($myObj);
/**
* below will brute force send the encoded JSON data object ($myJSON) above to the client
*
* now the client can parse this encoded JSON data object using a function called parse()
* see the client script below on how to parse this encoded JSON data object ($myJSON)
*/
echo $myJSON;
?>
Now that we have a server-side script ready and waiting to response to the client-side script requesting data, we can go ahead and request data from the server. Here is a JavaScript on the client side, using an AJAX call to request a PHP file from the server containing a file called test.php in the example above. This should looks familiar to you from earlier chapters:
<script language="javascript" type="text/javascript">
/* Create a new XMLHttpRequest object to talk to the Web server */
var xmlHttp = false;
if (document.window.XMLHttpRequest)
{
//creating a non-MS browser object
xmlHttp = new XMLHttpRequest();
}
else if (document.window.ActiveXObject)
{
// this is the newer MS browser object and not even
// bother to test for older versions
xmlHttp = new ActiveXObject("Microsoft.XMLHTTP");
}
else
{
document.write("unknown browser");
}
if (!xmlHttp)
{
alert("Error initializing XMLHttpRequest!");
}
xmlhttp.onreadystatechange = function()
{
// object variable 'this' refers to an xmlHttpRequest object
// you could also just use the already initialized variable 'xmlhttp' object
if (this.readyState == 4 && this.status == 200)
{
var myObj = JSON.parse(this.responseText);
/**
* now variable myObj contains the decoded Javascript data object that looks
* like this:
*
* {"name" : "John Doe", "email" : "john@doe.com", "occupation" : "Programmer"}
*
* now that looks just like the encoded JSON data structure.
* yes, that is Javascript object.
*
* now you can access the decoded Javascript data object by referring to its
* object keys.
* for example: myObj.name, myObj.email, myObj.occupation, etc.
*
* below, assuming you have an HTML element that has an id attribute called "test",
* you can populate data like the following:
*/
document.getElementById("test").innerHTML = myObj.name;
}
};
// right here, we are requesting server-side script: test.php
// notice also that we're using GET instead of POST
// we're not sending anything to the server -- we're only requesting from the server
// if you want to use POST instead of GET it is very easy to modify.
// see earlier examples and as well as examples shown later!
// of course, the complete url is required for both "GET" and "POST", for example,
// if we have this: http://www.example.com/test.php
// open("GET", "http://www.example.com/test.php", true)
xmlhttp.open("GET", "test.php", true);
// after that, we can just go ahead and send the request to the server
xmlhttp.send();
</script>
PHP Array
As always when working with JSON and Javascript, whether with arrays or non-arrays, you need to make use of two special functions called parse() to parse the JSON encoded data structure and stringify() to convert the JavaScript object into JSON data structure. Please Google them to learn more about them. They are very powerful functions for using JSON data with Javascript language.
We can use arrays in PHP to convert to JSON data format as well by using PHP function json_encode():
File name: example.php.
<?php
// now create a PHP array object containing data to send back to client script: Javascript
$myArr = ["John Doe", "Jane Doe", "Mary Public", "Joe Sixpack"];
/**
* now after the below code is executed, the above data is converted into
* a JSON array data structure that looks like this:
*
* ["John Doe", "Jane Doe", "Mary Public", "Joe Sixpack"]
*
* as you can see, hardly any difference from the PHP array structure.
* nevertheless, it was a conversion from PHP data structure to a JSON data structure.
*/
$myJSON = json_encode($myArr);
/**
* the below code will brute force send the encoded JSON data object above to the client
*
* now the client can parse this encoded JSON data object using a function called parse()
* see the client script below on how to parse this encoded JSON data object
*/
echo $myJSON;
?>
Now all we have to do is make an AJAX call to request a PHP file from the server containing a file called example.php in the example above. This should looks like the following:
<script language="javascript" type="text/javascript">
/* Create a new XMLHttpRequest object to talk to the Web server */
var xmlHttp = false;
if (document.window.XMLHttpRequest)
{
//creating a non-MS browser object
xmlHttp = new XMLHttpRequest();
}
else if (document.window.ActiveXObject)
{
// this is the newer MS browser object and not even
// bother to test for older versions
xmlHttp = new ActiveXObject("Microsoft.XMLHTTP");
}
else
{
document.write("unknown browser");
}
if (!xmlHttp)
{
alert("Error initializing XMLHttpRequest!");
}
xmlhttp.onreadystatechange = function()
{
// object variable 'this' refers to an xmlHttpRequest object
// you could also just use the already initialized variable 'xmlhttp' object
if (this.readyState == 4 && this.status == 200)
{
var myObj = JSON.parse(this.responseText);
/**
* now variable myObj contains the decoded JSON array object.
* in other words, a PHP array object was converted/parsed to
* a JSON array object.
*
* remember that responseText contains a JSON array object
* that was converted from a PHP array object which looks like this:
*
* ["John Doe", "Jane Doe", "Mary Public", "Joe Sixpack"]
*
* so the PHP array object above is converted to this:
*
* ["John Doe", "Jane Doe", "Mary Public", "Joe Sixpack"]
*
* as you can see, hardly any difference at all between PHP and JSON
* array object.
*
* so responseText contains the latter JSON array object.
* and then myObj above was decoded using JSON.parse() to result
* in the following:
*
* ["John Doe", "Jane Doe", "Mary Public", "Joe Sixpack"]
*
* are you still with me? have I lost you? yes, the back and forth
* conversion is a dizzing matter! and the results look the same!
* so is there a need to convert from one language to the next?
*
* the answer is: yes!
* it has to do with the browser needing to know what kind of data
* it is transporting to and from the server.
*
* when using JSON.parse() on a JSON derived/converted data from
* an array, the method parse() will return a JavaScript array exactly
* as shown above, or i.e., myObj[0], myObj[1], myObj[2], etc.,
* instead of a JavaScript object like myObj.name, myObj.email, etc.
*
* pew!!! very dizzing to explain as well!
*
* now you can access the encoded JSON array data object by referring to its
* index keys. for example: myObj[0], myObj[1], myObj[2], etc.
*
* or specifically: myObj[0] = "John Doe", myObj[1] = "Jane Doe",
* myObj[2] = "Mary Public", myObj[3] = "Joe Sixpack"
*
* below, assuming you have an HTML element that has an id attribute
* called "example", you can populate data like the following:
*/
// will output 'Mary Public'
document.getElementById("example").innerHTML = myObj[2]; // myObj[2] = "Mary Public"
}
};
// right here, we are requesting server-side script: example.php
// notice also that we're using GET instead of POST.
// we're not sending anything to the server -- we're only requesting from the server
// of course, the complete url is required for both "GET" and "POST", for example,
// if we have this: http://www.example.com/example.php
// open("GET", "http://www.example.com/example.php", true)
xmlhttp.open("GET", "example.php", true);
// we can just send the request to the server.
// notice that 'null' is not needed: send(null)
xmlhttp.send();
</script>
PHP Database
PHP is a server side programming language, and can be used to access a database.
Imagine you have a database on your server, and you want to send a request to it from the client where you ask for the 10 first rows in a table called "customer".
On the client, make a JSON object that describes the name of the table, and the numbers of rows you want to return.
Before you send the request to the server, convert the JSON object into a string and send it as a parameter to the url of the PHP page using "GET". For example, use JSON.stringify() to convert the JavaScript object into JSON:
<script language="javascript" type="text/javascript">
/* Create a new XMLHttpRequest object to talk to the Web server */
var xmlHttp = false;
if (document.window.XMLHttpRequest)
{
//creating a non-MS browser object
xmlHttp = new XMLHttpRequest();
}
else if (document.window.ActiveXObject)
{
// this is the newer MS browser object and not even
// bother to test for older versions
xmlHttp = new ActiveXObject("Microsoft.XMLHTTP");
}
else
{
document.write("unknown browser");
}
if (!xmlHttp)
{
alert("Error initializing XMLHttpRequest!");
}
/* declare some object variables */
let obj = {"table" : "customer", "limit" : 10};
// you could format this as a valid url to use with POST instead of GET
var dbParam = JSON.stringify(obj);
xmlhttp.onreadystatechange = function()
{
// object variable 'this' refers to an xmlHttpRequest object
// you could also just use the already initialized variable 'xmlhttp' object
if (this.readyState == 4 && this.status == 200)
{
/**
* now assuming you have an HTML element that has an id attribute called "db",
* you can populate data like the following:
*/
document.getElementById("db").innerHTML = this.responseText);
}
/**
* now the JSON data (myObj) received from the PHP file looks like this:
*
* [
* { "name" : "John Doe" }, { "name" : "Jane Doe" },
* { "name" : "Mary Public" }, { "name" : "Joe Sixpack"}, {..... }
* ]
*
* of course, it was sent in a long string with no space between them; except,
* between first names and last names. self-explanatory!
*
* now you can access the above JSON data object by looping through the result.
* for example:
*
* convert the result received from the PHP file into a JavaScript object,
* or in this case, a JavaScript array using JSON.parse() to convert the JSON into
* a JavaScript object.
*
* of course, you need to prepare the xmlHttp variable before using it.
* when you get to the code that looks like the following, use a for() loop.
* self-explanatory!
*
* xmlhttp.onreadystatechange = function()
* {
* if (xmlhttp.readyState == 4 && this.status == 200)
* {
* var myObj = JSON.parse(xmlhttp.responseText);
* // right here where you convert the above JSON data into Javascript object
* for (x in myObj)
* {
* txt += myObj[x].name + "<br>";
* }
*
* //document.getElementById("db").innerHTML = txt;
* document.write(txt);
* }
* };
*
* the output data looks like the following:
*
* John Doe
* Jane Doe
* Mary Public
* Joe Sixpack
* ...
* ...
*/
};
// you could format it as a POST instead of GET and send it
// as a POST by removing a GET parameter
// of course, the complete url is required for both "GET" and "POST", for example,
// if we have this: http://www.example.com/db.php
// open("GET", "http://www.example.com/db.php?x=" + dbParam, true)
// right here, we are requesting server-side script: db.php
xmlhttp.open("GET", "db.php?x=" + dbParam, true);
// we can just send the request to the server.
// notice that 'null' is not needed: send(null)
xmlhttp.send();
</script>
Here is the PHP server-side script that responses to the client script above:
File name: db.php.
<?php
// tell the client we're sending a JSON data
header("Content-Type: application/json; charset=UTF-8");
// now retrieve an HTTP request using GET containing x
// and decode the JSON data structure into a PHP array object
$obj = json_decode($_GET["x"], false);
// now $obj contains this data: [ "table" => "customer", "limit" => 10 ]
// make sure you get proper connection parameters from your db hosting server
try
{
$conn = new PDO("mysql:host=$hostingserver;dbname=$databaseName",
$username, $password,);
}
catch (PDOException $e)
{
echo 'ERROR: Cannot connect to the server: ' . $e->getMessage();
}
try
{
$stmt = $conn->prepare("SELECT name FROM $obj->table LIMIT $obj->limit");
$result = $stmt->execute();
// another popular option is FETCH_OBJ
$output = $result->setFetchMode(PDO::FETCH_ASSOC);
// right here where we will brute force send the database data to the client.
// before we do that we need to format the data into a JSON data format:
echo json_encode($output);
// the rest are just optional illustrations
// right here, if you want to know how many rows selected
$rowcount = $result->rowCount();
if ($rowcount > 0)
{
// output # of rows selected
echo ($rowcount . ' rows');
}
// if you want to iterate through the $result
while ($row = $result->fetch())
{
$name = $row["name"];
echo $name;
}
}
catch (PDOException $e)
{
echo 'ERROR: Cannot retrieve data: ' . $e->getMessage();
}
?>
PHP POST Method
When sending data to the server, it is often best to use the HTTP POST method.
To send AJAX requests using the POST method, specify the method, and the correct header.
The data sent to the server must now be an argument to the send() method.
This should looks very familiar to you from earlier chapters:
File name: txt.js.
<script language="javascript" type="text/javascript">
/* Create a new XMLHttpRequest object to talk to the Web server */
var xmlHttp = false;
if (document.window.XMLHttpRequest)
{
//creating a non-MS browser object
xmlHttp = new XMLHttpRequest();
}
else if (document.window.ActiveXObject)
{
// this is the newer MS browser object and not even
// bother to test for older versions
xmlHttp = new ActiveXObject("Microsoft.XMLHTTP");
}
else
{
document.write("unknown browser");
}
if (!xmlHttp)
{
alert("Error initializing XMLHttpRequest!");
}
/* declare and initialize some object variables */
var obj, dbParam, xmlhttp, myObj, x, txt = "";
obj = {"table" : "customer", "limit" : 10};
dbParam = JSON.stringify(obj);
xmlhttp.onreadystatechange = function()
{
// object variable 'this' refers to an xmlHttpRequest object
// you could also just use the already initialized variable 'xmlhttp' object
if (this.readyState == 4 && this.status == 200)
{
myObj = JSON.parse(this.responseText);
for (x in myObj)
{
txt += myObj[x].name + "<br>";
}
/**
* now assuming you have an HTML element that has an id attribute called "txt",
* you can populate data like the following:
*/
document.getElementById("txt").innerHTML = txt);
}
/**
* now the JSON data (myObj) received from the PHP file looks like this:
*
* [
* { "name" : "John Doe" }, { "name" : "Jane Doe" },
* { "name" : "Mary Public" }, { "name" : "Joe Sixpack"}, {..... }
* ]
*
* of course, it was sent in a long string with no space between them; except,
* between first names and last names. self-explanatory!
*
* now you can access the above JSON data object by looping through the result.
* for example:
*
* convert the result received from the PHP file into a JavaScript object,
* or in this case, a JavaScript array using JSON.parse() to convert the JSON into
* a JavaScript object.
*
* of course, you need to prepare the xmlHttp variable before using it.
* when you get to the code that looks like the following, use a for() loop.
* self-explanatory!
*
* xmlhttp.onreadystatechange = function()
* {
* if (xmlhttp.readyState == 4 && this.status == 200)
* {
* var myObj = JSON.parse(xmlhttp.responseText);
* // right here where you convert the above JSON data into Javascript object
* for (x in myObj)
* {
* txt += myObj[x].name + "<br>";
* }
*
* //document.getElementById("txt").innerHTML = txt;
* document.write(txt);
* }
* };
*
* the output data looks like the following:
*
* John Doe
* Jane Doe
* Mary Public
* Joe Sixpack
* ...
* ...
*/
};
// right here, we are requesting server-side script: txt.php
xmlhttp.open("POST", "txt.php", true);
// of course, the complete url is required for both "GET" and "POST", for example,
// if we have this: http://www.example.com/txt.php
// open("POST", "http://www.example.com/txt.php", true)
// we need to prepare the header properly before sending a POST
xmlhttp.setRequestHeader("Content-type", "application/x-www-form-urlencoded");
// we can just send the request to the server. notice that instead of 'null', we are
// posting the long string to the server with a key/value pair, with x is the key.
xmlhttp.send("x=" + dbParam);
</script>
Here is the PHP server-side script that responses to the client POST script above. Notice that the only difference in the PHP file earlier that used a $_GET is the method for getting the transferred data.
Here, we use $_POST instead of $_GET.
File name: txt.php.
<?php
// tell the client we're sending a JSON data
header("Content-Type: application/json; charset=UTF-8");
// now retrieve an HTTP request using $_POST containing x
// and decode the JSON data structure into a PHP array object
$obj = json_decode($_POST["x"], false);
// now $obj contains this data: [ "table" => "customer", "limit" => 10 ]
// make sure you get proper connection parameters from your db hosting server
try
{
$conn = new PDO("mysql:host=$hostingserver;dbname=$databaseName",
$username, $password,);
}
catch (PDOException $e)
{
echo 'ERROR: Cannot connect to the server: ' . $e->getMessage();
}
try
{
$stmt = $conn->prepare("SELECT name FROM $obj->table LIMIT $obj->limit");
$result = $stmt->execute();
// another popular option is FETCH_OBJ
$output = $result->setFetchMode(PDO::FETCH_ASSOC);
// right here where we will brute force send the database data to the client.
// before we do that we need to format the data into a JSON data format:
echo json_encode($output);
}
catch (PDOException $e)
{
echo 'ERROR: Cannot retrieve data: ' . $e->getMessage();
}
?>
JSON Responses
In the previous examples, a client sends a request to the server requesting some sort of information. The client only specify the table name and how many rows to return: { "table" : "customer", "limit" : 10 }.
That is a typical client/server or request/response interaction where the client only specify some sort of initiation to illicit some response from the server. In an API request/response model a client supplies some sort of authentication to get access to the remote server's API and once the remote server verified that the client is authentic, then the server will allow the client to access the server's API content.
For this example, you could send some sort of keys or password to the server instead of the table name and how many rows to return and have the server response with some sort of API content, i.e., a list of customer purchasing record stored on the remote server's database.
As you should know by now that responding to clients using JSON data structure is the most convenient way to process in a request/response model. So with that said, the JSON response from the server should looks something like this:
{
"id": "ch_1GWkp92eZvKYlo2CCjEC8ayY",
"object": "charge",
"amount": 100,
"amount_refunded": 0,
"application": null,
"application_fee": null,
"application_fee_amount": null,
"balance_transaction": "txn_19XJJ02eZvKYlo2ClwuJ1rbA",
"billing_detail":
{
"address":
{
"city": null,
"country": null,
"line1": null,
"line2": null,
"postal_code": null,
"state": null
},
"email": null,
"name": null,
"phone": null
},
"calculated_statement_descriptor": null,
"captured": false,
"created": 1586617247,
"currency": "usd",
"customer": null,
"description": "My First Test Charge (created for API docs)",
"disputed": false,
"failure_code": null,
"failure_message": null,
"fraud_detail": {},
"invoice": null,
"livemode": false,
"metadata":
{
"order_id": "6735"
},
"on_behalf_of": null,
"order": null,
"outcome": null,
"paid": true,
"payment_intent": null,
"payment_method": "card_1ApdgS2eZvKYlo2CfPJz8TrR",
"payment_method_detail":
{
"card":
{
"brand": "visa",
"check":
{
"address_line1_check": null,
"address_postal_code_check": null,
"cvc_check": null
},
"country": "US",
"exp_month": 6,
"exp_year": 2020,
"fingerprint": "Xt5EWLLDS7FJjR1c",
"funding": "credit",
"installment": null,
"last4": "4242",
"network": "visa",
"three_d_secure": null,
"wallet": null
},
"type": "card"
},
"receipt_email": null,
"receipt_number": null,
"receipt_url": "https://pay.example.com/receipt/acct_1032D82eZvKYlo2Ckp92e",
"refund":
{
"object": "list",
"data": [],
"has_more": false,
"url": "/v1/charge/ch_1GWkp92eZvKYlo2CCjEC8ayY/refund"
},
"review": null,
"shipping": null,
"source_transfer": null,
"statement_descriptor": null,
"statement_descriptor_suffix": null,
"status": "succeeded",
"transfer_data": null,
"transfer_group": null
}
That is of course a JSON data structure containing nested objects. How you access these nested objects is up to you. Hopefully, the examples shown thus far should give you some ideas on how to go about in accessing these nested objects.
Hint: make use of the dot "." notation object reference, i.e., myJSONObject.billing_detail.address.city, myJSONObject.billing_detail.address.state, myJSONObject.billing_detail.address.postal_code, myJSONObject.billing_detail.address.email, etc.
In the case of PHP, use "->" notation to access objects, i.e., $myJSONObject->billing_detail->address->city, $myJSONObject->billing_detail->address->state, $myJSONObject->billing_detail->address->postal_code, $myJSONObject->billing_detail->address->email, etc.
JSON Files
A JSON file looks just like any other JSON data structure, except it is in a file with the extension of .json. JSON files are typically being used in configuration schemes. For example, you could store your website configuration scheme in a JSON file or files instead of in the inline code.
Let's see what a JSON file looks like and how to parse it using PHP.
File: config.json.
{
"site":
{
"URL": "http:\/\/www.example.com\/",
"SECURE": "0",
"HASH": "8e60cfb",
"INSTALLATION": "0",
"THEME": "basic",
"PAGE": "admin",
"SESSION_EXPIRE": "1800",
"LOGO": "http:\/\/www.example.com\/image\/logo.jpg",
"FOOTER": "All rights reserved | email: contact@example.com"
},
"db":
{
"DB_NAME": "dashboard",
"HOST": "sharedhostingserver.com",
"USERNAME": "root123",
"PASSWORD": "pass12345"
},
"content":
{
"DOWNLOAD": "dashboard",
"ADMIN": "rule",
"EMPLOYEE": "rule123",
"SENOR_DISCOUNT": "15% OFF"
},
"sale":
{
"DISCOUNT": "60% OFF",
"DATE_EFFECTIVE": "May 1 to May 31",
"ITEM": ["All Nike Sneakers", "Men's Trousers", "Women's Skirts",
"T-shirts", "Handbags", "Shorts", "Sunglasses"],
"LAY-A-WAY": ["Luggages", "Men's Khaki", "Women's Bras", "Kids' pants"]
},
}
Okay, to parse this JSON file, we'll have to use PHP functions file_get_contents() along with json_decode() in combination. For example, suppose that you have a main application class (typically called main controller class in an MVC scheme of thing), and you want to set the properties from the configuration file similar to the one listed above, you can do like this:
<?php
public function init()
{
// read the configuration file assuming config.json is in the same
// directory as the main application file.
// or else, specify the exact directory path of the json file.
// for example showing only on the right side part:
// json_decode(file_get_contents('http://www.example.com/home/config/config.json'))
$config = json_decode(file_get_contents('config.json'));
// so here, it iterates through the JSON data structure in config.json
// with the first key being "site", 2nd key being 'db', 3rd is 'content', etc.
foreach ($config as $property => &$value)
{
$this->$property = &$value;
}
// now the foreach() loop is just for simple data structure like 'site' where
// you have no inner arrays or arrays of arrays like 'sale'.
// a better solution is to seperate your JSON data in several files, with one
// file handling the trivial data structure like 'site', 'db', 'content', etc.,
// and another handling the arrays of arrays like 'sale'.
// and then you can load each file and perform the setting of properties accordingly.
}
/**
* now once all the configuration have setted, you can access those properties like this:
*
* somewhere in other classes, you can use this main application class at will if
* you extend your class or classes from this main application class. for example:
*
* $obj = new MainApplication();
*
* this is for 'site':
*
* $url = $obj->site->URL;
* $hash = $obj->site->HASH;
* $theme = $obj->site->THEME;
* $cookie = $obj->site->SESSION_EXPIRE;
* $footer = $obj->site->FOOTER;
*
* and likewise, for 'db':
*
* $dbname = $obj->db->DB_NAME;
* $host = $obj->db->HOST;
* $username = $obj->db->USERNAME;
* $password = $obj->db->PASSWORD;
*
* and likewise, for 'content':
*
* $download = $obj->content->DOWNLOAD;
* $admin = $obj->content->ADMIN;
* $employee = $obj->content->EMPLOYEE;
* $senor_discount = $obj->content->SENOR_DISCOUNT;
*
* and likewise, for 'sale':
*
* $discount = $obj->sale->DISCOUNT;
* $sale_date = $obj->sale->DATE_EFFECTIVE;
*
* you might find a more elegant way of doing than what is shown here!
*
* $shoe = $obj->sale->ITEM[0]; // 'All Nike Sneakers'
* $pant = $obj->sale->ITEM[1]; // 'Men's Trousers'
* $skit = $obj->sale->ITEM[2]; // 'Women's Skirts'
* $t-shirt = $obj->sale->ITEM[3]; // 'T-shirts'
* $bag = $obj->sale->ITEM[4]; // 'Handbags'
* $short = $obj->sale->ITEM[5]; // 'Shorts'
* $sunglass = $obj->sale->ITEM[6]; // 'Sunglasses'
* $luggage = $obj->sale->LAY-A-WAY[0]; // 'Luggages'
* $khaki = $obj->sale->LAY-A-WAY[1]; // 'Men's Khaki'
* $bra = $obj->sale->LAY-A-WAY[2]; // 'Women's Bras'
* $kid_pant = $obj->sale->LAY-A-WAY[3]; // 'Kids' pants'
?>
Now to change the content of the file, you can do it like this:
<?php
// you can call this function accordingly
public function update()
{
// read the configuration file assuming config.json is in the same
// directory as the main application file.
// or else, specify the exact directory path of the json file.
// for example showing only on the right side part:
// json_decode(file_get_contents('http://www.example.com/home/config/config.json'))
$config = json_decode(file_get_contents('config.json'));
$config->site->THEME = 'advanced';
$config->site->INSTALLATION = '1';
$config->content->SENOR_DISCOUNT = '30% OFF';
$config->sale->DATE_EFFECTIVE = 'July 1 to July 31;
$config->sale->DISCOUNT = '60% OFF';
$config->db->DB_NAME = 'new_name_123';
$config->db->HOST = 'new_host_123';
$config->db->USERNAME = 'new_username_123';
$config->db->PASSWORD = 'new_pass_123';
// with all the new content have been prepared, we now can save them in the file
// the following statement will effectively replace the existing content with the
// newly prepared content above
file_put_contents('config.json', json_encode($config, JSON_PRETTY_PRINT));
}
// notice that only the items that are setted will take effect.
// the rest of the content in the file are unchange!
// JSON files are very useful in retrieving/adding/changing data on the fly!
?>
As you can see, it is very powerful using JSON file data structure to store and retrieve for any kind of purposes, however, using it as a configuration is probably the most useful for JSON files.
JSON Comments
One last reminder about using JSON data structure is that it is not built for embedding comments in your JSON data structure; and therefore, comments in JSON data structure are to be avoided. However, you can still embedd your comments in your JSON data structure by using some hacks that people came up with. You'll have to search the Internet to find those hacks.
Before I dig into JSON files, let's clarify one issue that seems to get people confused, and that is, comments in a JSON data structure.
You can put comments on your JSON data structure, however, please be careful as JSON language is not meant to have a "dead" string language--meaning, a language that can ignore any string in data structure. JSON treats all strings as "live" data and parses them accordingly. Putting comments into your data structure can cause problems.
Think about it: if there are comments all over the JSON data structure, other languages would not be able to parse JSON data structure uniformly. JSON data structure is supposed to be language agnostic or neutral and if comments are put in the data structure, then how is one language suppose to differentiate and parse JSON data from another language?
This causes compatibility issue across languages that make use of the JSON data structure.
However, there are some hacks that people came up with for you to use to place comments in your JSON data structure. Here is one way of doing it:
Here is a hack found in the Google Firebase documentation that allows you to put comments in JSON:
{
"//": "Some browsers will use this to enable push notifications.",
"//": "It is the same for all projects, this is not your project's sender ID",
"gcm_sender_id": "1234567890"
}
Bottom line: Just to be on the safe side, don't use comments on your JSON data structure. If you need to, check out the Internet for more in dept discussions on this topic. I, personally, never use comments on my JSON data structure.
Section 11.6: Conclusion.You should have a handle now on how to deal with JSON from a technical standpoint on the server-side. This chapter, beyond just being technical assists, should also convince you that JSON is a pretty flexible, powerful data format. Even if it's not what you use on every application, good Ajax and JavaScript programmers should have JSON in their toolbox and be able to select it for use any time a need arises.
It has been a pleasure to write this book and this book was based on articles written by my fellow Twin Citian native Brett McLaughlin of Saint Paul, Minnesota.
Hope you enjoy the book--and happy learning!!!!
Software Engineer/Economist

Paul S. Tuon
(Born: Cambodia)
`~The engine of your inginuity is limited only to your imagination!!!~`
Take what you need! ~~~
Give what you can!!!

UX Engineer
Minneapolis, MN (US)
Attended: University of
Minnesota (Twin Cities)
Majored: Economics/Computer
Science

Some Programming Knowledge:
Java, Delphi, C#, Python, PHP, Node.js, JavaScript, jQuery, Ajax, MySQL, PDO, and of course, CSS.
I enjoy programming and it feels like a hobby to me.
It probably falls in both categories of programming and hobbies!!!
See hobbies category below.
Social media:
Occationally (but not actively) love going online and interacting with total strangers on social medias!
Sports:
Occationally, enjoy watching/playing soccer, and the World Cup.
I was a long time avid season-ticket holder of the Minnesota United Prefessional Soccer Team prior to Covid-19.
Here is a soccer play that you'll never never NEVER NEVER going to see it happen again!!!
I repeat: never never NEVER NEVER going to see it happen again!!!
It has to be my favorite play in any sport.
Of course, I'm bias toward soccer, but still it is incredible and amazing, considering the scoring improbability of the game of soccer.
Here is the story:
Soccer player scores from 110 yards, possibly breaking world record
On Saturday March 18, 2023, a goalie for a Chilean soccer team may have set a new world record when he kicked from his own goal area -- a distance of about 110 yards -- that resulted in a goal.
Leandro Requena, goalkeeper for Cobresal in the Chilean Football Federation, took a goal kick (from his own goal area) during the team's game against Colo-Colo and the ball sailed into the opposing team's goal.
An amazing feat and hilarious as well.
"I wanted to take the kick quickly as we have done so many times at altitude, to try to catch the rival off guard and it came out a little stronger than normal," Requena told Radio Bio Bio.
Team officials estimated the goal was kicked from a distance of about 110 yards. The current Guinness World Record for longest goal in a competitive soccer match is 105 yards and was set by British player Tom King in January 2021.
"I asked Juan Silva, the club's manager, if the request for the record application was really going to be made and he told me, 'Obviously yes,'" Requena said.
For those of you who are not familiar with the game of soccer, you'll notice that the opposing goalie tried to use his head to knock the ball away from the direction of the goal area.
This is because he was out of the goal zone/area and he could not use his hands to touch the ball.
If he had used his hands to touch any part of the ball, it would have been a goal penalty kick, which sure would have been a goal.
The goal happened in the 77th minute of the (90 minutes + stoppage time) game tallying the score to 3 - 0 in favor of the Cobresal.
But toward the end of the game Colo-Colo scored a meaningless goal as time was about to run out, making the final score 3 - 1 with the Cobresal winning the game easily.
Here is the video of the March 21, 2023 play:
Soccer player breaking world record on a goal
Here is the video of the play of Tom King in January 2021:
Tom King breaks longest goal world record at 96.01m (105 yards)
Stoppage time: In soccer, extra playing time is added at the discretion of the referee after regulation play (of 90 minutes) has ended to compensate for stoppages in play caused by injuries, substitutions, or other interruptions.
Remember that in soccer, the regulation time is 90 minutes only, but the clock keeps running from the start to the finish (of the 90 minutes), even when a ball is out of bound or when the game is not being actively played. This is idle time or wasted time because the clock just keeps running from the start to the finish.
To compensate for those loss time, a stoppage time is added to the regulation time of 90 minutes -- hence, 90 minutes + stoppage time.
The stoppage time is usually about 4 to 8 minutes, depending on the flow of the game.
Okay, let's continue on the topic of (my) Hobbies:
Also, I enjoy horseracing (watching/betting -
and sometimes too much betting!!! --
way too much!!!).
Love the Triple Crown/Breeders Cup races. They're awesome and exciting!

After high school we went our seperate ways, or more specifically she went her seperate way when she decided to go to college out west, while I stayed put and attended the University of Minnesota right here in the Twin Cities.
We lost contact and never heard from each other ever since.

After college (University of Minnesota) we decided to go our seperate ways (amicably) and never heard from each other ever since.
FIFA World Cup takes place every four year and is being played in the summer usually in the months of June and July.
The 2026 World Cup is scheduled to take place from June 8 through July 3 (2026).
Going forward FIFA World Cup had agreed that the number of games for the 2026 World Cup (and beyond) would increase and the format would change from the previous format of 16 groups of three teams to 12 groups of four teams.
So there will be 12 groups of four teams starting in the 2026 World Cup and beyond.
The new format will have 104 games played, up from the original 80.
The tournament starts off with each group plays each other in the group for three games each.
The point standings are determined from each game played with a win receiving 3 points, a tie receiving 1 point, and a loss receiving 0 point.
After each team played each other in the group three games, the final point standing in the group is determined.
The top two teams from each group will go through (or advanced to the next round), with the eight best third-place teams also advancing to the Round of 32.
The key phrase is "... eight best third-place teams ...."
In other words, eight best teams from the 12 groups whose records are not the top two from each group will also be advancing to the Round of 32.
This means that there are 32 teams [(12 x 2) plus 8] will advance to the next round -- the Round of 32.
The 2026 World Cup will take place in three North American countries: the United States, Mexico, and Canada.
Yes, that is right: three countries are set to host the 2026 World Cup.
This will be the first time that the tournament is hosted by three different nations and it will be the very first time that the event will be contested in Canada.
There will be a total of 16 venues used as host cities for the 2026 World Cup. The U.S. will have 11, Canada will have 2, and Mexico will have 3.
As stated earlier, starting in the 2026 World Cup there will be an expanded format featuring 48 teams split into 12 groups of 4 -- as opposed to prior format when there were also 48 (16 X 3) teams but were instead split into 16 groups of 3.
2026 World Cup host cities:
USA: 11
Atlanta: Mercedes-Benz Stadium
Boston: Gillette Stadium
Dallas: AT&T Stadium
Houston: NRG Stadium
Kansas City: Arrowhead Stadium
Los Angeles: SoFi Stadium
Miami: Hard Rock Stadium
New York/New Jersey: MetLife Stadium
Philadelphia: Lincoln Financial Field
San Francisco:Levi's Stadium
Seattle: Lumen Field
Wait a minute: Houston, Kansas City, and San Francisco?
What happen to the northern upper midwest cities like Cleveland, Detroit, Chicago, Minneapolis and Denver?
It would have been a great idea to leave out Houston, Kansas City, and San Francisco and put in the northern upper midwest cities like Cleveland, Detroit, Chicago, Minneapolis and Denver.
So take out Houston, Kansas City, and San Francisco and put in Chicago, Minneapolis, and Denver.
That would be great and I will camp out for the tickets (for sure).
Canada: 2
Toronto: BMO Field
Vancouver: BC Place
Mexico: 3
Guadalajara: Estadio Akron
Mexico City: Estadio Azteca
Monterrey: Estadio BBVA
The Group Stage
The four teams in each group will compete against each other in the round-robin group stage, and the standings are based on points gained from those matches.
Depending on the result of each group stage game, teams earn a certain number of points (3 points for a win, 1 point for a draw, 0 points for a loss).
After each team has played all three group stage matches, the two teams with the most points in each group will advance to the knockout rounds (beginning in round of 32), while the bottom two are eliminated..
If two or more teams are tied on the same number of points, a series of tiebreakers are used to determine which team will finish above the other(s) in the table.
If two or more teams are tied on the same number of points following the group stage, tiebreakers are first based on goal differential, which is a team's total goals scored minus their goals conceded.
If they are still tied, goals scored will determine who moves on.
If teams are still tied, head-to-head records will be used to decide which side progresses.
In the knockout stage (round 32), if two teams are tied after 90 minutes, two extra 15-minute periods are played. If the two teams are still tied, penalty kicks will be taken to determine the winner.
After the group stage, the tournament moves into the round of 32. From there, eight teams will compete in the quarterfinals, four in the semifinals and two in the final to crown a champion.
The runners-up of the semifinals will compete to determine the third-place winner.
FIFA Women's World Cup takes place every four year and is being played in the summer usually in the months of July and August.
The FIFA Women's World Cup will have a format featuring 32 (8 X 4) teams split into 8 groups of 4 team.
The 2023 FIFA Women's World Cup is scheduled to take place from July 20 through August 20 (2023).
Soccer (or Football) fans (as of this writing May 1, 2023) are counting down the days as Australia and New Zealand are set to become the first countries in the Southern Hemisphere to host the FIFA Women's World Cup.
Yes, you heard it right two countries: Australia and New Zealand.
This will be the first time that the tournament is hosted by two different nations.
The 2023 FIFA Women's World Cup is set to be held in the Oceanic regions of Australia and New Zealand, the competition will run from July 20, 2023 through to the final exactly a month later on August 20, 2023.
The first match will take place in New Zealand with Norway vs New Zealand on July 20, 2023.
The 2023 Women's World Cup tournament fever is most definitely kicking in as the opening kick approaches and fans couldn't be more excited.
As per reports, Organizers say they are on course to sell a record 1.5 million tickets.
Currently world champions USA find themselves in Group E along with the Netherlands, Portugal and Vietnam, while European champions England are in Group D alongside China, Denmark and Haiti.
The USA better watch out for the Netherlands, their main threat to upset in the group stage. The Netherlands is a very good team coming out of Group E.
The intercontinental qualification play-offs finished on 23 February 2023, and therefore all spaces in the final competition have now been finalized - with Haiti, Portugal and Panama securing the last three spots.
With all teams now confirmed, here are the finalized groups and schedule for the 2023 FIFA Women's World Cup.
FIFA Women's World Cup 2023 groups
Group A
New Zealand
Norway
Philippines
Switzerland
Group B
Australia
Canada
Nigeria
Republic of Ireland
Group C
Costa Rica
Japan
Spain
Zambia
Group D
China
Denmark
England
Haiti
Group E
Netherlands
Portugal
United States
Vietnam
Group F
Brazil
France
Jamaica
Panama
Group G
Argentina
Italy
South Africa
Sweden
Group H
Colombia
Germany
South Korea
Morocco
FIFA Women's World Cup 2023
Group Stages
Matchday One
Group A: Jul 20, 2023
New Zealand v Norway
Group A: Jul 21, 2023
Philippines v Switzerland
Group B: Jul 20, 2023
Australia v Republic of Ireland
Group B: Jul 20, 2023
Nigeria v Canada
Group C: Jul 21, 2023
Spain v Costa Rica
Group C: Jul 22, 2023
Zambia v Japan
Group D: Jul 22, 2023
England v Haiti
Group D: Jul 22, 2023
Denmark v China
Group E: Jul 22, 2023
United States v Vietnam
Group E: Jul 23, 2023
Netherlands v Portugal
Group F: Jul 23, 2023
France v Jamaica
Group F: Jul 24, 2023
Brazil v Panama
Group G: Jul 23, 2023
Sweden v South Africa
Group G: Jul 24, 2023
Italy v Argentina
Group H: Jul 24, 2023
Germany v Morocco
Group H: Jul 25, 2023
Colombia v South Korea
Matchday Two
Group A: 25 Jul, 2023
New Zealand v Philippines
Group A: 25 Jul, 2023
Switzerland v Norway
Group B: 26 Jul, 2023
Canada v Republic of Ireland
Group B: 27 Jul, 2023
Australia v Nigeria
Group C: 26 Jul, 2023
Spain v Zambia
Group C: 26 Jul, 2023
Japan v Costa Rica
Group D: 28 Jul, 2023
England v Denmark
Group D: 28 Jul, 2023
China v Haiti
Group E: 27 Jul, 2023
USA v Netherlands
Group E: 27 Jul, 2023
Portugal v Vietnam
Group G: 28 Jul, 2023
Argentina v South Africa
Group G: 29 Jul, 2023
Sweden v Italy
Group F: 29 Jul, 2023
France v Brazil
Group F: 29 Jul, 2023
Panama v Jamaica
Group H: 30 Jul, 2023
Germany v Colombia
Group H: 30 Jul, 2023
South Korea v Morocco
Matchday Three
Group A: 30 July, 2023
Norway v Philippines
Group A: 30 July, 2023
Switzerland v New Zealand
Group B: 31 July, 2023
Canada v Australia
Group B: 31 July, 2023
Republic of Ireland v Nigeria
Group C: 31 July, 2023
Japan v Spain
Group C: 31 July, 2023
Costa Rica v Zambia
Group D: 1 Aug, 2023
Haiti v Denmark
Group D: 1 Aug, 2023
China v England
Group E: 1 Aug 3:00pm ET (double check time)
Portugal v USA
Group E: 1 Aug, 2023
Vietnam v Netherlands
Group F: 2 Aug, 2023
Panama v France
Group F: 2 Aug, 2023
Jamaica v Brazil
Group G: 2 Aug, 2023
Africa v Italy
Group G: 2 Aug, 2023
Argentina v Sweden
Group H: 3 Aug, 2023
South Korea v Germany
Group H: 3 Aug, 2023
Morocco v Colombia
At this stage the group competion is completed and from here and on winner advances, loser goes home.
During the group competion, each team in the group play each other and earns points based on win or draw.
Depending on the result of each group stage game, teams earn a certain number of points (3 points for a win, 1 point for a draw, 0 points for a loss).
After each team has played all three group stage matches, the two teams with the most points in each group will advance to the knockout rounds (beginning in round of 16), while the bottom two are eliminated.
If two or more teams are tied on the same number of points, a series of tiebreakers are used to determine which team will finish above the other(s) in the table.
If two or more teams are tied on the same number of points following the group stage, the below criteria are used, in this order, to determine the rankings of those teams in their group:
1. Superior goal difference in all group matches
2. Greatest number of goals scored in all group matches
3. Greatest number of points obtained in the group matches between the teams concerned
4. Superior goal difference resulting from the group matches between the teams concerned
5. Greatest number of goals scored in all group matches between the teams concerned
6.Highest team conduct score relating to the number of yellow and red cards obtained***
7. Drawing of lots
***For tiebreaker #6 above (highest team conduct score), the team with the highest number of points after the group stage, based on the below criteria, shall be ranked highest:
Yellow card: minus 1 point
* Indirect red card (two yellows): minus 3 points. [An indirect red card is the result of two yellow cards and is equivalent to one red card.]
* Direct red card: minus 4 points
* Yellow card and direct red card: minus 5 points
Knockout stages
Round of 16
(win advance, lose go home)
Group A: 5 Aug, 2023
Group A Winner v Group C Runner-up
Group B: 7 Aug, 2023
Group B Winner v Group D Runner-up
Group C: 5 Aug, 2023
Group C Winner v Group A Runner-up
Group D: 7 Aug, 2023
Group D Winner v Group B Runner-up
Group E: 6 Aug, 2023
Group E Winner v Group G Runner-up
Group F: 8 Aug, 2023
Group G: 6 Aug, 2023
Group G Winner v Group E Runner-up
Group H: 8 Aug, 2023
Group H Winner v Group F Runner-up
Quarter Finals
(8 winners of round 16 advance)
Aug 10 - 12, 2023
The 8 teams remaining will pair up to eliminate each other (win advance, lose go home).
Semi-Finals
Aug 15 - 16, 2023
The 4 teams remaining will pair up to eliminate each other.
The Final
The winners of each semi-final will face off in the FIFA Women's World Cup final on Sunday August 20, 2023 at Stadium Australia, Sydney.
The runners-up of each semi-final will play each other the day before on Saturday August 19, 2023, in Brisbane Stadium to battle it out for third place.
Where to watch FIFA Women's World Cup 2023?
In the USA, Fox will be airing all games on its main channel as well as Fox Sports.
FIFA U-20 World Cup (Young Men's) 2023
The FIFA U-20 World Cup is the biennial (every two years) football (soccer) world championship tournament for FIFA members’ men's national teams with players under the age of 20; hence, the U-20.
Argentina have been selected to host the 2023 FIFA Under-20 World Cup.
The tournament is to take place between May 20 and June 11 (2023) in Argentina.
The FIFA U-20 World Cup 2023 consists of six groups: A, B, C, D, E, and F.
The top two teams from each of the six groups will advance to the last 16 (or Round 16), as well as the four best third-placed teams.
Let's do the math: 16 teams (6 groups multiply by top 2 teams plus 4 third-placed teams) will advance to the last 16 (or Round 16).
That is a total of 16 teams that will advance to the knockout round.
But first, here are the six groups:
Group A
Argentina
Uzbekistan
Guatemala
New Zealand
Group B
USA
Ecuador
Fiji
Slovakia
Group C
Senegal
Japan
Israel
Columbia
Group D
Italy
Brazil
Nigeria
Dominican Republic
Group E
Uruguay
Iraq
England
Tunisia
Group F
France
Korea Republic
Gambia
Honduras
Group Stage Begins
Each team plays each other in the group three times to determine the top two in the standing.
The top two teams in the group will advance to the next round, which is round 16.
Group Stage Game One
Saturday, 20 May:
Group A: Argentina vs Uzebistan
Group A: Guatemala vs New Zealand
Group B: United States vs Ecuador
Group B: Fiji vs Slovakia
Sunday, 21 May:
Group C: Senegal vs Japan
Group C: Israel vs Colombia
Group D: Italy vs Brazil
Group D: Nigeria vs Dominican Republic
Monday, 22 May:
Group E: Uruguay vs Iraq
Group E: England vs Tunisia
Group F: France vs Republic of Korea
Group F: Gambia vs Honduras
Group Stage Game Two
Tuesday, 23 May:
Group A: Argentina vs Guatemala
Group A: New Zealand vs Uzbekistan
Group B: United States vs Fiji
Group B: Slovakia vs Ecuador
Wednesday, 24 May:
Group C: Senegal vs Israel
Group C: Colombia vs Japan
Group D: Italy vs Nigeria
Group D: Dominican Republic vs Brazil
Thursday, 25 May:
Group E: Uruguay vs England
Group E: Tunisia vs Iraq
Group F: France vs Gambia
Group F: Honduras vs Republic of Korea
Group Stage Game Three
Friday, 26 May 2023:
Group A: New Zealand vs Argentina
Group A: Uzbekistan vs Guatemala
Group B: Slovakia vs United States
Group B: Ecuador vs Fiji
Saturday, 27 May:
Group C: Colombia vs Senegal
Group C: Japan vs Israel
Group D: Dominican Republic vs Italy
Group D: Brazil vs Nigeria
Sunday, 28 May:
Group E: Tunisia vs Uruguay
Group E: Iraq vs England
Group F: Honduras vs France
Group F: Republic of Korea vs Gambia
The Knockout stages
After the group stage the knockout stages begin in the round of 16 and continues to the final.
In the knockout stages in any match a winner advances, loser goes home.
30 May - 1 June: Round of 16
3 - 4 June: Quarter-finals
8 June: Semi-finals
11 June: FIFA U-20 World Cup 2023 Final
FIFA U-20 (Young Women's) World Cup 2024
The FIFA U-20 Women's World Cup is a biennial event (or takes place every two years) for women's national teams with players under the age of 20.
Costa Rica hosted the 2022 FIFA Under-20 (Young Women's) World Cup, in which, Spain had won the Cup.
The next FIFA U-20 Women's World Cup event will take place in 2024.
What does MLS mean in soccer teams in the U.S.?
MLS is an acronym for Major League Soccer.
Major League Soccer is a men's professional soccer league sanctioned by the United States Soccer Federation, which represents the sport's highest level in the United States.
The league comprises 29 teams -- 26 in the U.S. and 3 in Canada.
MLS is currently at 29 teams with the league aiming to reach 30 teams through expansion with bids from Las Vegas, San Diego, and Phoenix under consideration.
The league is headquartered in Midtown Manhattan (New York).
The MLS is divided into two conferences:
The Western Conference and the Eastern Conference.
Note: Some teams have "FC" attached to their names -- with "FC" stands for Football Club -- with "F" an apparent link to a soccer term known throughout the world: Football.
However, Miami's soccer team is called Inter Miami CF and not Inter Miami FC.
Make note of the placing of the letters: "CF" -- not "FC".
But why?
The name derives and originates from South America and it was called Club Internacional de Futbol Miami (in Spanish South America).
However, in North America it is known as Inter Miami CF or simply Inter Miami -- an American professional soccer club based in the Miami metropolitan area.
Likewise, the Montreal soccer team has a "CF" attached to its name as well.
The club's name is Club de Foot Montreal (in French) -- hence, "CF".
On the other hand, the Nashville, the Orlando City, and the St. Louis City soccer teams have an "SC" attached to their names.
The "SC" stands for Soccer Club.
The Eastern Conference
- Atlanta United FC
- Charlotte FC
- Chicago Fire FC
- FC Cincinnati
- Columbus Crew
- D.C. United
- Inter Miami CF
- CF Montreal
- Nashville SC
- New England Revolution
- New York City FC
- New York Red Bulls
- Orlando City SC
- Philadelphia Union
- Toronto FC
Note: New York has two teams.
The Western Conference
- Austin FC
- Colorado Rapids
- FC Dallas
- Houston Dynamo FC
- Sporting Kansas City
- LA FC
- LA Galaxy
- Minnesota United (Loons) FC
- Portland Timbers
- Real Salt Lake
- San Jose Earthquakes
- Seattle Sounders FC
- St. Louis City SC
- Vancouver Whitecaps FC
Note: LA has two teams.
MLS Regular Season
For 2023 season, MLS teams play 34-match regular season from February to October with 18 of the 29 clubs (the top nine from each of the Eastern and Western conference) advancing to the playoffs at season's end.
Beyond 2023, MLS teams probably will still play 34-match regular season (as well) from February to October. [Please stay tuned.]
How many games does each team play?
Each season every team plays 17 games at home and 17 away, for a total of 34 regular season games.
All teams play everyone in their respective Conference twice - one at home and one away - and an additional eight matches against teams in the other Conference.
This is similar to an NFL season where all teams play everyone in their respective Division twice - one at home and one away - and play some additional games against teams in other Conference/Divisions.
The team that accrues the most regular season points across both Conferences is awarded the Supporters Shield, and the best performers progress to MLS Cup Playoffs...
Points Standing
How do points standings are calculated?
Each team play 34 games in a season and earns points based on win or draw.
Depending on the result of each game, teams earn a certain number of points (3 points for a win, 1 point for a draw, 0 points for a loss).
Throughtout the season (from start to finish), team standing is calculated based on points earned (and tallied/totalled) after each game played.
In other words, throughtout the season (from start to finish), you can find out about your team's standing - how your team fare against other team in the Conference.
New 2023 MLS playoff format
The new postseason format for 2023 is explained below.
The new postseason format for 2023 consists of nine teams from each conference that will reach the postseason, with seeds Nos. 1-7 earning a pass to the first round proper (or bye), while seeds No. 8 and No. 9 contest a one-off wild card match to fill the seed No. 8.
That is nine teams from each conference who qualify for the playoff.
Now that the No. 8 seed is filled (after the wild card contest), the division playoff can begin.
There are eight teams from each conference for the division playoff.
Once the first round is set with 16 total clubs (eight in each conference), the (division) playoffs will begin in earnest.
In the past, teams played a single-elimination knockout bracket to decide a champion.
This year (2023 and most likely beyond as well), the first round will be a 'Best-of-three' series that features no draws, meaning a winner must be determined in each of the maximum three matches.
This is similar to how World Cups play their initial group stage.
They play each other three games to determine who comes out of the series.
The first team to notch two victories will advance.
From that point, the playoffs will resume with single-elimination format in the traditional style from the conference semifinals, conference finals, and MLS Cup final.
In other words, from this point on this is a knockout round.
The last team standing at the end of the knockout (round) bracket wins MLS Cup and is generally considered the MLS champion.
Last year's MLS Cup winner was LAFC, who also won the Supporters' Shield.
That feat - winning the two major league titles for both the regular season and postseason - is actually quite rare.
In fact, last year marked just the eighth time since the league was founded in 1996 that the MLS Cup champion was also the Supporters' Shield winner.
2023 MLS Roster Composition
A Major League Soccer club's active roster is comprised of up to 30 players. All 30 players are eligible for selection to the game-day squad during the regular season and playoffs.
In addition to the Salary Budget, each MLS club may spend additional funds on player compensation including money from a League-wide allocation pool (General Allocation Money), discretionary amounts of Targeted Allocation Money, the cost of Designated Players outside the Salary Budget, the cost of U22 Initiative Slots outside the Salary Budget, and money spent on the Supplemental Roster (roster slots 21-30).
Senior Roster
Up to 20 players, occupying roster slots 1-20, count against the club's 2023 Salary Budget of $5,210,000 and are referred to collectively as the club's Senior Roster.
Clubs are not required to fill roster slots 19 and 20, and clubs may spread their entire Salary Budget across 18 Senior Roster Players.
A minimum Salary Budget Charge will be imputed against a club's Salary Budget for each unfilled Senior Roster slot below 18.
A club may have no more than 20 players on its Senior Roster, subject to the Season-Ending Injury, Injured List, and Loan exceptions. The Maximum Salary Budget Charge for a single player is $651,250.
MLS (Championship) Cup Playoffs
When do MLS (Championship) Cup Playoffs take place?
MLS Cup Playoffs typically run through November and December (annually).
For more inforamtion about MLS playoffs format, see MLS Cup Playoffs Format
For everything about MLS, see Major League Soccer
The NWSL
The National Women's Soccer League is a professional women's soccer league at the top of the United States league system.
Headquartered in New York City, it is owned by the teams and, until 2020, was under a management contract with the United States Soccer Federation.
The National Women's Soccer League (NWSL) is a twelve-team Division-I women's professional soccer league featuring national team players from around the world.
The NWSL consists of two conferences: Eastern Conference and Western Conference.
The Eastern Conference (six teams as of 2023)
- Chicago Red Stars
- NJ/NY Gotham FC
- North Carolina Courage
- Orlando Pride
- Racing Louisville FC
- Washington Spirit
The Western Conference (six teams as of 2023)
- Angel City FC
- Houston Dash
- Kansas City Current
- Portland Thorns FC
- Seatle Olympique Lyonnais Reign
- San Diego Wave FC
Note: The Seatle team name is Olympique Lyonnais Reign, which derived from French words meaning Lion Kingdom.
Soccer Formation
The game of soccer consists of 11 players each, including the goalie (*).
The basic formation looks like this:
* * * *
* *
* * * *
*
Explanation
Forwards and wings: Top row.
Up front consists of 4 players called the forwards and wings:
The left wing, the left forward, the right forward, and the right wing.
Basically, the 4 up front players are lining up in a row from left to right in a straight line next to each other.
These 4 players are usually goal scorers.
And each of the 4 up front players are mainly covering/playing his/her own forward and wing area.
Mid-fielders: Middle row (or second row).
Mid-fielders consist of 2 players (sometimes 3 or 4 players depending on the strategies the coach or manager is employing.)
If the strategy is for 2 mid-fielders, which is very common, there would be a left mid-fielder and a right mid-fielder.
Basically, the 2 players are lining up in a row from left to right in a straight line next to each other.
The left mid-fielder is mainly covering/playing the left half of the mid-field area.
And the right mid-fielder is mainly covering/playing the right half of the mid-field area.
If the strategy is for 3 players, which is also very common, there would be a left (wing) mid-fielder, a center mid-fielder, and a right (wing) mid-fielder.
Basically, the 3 players are lining up in a row from left to right in a straight line next to each other.
And each of the 3 mid-fielders is mainly covering/playing his/her own mid-field area.
If the strategy is for 4 mid-fielders, which is NOT very common, there would be a left wing mid-fielder, a right wing mid-fielder, and two center mid-fielders, with the 4 mid-fielders lining up in a row from left to right in a straight line next to each other.
And each of the 4 mid-fielders covering/playing his/her own mid-field area.
Defenders: Last row (or bottom row).
Defenders consist of 4 players.
The left wing defender, the two middle defenders, and the right wing defender.
Basically, the 4 defense players are lining up in a row from left to right in a straight line next to each other.
And each of the 4 defense players is mainly covering/playing his/her own defending area.
Goal Keeper:
The last of the soccer formation is the goal keeper (also known as the goalie).
The goalie can use his/her hands in his/her own goal area only.
Outside of the goal area there will be a goal penalty kick if he/she uses his/her hands to touch any part of the ball.
Mid-fielders Explanation:
If the strategy is for 3 or 4 mid-fielders, the one or two extra players needed would have to come from either the two wing up front players or two defenders; or a combination of the defender and/or wing players.
Conclusion
That is the basic universally employed soccer formation.
Of course, that basic soccer formation will get thrown out completely once the game gets out of hand and/or requires a change in strategy.
Not only that, some leagues or individual teams throughout the world utilizes many formations from game to game -- even within the single game itself due to the flow of the game that requires a change in strategy.
However, the basic universally employed soccer formation shown earlier is the official backbone soccer formation.
Here is a soccer formation utilizes by the Saudi Soccer League and as well as the European Soccer Leagues (i.e., the Premier League, Spanish soccer league La Liga, the German soccer league BundesLiga, just to name a few).
The frontline (top row) consists of two forward players Ronaldo and Benzema:
Note that the frontline (top row above) and the first tier midfielders (2nd row above) are the primary goal scorers.
Here is the complete formation:
As you can see from the illustration above, the frontline (top row) consists of two forward players (Ronaldo and Benzema) but no left wing and right wing players.
The two wing players are pulled back to help midfielders and become first tier midfielders of three players.
The universally adopted (regular) formation of the midfielders is still the same with two players behind the first tier midfielders (of three players).
This creates a two-tier midfielders: 3 players upfront as the first tier; 2 players (behind) as the second tier midfielders.
This is known as 2-3-2 formation or just 2-3-2.
But the defend line is reduced to three players (bottom row) because one of its player is moved up one slot to be one of the two second tier midfielders.
Here are more soccer formations utilized by Australia -- along with England and Spain when they played against each other in the FIFA 2023 Women's World Cup Final.
Spain used a 4-4-2 formation or just 4-4-2.
That is four defenders, four midfielders and two forwards (a total of 10). Of course, the goalie is not factored into the soccer formation for this illustration.
For England, it's a 3-4-1-2 formation or just 3-4-1-2.
This means three defenders (very confident in their defensive line), four (second tier) midfielders, one (first tier) midfielder and two forwards (a total of 10). Of course, the goalie is not factored into the soccer formation for this illustration.
Australia used a 4-4-2 formation, too, in a (1 - 3) loss to England in the semifinal game that sent England to the FIFA 2023 Women's World Cup Final.
Here is Australia's 4-4-2 formation:
What Is A Substitution In Soccer?
In soccer, a substitution is the act of replacing one player with another during the course of a match.
Generally speaking, substitutions are allowed at any time during the game.
However, there are specific rules governing when and how 'subs' can be made.
Some of these rules are applicable to the sport at all levels (from youth soccer to professional soccer), and some are specific to the league or level of play.
Most youth soccer leagues and many amateur soccer leagues utilize a 'rolling subs' rule.
This essentially means you can make any number of substitutions and players are free to substitute in and out of the game as often as desired.
In contrast, in professional soccer leagues, each team is only permitted to make a certain number of substitutions per game.
As of 2023 the number of substitutions allowed in most competitions is 5 per game (an increase from 3 to 5 from prior years).
Many coaches have welcomed the additional flexibility and tactical options the change has afforded them.
What Are The Soccer Substitution Rules?
We won't focus rules for any other levels other than only for professional and World Cup levels.
So no youth and amateur soccer rules being discussed here.
However, the following rules apply to all soccer games regardless of the level of play (including World Cup levels):
- Substitutions can only be made during a stoppage in play, such as after a goal is scored, when the ball goes out of bounds, or when a player is injured.
- The substitute is not allowed to enter the field of play until the player being replaced has left, and the referee has signaled for the substitution to take place.
- The substitute must enter the field of play from the designated substitution zone. This is usually located near the halfway line on the touchline.
- If a player is substituted off and then re-enters the field of play without the permission of the referee, the player can be penalized with either a yellow or a red card.
Again, the following rules apply to only for professional and World Cup levels.
How Many Substitutions Can A Team Make During A Game?
As stated above (as of 2023 and beyond), a professional team can make substitutions up to 5 per game.
In certain competitions (such as the World Cup - as of 2023 and beyond), teams are permitted to make an additional substitution in extra time. So it is 6 per game.
Can You Substitute A Substitute In Soccer?
Yes! As long as a coach has not used their maximum amount of substitutions, they can replace any of the players on the field regardless of whether that player started the game or previously came on as a substitute themself.
Can A Team Make A Substitution While They Are in Possession Of The Ball?
No, substitutions can only be made during a stoppage in play.
This means the team must wait until the ball has gone out of bounds, a goal has been scored, or the referee has stopped play for another reason (e.g., an injured player).
Of course, a team can choose to kick the ball out of bounds themselves to create a substitution opportunity if they so wish!
Can A Player Be Substituted Off If They Are Shown A Yellow Or Red Card?
There are no restrictions on substituting a player who has received a yellow card.
However, a player who has received a red card must leave the field of play immediately and may not be replaced by another player.
What Happens If A Team Decides To Cancel A Substitution?
Once a player has entered the field of play, the substitution is considered complete. If the coach subsequently wants to take that player off, they must use another substitute to replace them.
Yes, even professional teams make mistakes from time to time and make some ill-advised substitutions and change their mind and forced to make another substitution, wasting valuable substitution usage.
What are yellow and red cards in soccer?
Soccer referees use yellow and red cards to communicate with players and manage the game.
A yellow card is typically shown for minor offenses, while a red card indicates more serious infractions and reckless fouls that warrant immediate dismissal from the game.
A yellow card means a player has received a warning regarding their conduct during the match. Both color cards provide clear instructions to players as to what actions may result in being shown one.
A red card in soccer results in an ejection from the game, while a yellow card is a warning to the player that they are in danger of being ejected.
A player receives a red card after receiving two yellow cards, or if the referee believes that the player has committed a serious infraction (like punching another player).
Once a player receives a red card, they must leave the field of play and cannot be replaced by another player on their team.
Yellow cards are for less serious infractions, such as persistent fouling or delaying the restart of play.
If a player receives two yellow cards in the same game, they are automatically shown a red card and ejected from the game.
Yellow Card Rules
When are yellow cards used in soccer?
Referees typically use yellow cards to warn players against committing certain offenses (e.g., unsportsmanlike conduct).
Yellow cards can be given for a variety of infractions, including:
- Delaying the start or restart of play
- Persistent fouling or breaking the rules of fair play
- Intentionally kicking or tripping another player
- Displaying unsportsmanlike behavior
- Lack of respect
- Trying to score with a handball attempt
- Showing dissent by word or action, such as arguing with the referee's decision
- Entering or deliberately leaving the field of play without the referee's permission
- Failing to observe the required distance during a free kick or throw-in
- You may also notice the referee writing down the player's number on a yellow card when they receive a caution.
- This is to keep track of how many times a player is cautioned during the match.
- Yellow cards are used to maintain fair play and sportsmanship in soccer and should be taken seriously by all players.
- Violently striking or attempting to strike an opposing player
- Using offensive, insulting, or abusive language or gestures toward other players, referees, or fans
- Deliberately and maliciously preventing the opposition from restarting play following a goal
- Committing serious foul play or violent conduct
- Spitting on an opponent
- Denying the opposing team a goal or an obvious goal-scoring opportunity by deliberately handling the ball
- Receiving a second yellow card in the same game
How long does a yellow card stay with you in soccer?
During a soccer game, a yellow card stays with you until the end of the game.
Remember, a second yellow card in the same game results in a red card and immediate dismissal from the field.
Once the game is over, there is no official rule regarding how accumulated yellow cards are treated.
However, in some leagues, players can be punished for the yellow cards they accumulate through their games.
In the MLS, yellow cards accumulated during the regular season don't carry over to the MLS Cup.
In La Liga competitions like the Copa del Rey, yellow cards outside the competition don't count toward the five-card regulation.
Other leagues have their own sets of rules regarding yellow and red cards, and some may not have penalties for accumulated yellow cards at all.
For all leagues yellow cards do not carry over into the next season.
How many games do you miss for 2 yellow cards?
The answer to this depends on the specific league and its rules regarding yellow card offenses.
For example, two yellow cards in two consecutive soccer matches mean a player will be suspended for the next match.
How many yellow cards can a soccer player get?
While you can only get two yellow cards in a single game before receiving a red card and being ejected from the field, there is no specific limit to how many yellow cards you can get over the course of your soccer career.
Spanish defender Sergio Ramos holds the record for most yellow cards, with an astonishing 262 accumulated cards throughout his career.
Red Card Rules
When are red cards used in soccer?
Referees typically use red cards to punish serious infractions, such as intentionally committing violent acts against another player on the field.
Remember that two yellow cards result in an automatic red card or if the referee believes that the player has committed a particularly serious offense against another player or the rules of the game.
According to soccer rules, some examples of acts that can result in a red card include the following:
How many red cards can a team get in a game?
A maximum of four players can leave a match due to red cards.
In other words, the team with a red card must play one player short; two red cards 2 players short ; three red cards 3 players short, etc., (this is similar to shorthand play in hockey).
If a fifth player is shown a red card, the referee ends the game immediately and the offending team is forced to forfeit the rest of the game.
How red cards apply to goalkeeper in a game?
The goalkeeper is treated as any other ordinary player on the field, except having the priviledge of using his/her hands to touch the ball in the goal zone/area (only).
This means that a goalkeeper can receive a yellow card and/or a red card just like any other players on the field.
If a goalkeeper receives a red card, they are dismissed just like any other players on the field.
The team is then reduced to 10 players, and the coach must call on a substitute goalkeeper to replace the dismissed one.
Red Cards and Fines
A red card means an immediate sending-off from the field, with no substitute allowed.
The team with a red card must play 10 against 11 for the rest of the game.
This can have a huge impact on a game, as the team must now play with fewer players.
Players can also be fined for red card offenses.
While there is no universal rule regarding fining players, many soccer clubs charge fines for red cards.
How many soccer games do you miss after a red card?
Usually, a red card results in a one-match suspension when players receive a red card after a second yellow card.
Depending on the circumstances and severity of the offense, a player who receives a red card may be suspended from future games.
A player can be banned for two consecutive matches if they receive a red card due to dissent.
Players who commit serious foul play or violent conduct are suspended for a minimum of three games.
For example, FIFA temporarily suspended Brazilian soccer star Neymar for four matches following a game against Chile.
Another example took place during the 2014 FIFA World Cup, when Luis Suarez bit Italy's Giorgio Chiellini in one of the most shocking incidents in recent soccer history.
He was ultimately banned for nine games and unable to play the rest of the World Cup.
Can a soccer team win with a red card?
Yes, it is possible for a team to win with only 10 players on the field -- although it is challenging.
If the team loses possession or commits another foul (i.e., another red card) while playing shorthanded, it will put them at a further disadvantage.
Teams playing with fewer players often focus on defensive tactics and keeping possession of the ball instead of trying to score goals.
There you have it -- everything you need to know about soccer.
Now you can watch/play soccer at your leisure with confidence knowing everything you need to know.
Enjoy soccer!
What is a stoppage time in soccer?
A stoppage time, in soccer, is an extra playing time that is added at the discretion of the referee after regulation play (of 90 minutes) has ended to compensate for stoppages in play caused by injuries, substitutions, or other interruptions.
Remember that in soccer, the regulation time is 90 minutes only, but the clock keeps running from the start to the finish (of the 90 minutes), even when a ball is out of bound or when the game is not being actively played.
This is idle time or wasted time because the clock just keeps running from the start to the finish.
To compensate for those loss time, a stoppage time is added to the regulation time of 90 minutes -- hence, 90 minutes + stoppage time.
The stoppage time is usually about 4 to 8 minutes, depending on the flow of the game.
Enjoy the game of soccer.
What is offside?
Offside is the most confusing rule of the soccer game -- especially more so for people new to the game of soccer.
An offside rule is used to make players play the game fairly without cheating by moving behind the defenders (line) before the ball gets past the last line of defenders.
The key phrase is: past the last line of defenders.
This means that offensive players (usually forward and midfield players -- the frontline players -- goal scorers) cannot move forward past the last line of defenders WHILE the ball is still not travelling past the last line of defenders.
They must stay "at least" inline with the last line of defender(s) WHILE the ball is still not travelling past the last line of defenders.
Once the ball is travelling past the last line of defenders everything is fair game.
You can move forward as many players as you want past any defender(s) and it is fair game.
The key point to remmeber is that, you cannot be ahead of the ball if you're behind the last line of defenders.
You can be behind the last line of defenders if the ball is "already" beyond you (or ahead of you) and you're chasing the ball and not the other way around -- you're not offside.
In that case, you can be miles and miles behind the last line of defenders and you're not offside.
This is to prevent offensive player(s) from cheating by sneaking behind the last line of defender(s) before the ball passes the last line of defender(s).
This rule puts offensive players from having an advantage (or a head start) to the ball and thus making the game more fair.
Think of it this way: The "offside" line is moving with the "last line" of defenders WHILE the ball is still not travelling past the last line of defenders -- and the ball is moving or in the process of moving past the last line of defenders.
This is the case where the offensive player(s) has the posession of the ball and is moving forward with the ball and looking to pass the ball to their teammates and threatening to score on the apposing team.
You cannot pass the ball to your teammates "IF" your teammate is already past the "last line" of defender(s); or you cannot kick the ball forward toward the goal (or toward any area inide the goal area if it is near the goal area) "IF" your teammate is already past the "last line" of defender(s).
The key phrase is: your teammate is already past the "last line" of defender(s).
Your teammate(s) must stay "at least" inline with the last line of defender(s) in order for you to pass the ball to your teammate(s).
This is to prevent cheating and makes the game fair.
What if all of the apposing players are well into your side of the field (marked by the half-field line)?
In that case, there are no offside violation and you can send as many players behind the last line of their defenders as you wish because the apposing team moved beyond their field of right -- that is, they're moving beyond their half of the field.
When a team moves (or sends) all of their players (with the exception of their goalie) beyond their half of the field, they've waived their right to the offside rule.
Make note: the goalie does not count as a player present in their own half field for the half field offside rule purpose.
In other words, a goalie can be present in their own half field and still not receiving the offside rule protection "IF" a team moves (or sends) all of their "other" players beyond their half of the field -- and therefore, they've waived their right to an offside rule protection.
Yes, teams do that on a regular basis, especially when they're behind and they need to send all of their players beyond their half of the field to bunch up on the apposing team so that they can score goals.
The Offside Line
This is the same as hockey where a player cannot pass a puck to his teammate that is already inside the zone line of the apposing team.
But the difference is, in soccer, the offside line is moving with the last line of defender(s) -- while in hockey the offside line stays fixed and not moving.
In soccer, you can be already past the last line of defender and not being called "offside" IF your teammate who has posession of the ball and is moving forward with the ball but "HAVE NOT" passed the ball past the last line of defender.
This is called delay offside and the referee won't blow the whistle because the referee is giving the delay offside player a chance to recover and be "inline" (or onside) and not being "offside".
Once your player is at least inline with the last line of defender(s) you can pass the ball forward and it is fair game.
The key word is "forward".
If you pass the ball latteral or backward, it is still not an "offside" incident yet -- it is still in a delay offside stage.
Only when the ball is moving "forward" past the last line of defender that it is an "offside" incident and the referee will blow the whistle.
On the other hand, if your teammate is already behind the last line of defender and you pass the ball to your teammate (who is already past the last line of defender) or if you kick the ball forward toward the goal in an attempt to shoot the ball and try to score a goal, the referee will blow the whistle to make an offside call -- because the offside rule says that a player cannot be behind the last line of defender when a ball passes the last line of defender.
Two Key Points To Remember:
1. The "offside" line is moving with the "last line" of defenders.
2. Only when the ball is moving "forward" past the last line of defender that it is an "offside" incident and the referee will blow the whistle.
In conclusion: The offside rule is a rule to prevent cheating.
If a player is being called for an offside, it is said to be that the player is caught cheating.
That is it for offside rule.
There you have it -- everything you need to know about soccer.
Now you can watch/play soccer at your leisure with confidence knowing everything you need to know.
Enjoy the game of soccer.
The Throw In Rule
The throw in rule states that the player throwing the ball into the field of play must be outside the white boundary line and his/her foot must not touch any part of the boundary (white) line.
The ball must be above the head of the player throwing the ball and both hands must touch the ball while throwing the ball into the field of play, and both feet must be planted on the ground while throwing the ball into the field of play.
The Throw In Rule Contains Four Things:
1. The foot (or feet) must be outside the white boundary line and must not touch any part of the boundary (white) line.
2. The ball must be above the player's head while throwing the ball.
3. Both hands must touch the ball while throwing the ball.
4. Both feet must be planted on the ground while throwing the ball.
In other words, (1) the feet must be outside the white boundary line while throwing the ball into the field of play and (2) the ball must be above the player's head and (3) the player must hold the ball with both of his/her hands and (4) both feet must be planted on the ground while throwing the ball into the field of play.
In Summary:
You cannot throw the ball into the field of play with just one hand and/or from either side of player's head.
You must use both hands and the ball must be above the player's head while throwing the ball into the field of play.
You cannot jump or lift any foot off the ground while throwing the ball into the field of play.
Passing The Ball To Your Own Goalkeeper
Whenever a player passes the ball to his/her own goalkeeper using his/her foot the goalkeeper cannot touch that ball with his/her hands, even when this action occurs inside the goal area where the goalkeeper usually handling the ball with his/her hands.
Because a player passes the ball to his/her own goalkeeper using his/her foot it nullifies the goalkeeper's right to use his/her hands to handle the ball.
The ball becomes "live" and "toxic" and the goalkeeper cannot touch it with any of his/her hands.
This is similar to as if the goalkeeper is outside of the goal area where the goalkeeper is just like an ordinary player on the field and cannot touch the ball with any of his/her hand.
Now if a player uses his/her head or any part of his/her body (except the hands/feet) to pass the ball to his/her own goalkeeper then the goalkeeper can legally touch the ball with his/her hands.
For example, a player can use his/her head or any part of his/her body like his/her shoulders, back side, left side, right side, chest, tummy, buttock or even his/her thigh to pass the ball to his/her own goalkeeper and it is legal for the goalkeeper to legally touch the ball with his/her hands.
Only when a player uses his/her foot to pass the ball then the ball becomes "live" and "toxic" and the goalkeeper cannot touch it with any of his/her hands.
You will often see a player passes the ball to his/her own goalkeeper and the goalkeeper receives and handles that ball with his/her own foot/feet (and not with his/her hands) because the goalkeeper cannot touch it with any of his/her hands.
EXCEPTION: The only exception to that rule is when a player throws a ball with his/her both hands to inbound the ball to the goalkeeper [to inside the goalkeeper area] -- and because the player uses his/her hands to handle the ball -- therefore neutralizes the "live" and "toxicity" touching of the ball and the goalkeeper can legally touch it with any of his/her hands.
Note that the goalkeeper can touch it with any of his/her hands only inside the goalkeeper area.
The Real Reason Americans Call it 'soccer'
While calling the world's most popular sport "soccer" is typically depicted as a symbol of American ignorance, the reason we don't call it "football" like the rest of the world is because of a feeling of resentment and jealousy toward each other by both sides [the British and Americans].
This root of resentment dated back to the American Revolution when newly independence Americans tried to be different than their forbearance British heritage.
The first act of resentment was the fight for independence from England.
The second act of resentment was the adoption of the new spelling of the English language spearheaded by Noah Webster, the famed inventor of the Webster Dictionary.
[A Side Note: As you are already well-aware today we have the British spellings and the American spellings of certain words in the English language.
The fact that there are British and American spellings of different words is a bane of linguists and study-abroaders in English-speaking countries.
For the different spellings, we can thank those pesky American revolutionaries.
In 1789, Noah Webster of Webster's Dictionary fame spearheaded the push toward "American" variations on some words.
This push for variations was driven by wanting to be different [and to some extent a result of resentment toward their forbearance British heritage].
For the most part, the alterations of the words involved removing "superfluous" (or unnecessary) letters like the U in "colour", "behaviour," or removing "ue" from "catalogue" or removing the ending with "-ise" and replacing it with "-ize" as in "organize", "recorgnize", "realize", "modernize", "characterize", "finalize," and removing the final "-me" in "programme."
One particular un-superfluous or un-necessary word that Noah Webster seemed to get irritated by is the word "grey," the British English word.
Gray verses Grey
Gray is the more popular spelling in the US, while grey reigns supreme in the UK as well as Ireland, Australia, and other places that use British English.
Was there a need to be different in gray verses grey?
Appearantly there was! -- according to Noah Webster -- as to go along with his alteration of the superfluous colour verses color.]
Now let's get back to our main subject: "soccer"
The third act of resentment was the adoption of the game of "soccer" as the official version of American game name.
The word "soccer" is not an American invention -- it was a British invention but for some reason or another [a resentment perhaps?] that British people stopped using only around 40 years ago, according to a 2014 paper by University of Michigan professor Stefan Szymanski.
The word "soccer" comes from the use of the term "association football" in Britain, and goes back 200 years (right around the 1880s).
Really?
How?
.... "soccer" comes from the use of the term "association football" ?
How?
I'm a little skeptical about this link/association of the two words: "soccer" and "association football."
I wish the author of the paper had gone a little bit deeper into the reason as to why the link/association of the two words: "soccer" and "association football."
Anyhow, let's continue on:
In the early 1800s, a bunch of British universities took "football" — a medieval game — and started playing their own versions of it, all under different rules.
To standardize things across the country, these games were categorized under different organizations with different names.
One variant of the game you played with your hands became "rugby football."
Another variant came to be known as "association football" after the Football Association formed to promote the game in 1863, 15 years after the rules were made at Cambridge University.
Right around the 1880s "Rugby football" became "rugger" for short, then "rugby" as it is known today.
"Association football" became "soccer" [in Britain].
After these two sports (Rugby and Soccer) spread across the Atlantic, Americans invented their own variant of the game that they simply called "football" in the early 1900s, which is known today to the British as American Football (i.e., the New England Patriots, the Chicago Bears, the Miami Dolphins, etc.)
Then everything got distinguised and different when "Association football" became "soccer" in America, and what was called "gridiron" in Britain became simply "football" in America (i.e., the New England Patriots, the Chicago Bears, the Miami Dolphins, etc.)
The interesting thing here is that Brits still used "soccer" regularly for a huge chunk of the 20th century.
Between 1960 and 1980, "soccer" and "football" were "almost interchangeable" in Britain, Szymanski found.
Then everything changed (via Szymanski):
"Since 1980 the usage of the word 'soccer' has declined in British publications, and where it is used, it usually refers to an American context.
This decline seems to be a reaction against the increased usage in the US which seems to be associated with the high point of the NASL (National Association of Soccer League) around 1980."
Most British people stopped saying "soccer" because of (resentment] of its American connotations, however, UK broadcaster Sky Sports still used it to brand wildly-popular TV shows "Soccer Saturday" and "Soccer A.M."
The Gridiron (from Wikipedia):
American football (referred to simply as football in the United States and Canada: i.e., the New England Patriots, the Chicago Bears, the Miami Dolphins, etc.), also known as gridiron, evolved in the United States, originating from the sports of soccer and rugby.
The first American football match was played on November 6, 1869, between two college teams, Rutgers and Princeton, using rules based on the rules of soccer at the time.
A set of rule changes drawn up from 1880 onward by Walter Camp, the "Father of American Football", established the snap, the line of scrimmage, eleven-player teams, and the concept of downs.
An Excerpt of Football (known today as Soccer) History:
There is no clear documentation stating the date and place of origination of today's most popular sport - world football (but we Americans refer to it as soccer).
However, most historians agree that some type of a ball game has been played for at least over 3000 years.
In 1820 in the USA, football (known today as Soccer) was played among the Northeastern universities and colleges of Harvard, Princeton, Amherst and Brown.
In 1848 the rules were further standardized and a new version was adopted by all the schools, college and universities, known as the Cambridge Rules.
In 1862 the first soccer club formed anywhere outside of England was the Oneida Football Club, Boston USA.
There you have it -- everything you need to know about soccer, including its history.
Now you can watch/play soccer at your leisure with confidence knowing everything you need to know.
Enjoy the game of soccer everybody.